EUROPEAN ORGANISATION FOR NUCLEAR RESEARCH (CERN)
Submitted to: JHEP CERN-PH-EP-2015-032
22nd September 2015
Measurement of charged-particle spectra in
Pb+Pb collisions at
√
s
NN= 2.76 TeV with the
ATLAS detector at the LHC
The ATLAS CollaborationAbstract
Charged-particle spectra obtained in Pb+Pb interactions at √sNN = 2.76 TeV and pp interactions at√s = 2.76 TeV with the ATLAS detector at the LHC are presented, using data with integrated luminosities of 0.15 nb−1 and 4.2 pb−1, respectively, in a wide transverse momentum (0.5 < pT < 150 GeV) and pseu-dorapidity (|η| < 2) range. For Pb+Pb collisions, the spectra are presented as a function of collision centrality, which is determined by the response of the forward calorimeters located on both sides of the interaction point. The nuclear modification factors RAA and RCP are presented in detail as a func-tion of centrality, pT and η. They show a distinct pT-dependence with a pro-nounced minimum at about 7 GeV. Above 60 GeV, RAA is consistent with a plateau at a centrality-dependent value, within the uncertainties. The value is 0.55 ± 0.01(stat.) ± 0.04(syst.) in the most central collisions. The RAA dis-tribution is consistent with flat |η| dependence over the whole transverse mo-mentum range in all centrality classes.
c
2015 CERN for the benefit of the ATLAS Collaboration.
Reproduction of this article or parts of it is allowed as specified in the CC-BY-3.0 license.
Prepared for submission to JHEP
Measurement of charged-particle spectra in Pb+Pb
collisions at
√
s
NN= 2.76 TeV with the ATLAS
detector at the LHC
The ATLAS Collaboration
Abstract:
Charged-particle spectra obtained in Pb+Pb interactions at √sNN = 2.76 TeV and pp interactions at √s = 2.76 TeV with the ATLAS detector at the LHC are presented, using data with integrated luminosities of 0.15 nb−1 and 4.2 pb−1, respectively, in a wide transverse momentum (0.5 < pT < 150 GeV) and pseudorapidity (|η| < 2) range. For Pb+Pb collisions, the spectra are presented as a function of collision centrality, which is determined by the response of the forward calorimeters located on both sides of the interaction point. The nuclear modification factors RAA and RCPare presented in detail as a function of centrality, pT and η. They show a distinct pT-dependence with a pronounced minimum at about 7 GeV. Above 60 GeV, RAA is consistent with a plateau at a centrality-dependent value, within the uncertainties. The value is 0.55 ± 0.01(stat.) ± 0.04(syst.) in the most central collisions. The RAA distribution is consistent with flat |η| dependence over the whole transverse momentum range in all centrality classes.
Contents
1 Introduction 1
2 The ATLAS detector 3
3 Datasets 4
4 The centrality of Pb+Pb collisions 7
5 Charged-particle track selection 8
5.1 Modelling of track reconstruction parameters 8
5.2 Requiring pointing to the primary vertex 10
5.3 Matching tracks to calorimetric jets 13
5.4 Merging triggered data samples 15
6 Acceptance and efficiency corrections 17
7 Systematic uncertainties 19 7.1 Absolute normalization 20 7.2 Event selection 20 7.3 Track selection 20 7.4 Correction procedure 21 8 Results 22 9 Summary 31 1 Introduction
High-energy heavy-ion (HI) collisions produce a hot and dense matter, the quark-gluon plasma, in which quarks and gluons become deconfined [1–4]. Charged hadrons of high transverse momentum (pT) are a tool that can be used to study this strongly interacting matter [5, 6]. Since the start of the LHC operation with heavy ions in 2010, it has been possible to study charged-particle production in HI collisions in a new energy regime.
The first results from the LHC experiments showed that jets emerging from the me-dium created in such collisions have lower energy than expected in the absence of meme-dium effects [7, 8]. The measurement of fully reconstructed jets by the ATLAS experiment re-vealed that the energy loss of the high-energy partons in the medium, commonly referred to as jet quenching, results in a lower yield of jets at fixed pT. The yield is suppressed in
central collisions with respect to the yield in pp collisions by factor of two to four [9,10]. Ad-ditional important information about the energy-loss mechanism is provided by the study of jet fragmentation functions [11,12]. These show an enhancement in the charged-particle fragment yield in central collisions with respect to those measured in the peripheral ones for transverse momentum pT . 4 GeV, a reduction for 4 GeV . pT . 30 GeV and a small enhancement for pT& 30 GeV.
As jets lose energy and the pattern of jet fragmentation is modified in HI collisions, it is expected that the resulting spectrum of hadrons, which originate from parton frag-mentation, is also modified. The results from the LHC experiments [13, 14] established that hadron suppression at the LHC is larger than that measured at RHIC [1–4]. At pT values of 6–7 GeV the suppression reaches a factor of five for nucleus–nucleus collisions at a centre-of-mass energy per nucleon–nucleon pair √sNN = 200 GeV and a factor of seven at √
sNN = 2.76 TeV. Results from the LHC experiments show that the suppression diminishes at higher pT.
Several theoretical models attempt to describe the behaviour of the data at high pT [15,16], using previous measurements by ALICE and CMS; however the behaviour above pT ≈ 50 GeV is not strongly constrained by the data. An attempt was made to pre-dict the behaviour of the suppression at a fixed pT as a function of rapidity [17], but such dependence has not yet been measured. The ATLAS tracking system has a wide rapidity coverage and thus allows to measure this pseudorapidity dependence.
The suppression of hadron production in HI collisions can be quantified using the nuclear modification factor (RAA), a ratio of the measured charged-particle production yield in HI collisions to the expected rate based on the charged-particle production in nucleon– nucleon collisions. Collisions with complete nuclear overlap are called central collisions, and as the distance between nuclear centres increases, the collisions become more and more peripheral. The hard scattering rate is higher in more central collisions because of greater nuclear overlap where more nucleons in one nucleus can hard-scatter with nucleons in the other. Such an enhancement is expected by the Glauber model to be proportional to the product of nucleon densities in the transverse plane; the ratio is corrected for this by hTAAi, which is estimated as the number of nucleon–nucleon collisions over their cross section [18]. Neglecting isospin effects, the nucleon–nucleon hadron-production cross section can be approximated by the corresponding pp cross section, σNN ≈ σpp, and thus the nuclear modification factor can be expressed as
RAA = 1 hTAAi 1/Nevt d2NPb+Pb/dηdpT d2σ pp/dηdpT , (1.1)
where Nevt is the number of Pb+Pb events, d2NPb+Pb/dηdpT is the differential yield of charged particles in Pb+Pb collisions and d2σpp/dηdpT is the differential charged-particle production cross section measured in pp collisions. It is expected that in the absence of nuclear effects, the ratio RAA will be unity in the region of pT where hadron production is dominated by hard scattering processes.
The modifications of the particle spectra can also be studied using the nuclear modific-ation factor RCP, defined as the ratio of the charged-particle yield in each centrality class
to the yield in a chosen peripheral class, both scaled by their corresponding hTAAi. The nuclear modification factor RCP is defined as
RCP(pT, η) = hTAA,Pi hTAA,Ci 1/Nevt,C d2NPb+Pb,C/dηdpT 1/Nevt,P d2NPb+Pb,P/dηdpT , (1.2)
where indices P and C denote quantities obtained in peripheral collisions and for a given centrality, respectively. Measuring RCP is another way to examine the suppression of hadron production in HI collisions.
This paper presents a high-statistics measurement of charged-hadron spectra, RAAand RCP in the transverse momentum range 0.5 < pT < 150 GeV in Pb+Pb collisions using data recorded by the ATLAS experiment in the 2010 and 2011 HI physics runs of the LHC at √sNN = 2.76 TeV, and the pp data at the same value of
√
s recorded in the 2011 and 2013 physics runs. The total integrated luminosity of the combined Pb+Pb sample is 0.15 nb−1, and that of the combined pp sample is 4.2 pb−1.
2 The ATLAS detector
The measurements presented in this paper were performed using the ATLAS inner de-tector (ID), calorimeter, muon spectrometer, and the high-level trigger and data acquisition systems [19]. The ID measures charged-particle tracks within the pseudorapidity1 interval |η| < 2.5 using a combination of silicon pixel detectors (Pixel), silicon microstrip detectors (SCT), and a straw tube transition radiation tracker (TRT), all immersed inside a 2 T axial magnetic field. All three tracker systems are composed of a barrel and two symmetrically placed end-cap sections. The Pixel is composed of three layers of sensors with nominal pixel size 50 µm × 400 µm. The SCT barrel section contains four layers of double-sided modules with 80 µm pitch sensors, while the end-caps consist of nine layers of double-sided modules with radial strips having a mean pitch of 80 µm. The two sides of each layer in both the barrel and the end-caps have a relative stereo angle of 40 mrad. The TRT contains up to 73 (160) layers of staggered straws interleaved with fibers (foils) in the barrel (end-cap). Charged particles in the barrel region with pT& 0.5 GeV and |η| < 1.0 typically traverse 3 layers of silicon pixel detectors, 4 layers of double-sided microstrip modules, and 36 straws. The calorimeter system consists of a liquid argon (LAr) electromagnetic (EM) calori-meter covering |η| < 3.2, a steel–scintillator sampling hadronic caloricalori-meter covering |η| < 1.7, two LAr hadronic calorimeters covering 1.5 < |η| < 3.2, and two LAr forward calori-meters (FCal) covering 3.1 < |η| < 4.9. The two FCal modules are composed of tungsten and copper absorbers with LAr as the active medium, which together provide ten interac-tion lengths of material. The hadronic calorimeter has three sampling layers longitudinal in shower depth in |η| < 1.7 and four sampling layers in 1.5 < |η| < 3.2, with a slight overlap
1ATLAS uses a right-handed coordinate system with its origin at the nominal interaction point (IP) in
the centre of the detector and the z-axis along the beam pipe. The x-axis points from the IP to the centre of the LHC ring, and the y-axis points upward. Cylindrical coordinates (r, φ) are used in the transverse plane, φ being the azimuthal angle around the beam pipe. The pseudorapidity is defined in terms of the polar angle θ as η = − ln tan(θ/2).
of the two regions. It has a ∆η × ∆φ granularity of 0.1 × 0.1 for |η| < 2.5 and 0.2 × 0.2 for 2.5 < |η| < 4.9.2 The EM calorimeter is segmented longitudinally in shower depth into three compartments with an additional pre-sampler layer. It has a granularity that varies with layer and pseudorapidity, but which is generally much finer than that of the hadronic calorimeter. The middle sampling layer, in which EM showers typically deposit the largest fraction of their energy, has a granularity of 0.025 × 0.025 over |η| < 2.5.
The minimum-bias trigger scintillator (MBTS) counters are located at a distance of 3.56 m along the beamline from the centre of the ATLAS detector and cover 2.1 < |η| < 3.9 on each side. Each MBTS counter consists of 16 scintillator pads. Signals from the pads were used as an input to the trigger system in the 2010 run and the time difference between hits in the two sides of the MBTS was used to select good events in both the 2010 and 2011 runs.
The zero degree calorimeter (ZDC) consists of two arms, positioned at z = ±140 m from the centre of the ATLAS detector, and detects neutrons and photons with |η| > 8.3. Signals from the ZDC are used by the trigger systems. The ZDC trigger thresholds were set just below the single-neutron peak on each side.
The selection of events was done in several steps. First, events were required to satisfy a hardware-based level-1 (L1) trigger. The L1 trigger selects events with energy deposition in the calorimeters above a preset level, or events with signals from the ZDC. Such events are further processed by software-based high-level triggers (HLT).
3 Datasets
This analysis uses data from the 2010 and 2011 Pb+Pb data-taking at √sNN = 2.76 TeV and data from the 2011 and 2013 pp data-taking at the same centre-of-mass energy, √
s = 2.76 TeV. A summary of all data samples used in this analysis is given in table1. All 2010 Pb+Pb data were collected with a minimum-bias (MB) trigger. It required a presence of a neutron or photon on either side of the ZDC or presence of a hit in the MBTS on each side of the ATLAS detector.
In the 2011 data-taking, events were recorded with a MB trigger and a jet trigger. The transverse energy measurements used by the trigger system is evaluated at the elec-tromagnetic scale. The MB events were required either to have the transverse energy, ET, in the whole calorimeter exceeding 50 GeV at the L1 trigger or to have an ID track reconstructed in the event in coincidence with the ZDC signals on both sides. For a jet trigger, events were preselected for reconstruction by the HLT if they deposited a trans-verse energy of ET > 10 GeV in the calorimeters at L1 or if the ZDC produced signals in coincidence on both sides of the detector. Such events were analysed by the HLT using a jet-finding algorithm on calorimeter towers after underlying-event subtraction [20]. All events containing a jet found with the anti-ktalgorithm [21] with radius parameter R = 0.2 and with ET, estimated in the trigger system, of at least 20 GeV were accepted. The HLT uses algorithms very similar to those used in the offline jet reconstruction.
2
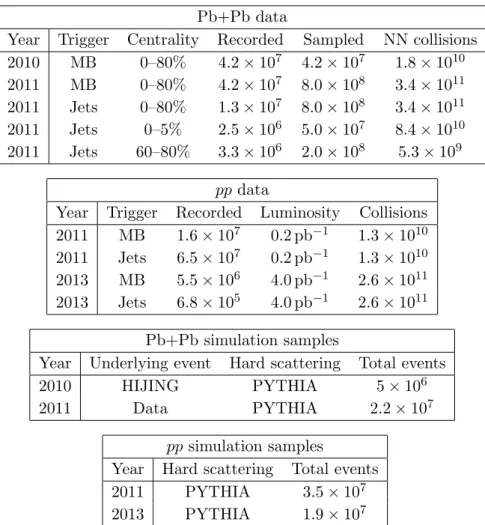
Pb+Pb data
Year Trigger Centrality Recorded Sampled NN collisions 2010 MB 0–80% 4.2 × 10⁷ 4.2 × 10⁷ 1.8 × 10¹⁰ 2011 MB 0–80% 4.2 × 10⁷ 8.0 × 10⁸ 3.4 × 10¹¹ 2011 Jets 0–80% 1.3 × 10⁷ 8.0 × 10⁸ 3.4 × 10¹¹ 2011 Jets 0–5% 2.5 × 10⁶ 5.0 × 10⁷ 8.4 × 10¹⁰ 2011 Jets 60–80% 3.3 × 10⁶ 2.0 × 10⁸ 5.3 × 10⁹ pp data
Year Trigger Recorded Luminosity Collisions 2011 MB 1.6 × 10⁷ 0.2 pb−1 1.3 × 10¹⁰ 2011 Jets 6.5 × 10⁷ 0.2 pb−1 1.3 × 10¹⁰ 2013 MB 5.5 × 10⁶ 4.0 pb−1 2.6 × 10¹¹ 2013 Jets 6.8 × 10⁵ 4.0 pb−1 2.6 × 10¹¹
Pb+Pb simulation samples
Year Underlying event Hard scattering Total events
2010 HIJING PYTHIA 5 × 10⁶
2011 Data PYTHIA 2.2 × 10⁷
pp simulation samples
Year Hard scattering Total events
2011 PYTHIA 3.5 × 10⁷
2013 PYTHIA 1.9 × 10⁷
Table 1. Summary of the data and simulation samples used in the analysis. “MB” stands for minimum bias. For Pb+Pb data, the column “Recorded” lists how many events for a given data-taking period, trigger and centrality interval were written to disk. “Sampled” is the total number of events, of which only a fraction were recorded. The “NN collisions” column in Pb+Pb lists the number of binary nucleon–nucleon collisions equivalent to the “Sampled” events based on the Glauber model [18]. For pp data, the meaning of the column “Recorded” is analogous. “Luminosity” is the total luminosity for a given run, while “Collisions” gives the equivalent number of proton– proton collisions for that luminosity. For the simulation samples, the tables specify the origin of the underlying event (for the Pb+Pb samples) and the hard scattering event. The last columns sum up the total number of generated events. These events may be further broken down, such as by kinematic selection on the underlying hard scattering (see text).
The pp data with √s = 2.76 TeV were obtained in two designated runs in 2011 and 2013. In 2011, the MB trigger required a coincidence of MBTS signals. Events selected with the jet trigger in 2011 were required either to satisfy the requirement of MBTS signals in coincidence and a jet with ET > 10 GeV or to have an area of ∆η × ∆φ = 0.8 × 0.8 in the calorimeters with deposited transverse energy more than 10 GeV at L1.
In 2013, the MB trigger required an event to be randomly selected at L1 in filled bunch crossings and a track to be reconstructed in the ID system. Due to a different
trigger menu designed to take advantage of the higher instantaneous luminosity, only a small fraction of MB events was recorded in 2013 compared to 2011. The jet triggers in the 2013 data-taking used different jet ET thresholds. For the jet-triggered samples with the lowest thresholds, jet ET= 10 GeV and 20 GeV, events were randomly selected by the L1 trigger and then by the HLT using anti-kt jet algorithm with a radius parameter of R = 0.4 and requiring an energy estimate above the corresponding ET threshold. For the jet-triggered samples with thresholds of ET = 40 GeV and 50 GeV, events at L1 were required to deposit transverse energy above 5 GeV and 10 GeV, respectively, in an area of ∆η × ∆φ = 0.8 × 0.8 in the ATLAS calorimeters. For the jet-triggered samples with thresholds ET= 60 GeV and 75 GeV, events were selected by requiring a transverse energy deposition above 15 GeV at L1. Due to the limited DAQ bandwidth, the jet-triggered samples were recorded with different prescales depending on the ET threshold, and these prescales were chosen to evolve with the instantaneous luminosity in the LHC fill. The prescale indicates which fraction of events that passed the triger selection were selected for recording by the data acquisition system.
The integrated luminosities of the pp samples, after application of the event selection criteria, are given in table 1. After accounting for the nuclear thickness, the luminosities in Pb+Pb and pp samples are comparable, as can be seen in the “NN collisions” column.
A Monte Carlo (MC) simulation was used to correct the detector-level charged-particle spectrum for track reconstruction efficiency loss, detector resolution and the contribution of tracks not produced by primary particles. The track reconstruction performance was simulated in the HI environment. The particles were generated by the PYTHIA event generator [22] version 6.423 with parameters chosen according to the so-called AUET2B parameter set (“tune”) [23]. Five samples of √s = 2.76 TeV pp hard scattering events were produced in exclusive intervals of transverse momentum of outgoing partons in the 2 → 2 hard scattering process, with boundaries at 17, 35, 70, 140, 280 and 560 GeV. Each PYTHIA event was embedded in the underlying event of a HI collision, which was obtained using different techniques for the 2010 and 2011 data analyses.
In the 2010 data analysis the environment of Pb+Pb collisions was simulated using 106 events, the same for all five samples, with √sNN = 2.76 TeV. They were produced by the HIJING event generator [24] with default parameters, except that jet quenching was disabled. To simulate the effects of elliptic flow in Pb+Pb collisions, a parameterized centrality-, η- and pT-dependent cos 2φ modulation with randomly selected event plane based on previous ATLAS measurements [25] was imposed on the particles after genera-tion. The detector response in the resulting MC events was evaluated using GEANT4 [26] configured with geometry and digitization parameters matching those of the 2010 Pb+Pb run [27].
In the 2011 data-taking a separate Pb+Pb event sample was recorded which contained approximately 3 × 106 MB events to be used as the underlying events in the MC samples. Approximately 4.3 × 10⁶ hard scattering PYTHIA events (for each of the five different kinematic selections) were overlaid on these data. Thus, the simulations for the 2011 analysis contains an underlying event contribution identical to the data.
Pb+Pb, and reconstructed with the detector conditions matching those from the data-taking period. Minimum-bias and hard scattering samples were simulated for both runs. The MB simulation contained 30 × 106 and 2 × 10⁶ events corresponding to 2011 and 2013 runs respectively. The hard scattering samples were produced in several kinematic regions similarly to the HI samples. For the 2013 samples, the kinematic regions were defined using generated leading jet pT. The total number of events in the hard scattering samples was 5 × 10⁶ and 17 × 106 for 2011 and 2013 conditions, respectively.
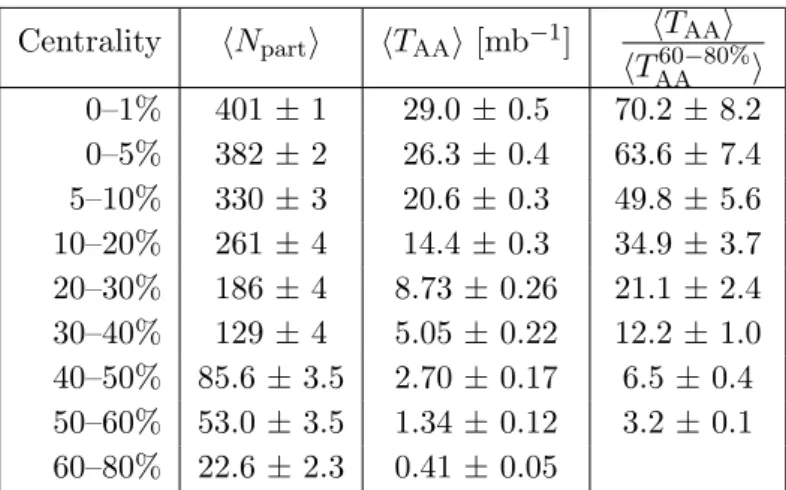
4 The centrality of Pb+Pb collisions
The centrality of Pb+Pb collisions is characterized using the total transverse energy (P ET) measured at the electromagnetic scale by the FCal [25]. A detailed study based on a Glauber Monte Carlo model [18] using pp data at √s = 2.76 TeV estimated the fraction of the total Glauber cross section passing the trigger and the event selection cuts used in this analysis as f = (98 ± 2)%. Taking into account the visible fraction of the total cross section and using theP ET distribution, the Pb+Pb event sample is divided into different centrality classes, defined by the percentiles shown in table 2. For the measurement of RCP defined in eq. (1.2), the “peripheral” reference class is chosen to be 60–80% while the “central” class refers to the remaining classes of more central collisions.
The mean number of participating nucleons, hNparti, as well as TAA are estimated for each centrality class with the same Glauber calculation. The values are shown in table 2, with uncertainties determined by varying the geometric description, as well as the value of f , used in the Glauber calculation. The last column of table2 shows the ratio of hTAAi in each centrality class to that in the most peripheral (60–80%) centrality class.
Centrality hNparti hTAAi [mb−1] hTAAi hTAA60−80%i 0–1% 401 ± 1 29.0 ± 0.5 70.2 ± 8.2 0–5% 382 ± 2 26.3 ± 0.4 63.6 ± 7.4 5–10% 330 ± 3 20.6 ± 0.3 49.8 ± 5.6 10–20% 261 ± 4 14.4 ± 0.3 34.9 ± 3.7 20–30% 186 ± 4 8.73 ± 0.26 21.1 ± 2.4 30–40% 129 ± 4 5.05 ± 0.22 12.2 ± 1.0 40–50% 85.6 ± 3.5 2.70 ± 0.17 6.5 ± 0.4 50–60% 53.0 ± 3.5 1.34 ± 0.12 3.2 ± 0.1 60–80% 22.6 ± 2.3 0.41 ± 0.05
Table 2. Centrality classes used in this analysis. The mean number of participants, hNparti,
the mean value of nuclear overlap function, hTAAi, and its ratio to the most peripheral 60–80%
5 Charged-particle track selection
Charged-particle tracks are reconstructed using the ID system in the pseudorapidity region |η| < 2.5 and over the full azimuth. The minimum pT of reconstructed tracks in the Pb+Pb samples is 0.5 GeV. The abundance of particles produced in HI collisions results in increased occupancies in the ID subsystems causing a deterioration of the ID tracking performance in the most central HI collisions. The degradation of the tracking performance at high occupancy manifests itself in three different ways: a decrease of the tracking efficiency, a worsening in the track momentum resolution and the reconstruction of fake tracks. Fake tracks are composed of randomly associated hits in the detector layers. These phenomena are discussed in this section.
The analysis of the charged-particle spectra presented in this paper refers to primary charged particles directly produced in the nucleus–nucleus interactions with a mean lifetime greater than 0.3 × 10⁻¹⁰s, or long-lived charged particles created by subsequent decays of particles with a shorter lifetime [28]. All other particles are considered secondary. Tracks produced by primary and secondary particles are referred to in what follows as primary and secondary tracks, respectively. An exception is made for muons and electrons coming from the decays of W and Z bosons, whose contributions are excluded from the results, as these leptons follow binary scaling [29–32] and they would affect results with different behaviour. Reconstructed tracks arising from a spurious association of detector-layer hits which originate from different particles and result in a reconstructed track are considered to be fake tracks.
In the MC simulation the categorisation of a particle relies on the matching of a reconstructed track to a generated particle. The matching is done based on contributions of generated particles to the hits in the detector layers. A reconstructed track is matched to a generated particle if it contains hits produced primarily by this particle. The matching procedure is explained in ref. [27]. In addition, the reconstructed track pT is required to be within the range from 0.5pgenT to 1.5pgenT to be considered as successfully reconstructed, where pgenT is the generated transverse momentum of the particle.
5.1 Modelling of track reconstruction parameters
In HI collisions, the occupancies of the three tracking subsystems increase to different degrees. The Pixel detector occupancy is below 1% even in the most central collisions. The corresponding number for the SCT detector is below 10%, while the occupancy in the TRT reaches 90%. To account for the high occupancy in Pb+Pb events, the track reconstruction is configured differently from that in pp collisions [33,34]. In Pb+Pb reconstruction, a larger weight is assigned to hits in the Pixel and SCT detectors, thus resulting in a procedure more robust against fake track production. All tracks reconstructed in HI collisions are extensions of the track candidates from these two subsystems; TRT-based tracks are not used.
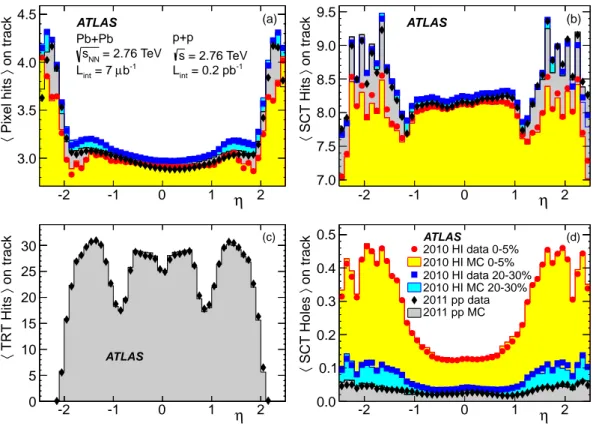
The simulation reasonably reproduces the centrality dependence of the track recon-struction parameters which define the quality of the track. Figure 1 shows the average number of Pixel, SCT and TRT hits and the average number of SCT holes in Pb+Pb
η -2 -1 0 1 2 on track 〉 Pixel hits 〈 3.0 3.5 4.0 4.5 ATLAS Pb+Pb = 2.76 TeV NN s -1 b µ = 7 int L p+p = 2.76 TeV s -1 = 0.2 pb int L (a) η -2 -1 0 1 2 on track 〉 S C T H it s 〈 7.0 7.5 8.0 8.5 9.0 9.5 (b) ATLAS η -2 -1 0 1 2 on track 〉 S C T H o le s 〈 0.0 0.1 0.2 0.3 0.4 0.5 ATLAS 2010 HI data 0-5% 2010 HI MC 0-5% 2010 HI data 20-30% 2010 HI MC 20-30% 2011 pp data 2011 pp MC (d) η -2 -1 0 1 2 on track 〉 T R T H it s 〈 0 5 10 15 20 25 30 (c) ATLAS
Figure 1. (a) The average number of Pixel hits per track, (b) the average number of SCT hits per track, (c) the average number of TRT hits per track, (d) the average number of SCT holes per track, measured in Pb+Pb events in 0–5% (circles) and 20–30% (squares) centrality classes and in pp events (diamonds) as a function of η. The data from the 2010 Pb+Pb run and 2011 pp runs are compared to the corresponding distributions obtained from simulations shown with filled histograms.
events for the 0–5% and 20–30% centrality classes and in the pp data. An SCT hole is defined by the absence of a hit, predicted by the track trajectory, in a given detector layer. The prediction takes both the detector geometry and the active detector area into account. In HI data processing, tracks with holes in the Pixel detector are rejected at earlier stages by the ID track reconstruction. The number of TRT hits is shown only for the pp data, where it plays the most important role.
All parameters shown in figure 1 are sensitive to the momentum distribution of the tracks; therefore the MC tracks were reweighted in pTto match the distributions measured in the data. The TRT covers the pseudorapidity interval |η| < 2, which limits the analysis of the pp data and RAA to this interval, but the TRT hits requirement is necessary to improves track sample purity at high pT. To avoid possible bias at low pT, only tracks above pTof 6 GeV are required to have hits in the TRT. The results with and without such requirement are consistent in the 2–10 GeV interval.
The mean number of Pixel and SCT hits as a function of η shows a relatively weak centrality dependence, whereas the number of SCT holes increases significantly with
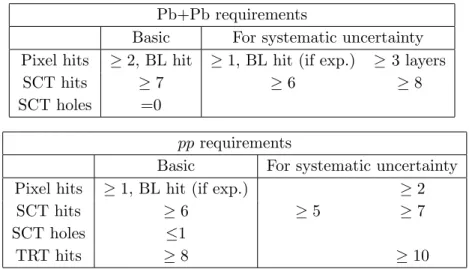
cent-Pb+Pb requirements
Basic For systematic uncertainty Pixel hits ≥ 2, BL hit ≥ 1, BL hit (if exp.) ≥ 3 layers
SCT hits ≥ 7 ≥ 6 ≥ 8
SCT holes =0
pp requirements
Basic For systematic uncertainty
Pixel hits ≥ 1, BL hit (if exp.) ≥ 2
SCT hits ≥ 6 ≥ 5 ≥ 7
SCT holes ≤1
TRT hits ≥ 8 ≥ 10
Table 3. Track selection criteria for Pb+Pb and pp events. “Basic” cuts are used by default in the analysis. Other cuts are used only for estimation of systematic uncertainties. “BL hit” denotes for the requirement of a hit in the innermost pixel layer, so-called B-layer. “BL hit (if exp.)” denotes for the same requirement, but only if such a hit is expected by the track reconstruction algorithm. The TRT hit requirement is applied only to tracks with pT> 6 GeV.
rality. This trend shows the effect of the large occupancy on the SCT pattern-recognition algorithm. A hole on a track may appear if a hit in the SCT is assigned to another track. The fake-track rejection in Pb+Pb collisions requires that there is no hit sharing between tracks. An increased number of SCT holes is an indication of a deterioration of the track quality. Tracks where a SCT hole is present are rejected from the analysis to limit the fake rate.
Tracks are selected for the analysis if they have pT > 0.5 GeV and satisfy all of the quality requirements summarized in table 3. In addition, tracks are required to have |η| < 2.5 in Pb+Pb samples and |η| < 2.0 in pp samples.
5.2 Requiring pointing to the primary vertex
In Pb+Pb collisions the vertex finding and fitting algorithm [35] provides accurate primary vertex (PV) reconstruction. In the most peripheral collisions used in this analysis, the PV reconstruction precision is better than 20 µm in the transverse plane, allowing for efficient separation of tracks that are produced in primary interactions from those that arise from later decays. In more central collisions the PV precision improves inversely proportional to the square root of the number of reconstructed primary tracks in the events. Since the rate of in-time pile-up events in the 0–5% Pb+Pb collisions was less than 5 × 10⁻³, only one PV is considered in each event. For each track, the distance of closest approach to the PV is determined in the transverse and longitudinal directions (d0and z0sin θ respectively), along with the errors of these quantities (σd0 and σz0sin θ) obtained from the covariance matrix of the track fit. They allow for efficient discrimination of tracks arising from secondary particles or tracks with poorly measured pT.
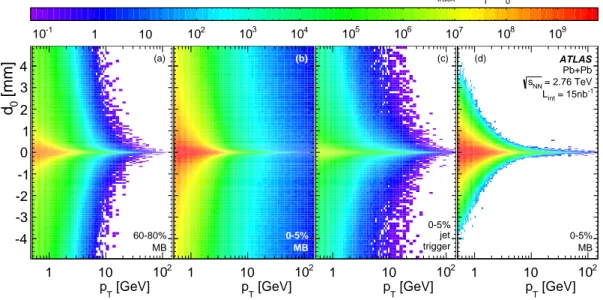
Figure 2 shows scatter plots of the d0 parameter versus pT under different conditions. The distributions of z0sin θ, not shown here, are similar. The widths of the d0 distributions increase with decreasing pT due to the increase of multiple scattering. All tracks satisfy the selection criteria listed in section 5.1. Figure 2(a) shows the d0 versus pT scatter plot for all tracks in the MB events in the 60–80% centrality interval. The width of the d0 distribution decreases with increasing transverse momentum of the tracks. At very high pT it approaches the limit of about 10 µm defined by the Pixel detector resolution. At pT < 2 GeV and large |d0| a significant fraction of tracks originate from weak decays (mainly K0S and Λ0) inside the pixel detector. At higher pT, the region with |d0| exceeding 100 µm is unpopulated. The distribution of track parameters shown in figure2(a) is similar to that in pp collisions, since both systems have relatively low occupancy and thus similar ID tracking performance.
The d0 distributions in the 0–5% most central collisions, shown in figure 2(b), are different from those in peripheral collisions. In central collisions, the d0 distribution ex-tends to large values even for high-pT tracks. To understand the origin of these tracks it is necessary to compare figure2(b) to a distribution obtained from a sample of events meas-ured under the same occupancy conditions obtained for the jet-triggered sample, shown in figure 2(c).
The tracks included in figure 2(c) satisfy the condition ∆R = q
(∆η)2+ (∆φ)2< 0.4, where ∆η and ∆φ are the difference in pseudorapidity and azimuthal angle respectively
[mm] 0 d -4 -3 -2 -1 0 1 2 3 4 [GeV] T p 1 10 102 d0 [mm] [GeV] T p 1 10 102 d0 [mm] [GeV] T p 1 10 102 d0 [mm] [GeV] T p 1 10 102 d0 [mm] d0 [mm] 60-80% MB (a) d0 [mm] 0-5% MB (b) d0 [mm] 0-5% jet trigger (c) d0 [mm] 0-5% MB ATLAS Pb+Pb = 2.76 TeV NN s -1 = 15nb int L (d) ] -1 mm -1 )) [GeV 0 d(d T / (dp track z-axis: dN -1 10 1 10 102 103 104 105 106 107 108 109
Figure 2. Distance of closest approach of the track trajectory to the PV in the plane transverse to the beam direction, d0, (a) in 60–80% peripheral collisions of the MB sample, (b) in 0–5% central
collisions of the MB sample, (c) in 0–5% central collisions for the tracks matched to jets in the jet-triggered sample, (d) in 0–5% central collisions of the MB sample after applying cuts on the d0
and z0sin θ significances (see text). The z-axis dNtrack/(dpTdd0) uses a logarithmic scale and is the
same for all panels. White areas in the distributions are at least eleven orders of magnitude below the maximum in panel (b).
between the directions of the tracks and the jet axis. Matching tracks to jets is further described in section 5.3. Since most tracks with low pT are produced via soft interactions, the yield of these tracks is suppressed by the angular matching to jets.
At high pT, the tracks matched to jets represent a sample with relatively fewer fake tracks compared to the one shown in figure 2(b), which is characterized by the presence of large d0 values at high pT. The shape of the d0 distribution is similar to that seen in peripheral collisions. This leads to the conclusion that in central collisions, tracks pop-ulating the region at high pT and large |d0| in figure 2(b) are not due to a modification of the d0 distribution of high-pT tracks, but rather to mismeasured momentum of low-pT charged particles caused by increased occupancy in the SCT detector. The d0 and z0sin θ parameters of the tracks remain properly measured by the Pixel detector, which has a low occupancy even in most central Pb+Pb collisions.
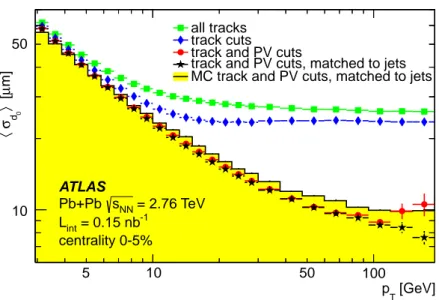
Accurate estimates of the impact parameter resolution, σd0 and σz0sin θ, use all hits, including the SCT hits which define the momentum of the track. An overestimated mo-mentum of the track corresponds to a straighter trajectory with lower multiple scattering. The σd0 and σz0sin θ for such mismeasured tracks are overestimated with respect to the measured pT. This effect is seen in figure3, which shows the average value of the d0 un-certainty, hσd0i, as a function of track pT, measured in the 0–5% most central collisions. Averaging is done over all tracks in the MB sample. The squares represent all reconstruc-ted tracks. Above pT of 10 GeV the hσd0i distribution changes very little with pT due to contamination by tracks from low-pT charged particles with badly measured pT. Applying the track selection requirements explained in section5.1reduces the average σd
0 as shown by diamond symbols (the same sample as shown in figure 2(b)). At high pT, hσd0i is still much larger than that for tracks in the jet-triggered sample which are shown with stars.
From these considerations, it can be concluded that the significances, d0/σd0 and z0sin θ/σz0sin θ, for mismeasured tracks from low-pT particles are much larger than for correctly reconstructed tracks. Rejecting tracks with absolute value of either the transverse or longitudinal impact parameter significance higher than 3.0 from the sample of tracks shown in figure 2(b) produces the scatter-plot presented in figure 2(d). The distribution at high pT more closely resembles the distribution shown in figure 2(a), except for the low-pT tracks, where the cuts on the impact parameter significance reject a large fraction of secondary particles. The hσd0i for these tracks, shown with circles in figure 3, is much closer to the values for tracks in jets up to track pT of 100 GeV and to the results of the MC simulation shown in the figure as a histogram.
Tracks are selected for analysis in Pb+Pb samples if they satisfy the requirements |d0|/σd0 < 3.0 and |z0sin θ|/σz0sin θ < 3.0. Otherwise tracks are not considered to origin-ate in the primary vertex. In addition σd0/hσd0i is also required to be < 3.0.
In pp collisions the PV precision in the transverse plane is about 80 µm for events with 20 tracks and improves to 30 µm for events with 70 tracks [35]. The presence of a jet in an event typically increases the vertex reconstruction precision by contributing tracks. However, using PV pointing cuts similar to those used in the Pb+Pb analysis introduces a correlation between the track selection criteria and the jet multiplicity, which can bias track selection. Therefore, only a loose requirement of |d0| < 1.5 mm is used in the pp track
[GeV] T p 5 50 100 m] µ [ 〉 d0 σ 〈 10 all tracks track cuts track and PV cuts
track and PV cuts, matched to jets MC track and PV cuts, matched to jets
ATLAS = 2.76 TeV NN s Pb+Pb -1 = 0.15 nb int L centrality 0-5% 50 10
Figure 3. The average uncertainty of the transverse impact parameter, hσd0i, as a function of
track pT, measured in the 0–5% central collisions. Squares represent all tracks before applying
cuts. Diamonds denote tracks after track selection requirements (section5.1). The circles, mostly overlapping the stars, are for the tracks satisfying PV pointing requirements, and stars are the same for the tracks also matched to jets above pT> 20 GeV (explained in section 5.3). The filled
histogram is the result for the simulated tracks from primary particles plotted as a function of reconstructed track pTand satisfying the same requirements as in the data.
selection to suppress the contribution of secondary tracks.
5.3 Matching tracks to calorimetric jets
Tracks are required to be matched to jets in order to remove the contribution of fake tracks at high pT. Calorimetric jets are reconstructed using the anti-ktalgorithm with the radius parameters R = 0.2, 0.3, 0.4 and 0.5. In HI collisions, the jet kinematics are obtained by performing the reconstruction on ∆η × ∆φ = 0.1 × 0.1 towers prior to underlying-event subtraction and then iteratively evaluating and subtracting the estimated underlying-event contribution from each jet at the calorimeter cell level, accounting for the effects of elliptic flow modulation in Pb+Pb collisions [25]. The details of the jet reconstruction in Pb+Pb collisions are described in ref. [20]. The inputs to the jet algorithm are topological clusters of calorimeter cells without a background subtraction procedure, as described in ref. [36]. In both the HI and pp collisions, jets in jet-triggered samples are required to be matched to the online reconstructed jets used by the corresponding jet trigger. This ensures that the tracks correspond to the jets which fired the trigger. No such requirement was used for jets in the MB samples.
High-pT tracks are produced by particles formed during parton fragmentation to jets, except for those produced by leptons (`) coming from decays of electroweak bosons, primar-ily W± → `±ν and Z → `+`−. The contribution of leptons from W and Z decays is removed from the data by identifying tracks corresponding to muons in the ATLAS muon spectrometer and assuming the contribution of electrons is the same. The contribution of
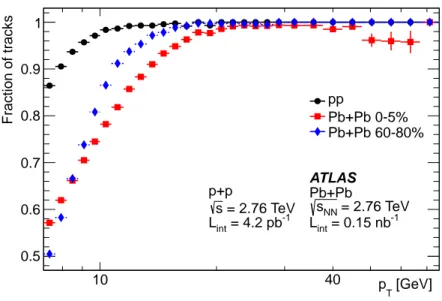
[GeV] T p 10 Fraction of tracks 0.5 0.6 0.7 0.8 0.9 1 pp Pb+Pb 0-5% Pb+Pb 60-80% ATLAS Pb+Pb = 2.76 TeV NN s -1 = 0.15 nb int L p+p = 2.76 TeV s -1 = 4.2 pb int L 40
Figure 4. The fraction of tracks in the MB samples, within all tracks in such sample, residing in a cone of size ∆R = 0.4 around the direction of a jet as a function of the track pT. All tracks
satisfy the requirements listed in section5.1and 5.2. Circles represent pp data using R = 0.4 jets. Squares and diamonds represent Pb+Pb data using R = 0.2 jets in the centrality intervals 0–5% and 60–80%, respectively.
leptons is the largest at pT around 40 GeV and in the most central Pb+Pb collisions where it reaches 5%. The matching of tracks to jets is studied in the data. Figure 4 shows the fraction of tracks, selected by applying the requirements described above, which reside in a cone of size ∆R = 0.4 centred on the jet axis in the Pb+Pb and the pp MB samples. At pT < 10 GeV many tracks cannot be matched to jets due to the limited centrality-dependent reconstruction efficiency for jets with low pT [37,38]. At pT & 15 GeV all tracks reconstructed in the pp data, shown with circles, reside within the cone around the direc-tion of a jet. In peripheral Pb+Pb collisions, shown with diamond symbols, all tracks with pT & 20 GeV are within the cone of a jet. In central collisions, shown with squares, in the same pT range about 99% of all tracks are found within the cone of a jet; however, above 40 GeV this fraction diminishes due to the contributions of misreconstructed tracks.
Tracks with pT > 15 GeV in pp collisions and pT > 20 GeV in Pb+Pb collisions both in the MB and jet-triggered samples are required to be within a cone of ∆R = 0.4 around the jet direction. The jet is reconstructed with a radius parameter of R = 0.2 in Pb+Pb and R = 0.4 in pp collisions.
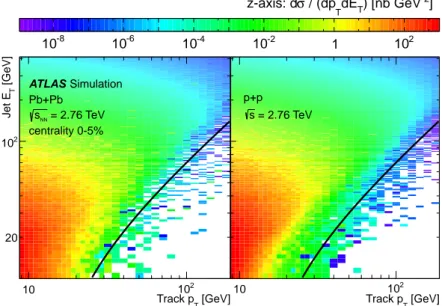
In addition to the requirement of an angular matching, the track pTis also compared to the ET of the jet. The track-to-jet energy balance was studied in the MC simulation. The results are sensitive to the description of parton fragmentation in simulation. In Pb+Pb data the jet fragmentation is modified due to medium effects [11] that are not included in the PYTHIA generator. Therefore, the track-to-jet energy balance cut is chosen such that it only rejects very unbalanced pairs of tracks and jets.
[GeV] T Track p 10 102 [GeV]T Jet E 2 10 20 Simulation ATLAS Pb+Pb = 2.76 TeV NN s centrality 0-5% [GeV] T Track p 10 102 jet Et 2 10 p+p = 2.76 TeV s ] -2 ) [nb GeV T dE T / (dp σ z-axis: d -8 10 10-6 10-4 10-2 1 102
Figure 5. The yield of tracks with reconstructed momentum pT matched to a jet with measured
transverse energy ET. The left panel shows the Pb+Pb yield divided by hTAAi obtained by
em-bedding PYTHIA events into the 0–5% most central Pb+Pb data. The right panel shows the pp cross section as simulated by PYTHIA. Track and jet selections are explained in the text. Lines correspond to the expression ET= 0.8 × pT− 10 GeV.
versus ET of the jet in the 0–5% most central Pb+Pb collisions on the left and in pp collisions on the right. The histograms show the ET of the jet to which the track is matched vs. the track pT. The reconstructed pT of the track is typically lower than the measured jet energy, reflecting the fragmentation process. Matches of tracks to jets with ET less than the track pT result from the finite resolution of the jet energy measurement or track momentum reconstruction, or from badly reconstructed or fake tracks. The solid line shown in the plot corresponds to ET= 0.8 × pT− 10 GeV which was chosen as the cut of the track-to-jet energy balance.
5.4 Merging triggered data samples
The samples obtained with different triggers are combined to construct the spectra, which are equivalent to the unbiased MB spectra and extended to the highest pT values allowed by the luminosity. This is done separately for each data-taking period. The simulation samples are merged by summing the hard scattering and MB distributions according to their cross sections. The data distributions are corrected using the summed MC samples corresponding to the given run period. After applying corrections described in section 6, the data samples are merged from different running periods.
In the data, tracks with pT low enough to not require matching to a jet as explained in section5.3, are taken entirely from the MB samples. They have the proper mixture of all processes presented in the collisions.
Tracks with pT above the track-to-jet matching requirement are taken from both the MB and jet-triggered samples. These tracks are required to be matched to a jet, including
those from MB samples. Jet-triggered samples are used when the corresponding jet trigger efficiency reaches 90%. Efficiencies of the jet triggers defined with respect to the MB triggers are evaluated in refs. [37, 38]. The jet trigger prescale factor is smaller for triggers with higher thresholds. When a jet trigger with a higher threshold also reaches 90% efficiency its sample is larger than the sample with lower jet threshold, and therefore the use of the jet sample with the lower threshold trigger is discontinued. This procedure guarantees that each track matched to a jet is used only once in all samples, even if the same jet was recorded by more than one trigger.
After correcting for average prescale of each sample, the selected tracks are added to produce a single combined sample as explained above. The contributions of triggered samples to the combined sample are shown in figure 6 for the 2013 pp data. The data are divided by a power-law parameterization to better reveal the contributions from each sample. Open circles around unity depict the combined sample of all tracks. The contri-bution of the MB sample below the track-to-jet matching pT threshold (15 GeV), shown with filled circles, coincides with the combined distribution. At higher pT, the tracks from the MB sample contribute only when they are matched to low-energy jets. This part is also shown with filled circles.
At even higher pT, tracks come predominantly from the event samples obtained with jet triggers. Their pT distributions are shown with filled markers; some trigger samples are combined for plot clarity. The contributions from such samples first rise and then decrease, except for the two lowest-threshold trigger samples where only the decrease is
[GeV] T p 10 102 Data / fit 0 0.5 1 1.5 ATLAS p+p 2013 = 2.76 TeV s -1 = 4.0 pb int L
all triggers combined MB > 10, 20 GeV combined T jet E > 40 GeV T jet E
> 40 GeV without jet selection
T jet E > 50, 60 GeV combined T jet E > 75 GeV T jet E
Figure 6. Ratios of the number of tracks from different pp triggered samples to a smooth para-meterization (“fit”) describing the combined sample. Open circles show the ratio for the combined sample of all tracks. Filled circles show the MB sample. Other filled markers show the contributions of tracks in jet-triggered samples. Only one sample is used for all jets with the same ET(see text).
Some samples are combined for visibility of the plot. Open squares show the total number of tracks in the sample of the jet trigger ET> 40 GeV.
presented, and for the highest-threshold trigger sample with ET > 75 GeV. Since jets are selected from each trigger only in an exclusive ET range, the contribution of tracks to the total spectrum rises and falls with ET. The effect of such a jet trigger interval selection is demonstrated by comparison of closed squares (with selection) and open squares (without selection) corresponding to the jet trigger with ET threshold of 40 GeV. Without applying a jet trigger interval selection the ratio starts at low pTat a value significantly below unity. The ratio then rises to unity where it remains flat, consistent with the combined sample of all tracks. However, the statistical uncertainty of the ratio is significantly larger than that for the samples obtained with the higher jet trigger thresholds due to the difference in the integrated luminosity associated with each trigger.
6 Acceptance and efficiency corrections
Corrections to the reconstructed yields in each sample are applied at different stages of the analysis in order to remove detector effects, reconstruction biases and to correct to the particle level. They are derived from data and simulation.
The correction for the fraction of events recorded with different jet and MB triggers is assigned as a weight to each track selected for the analysis. The jet trigger efficiency correction is applied in the same way. The trigger efficiencies are measured in analyses published in refs. [37,38]. This correction is relatively small, since each jet trigger is used only to select jets for which it is at least 90% efficient. The correction for the MB trigger efficiency in Pb+Pb collisions is negligible in all centrality intervals analysed. In the pp data a correction for the vertex reconstruction efficiency is applied. The vertex reconstruction efficiencies are estimated as a function of number of reconstructed tracks in the same way as in ref. [28]. The correction is very small and reaches unity when four or more tracks are selected within an event. After applying these corrections, samples are merged as described in section 5.4.
After the raw spectra from different triggers are merged, they are corrected for second-ary, fake and misreconstructed tracks. The merged spectra are multiplied by the fraction of primary tracks, which is defined as the number of primary tracks divided by the total number of tracks, i.e. including secondary, fake and misreconstructed tracks. The frac-tions are estimated in the MC simulation for 20 bins in η with a width of 0.25, 9 centrality intervals, and separately for positively and negatively charged particles. They are found to have only a weak dependence on particle charge and the sign of η. However, they are dependent on |η| for |η| > 1. Thus, the corrections were merged into seven |η| bins for both charges combined in order to have smaller statistical uncertainty at higher pT. At low pT this correction is dominated by secondary particles and reaches 10% at |η| > 2.25 in the most central Pb+Pb collisions. It decreases at low |η| and in more peripheral collisions. In the pp data samples it does not exceed 4% at any measured η. At pT > 4 GeV the contributions of fakes and secondaries do not exceed 1% in any of the samples and remain at this value up to pT ≈ 70 GeV. At the highest measured pT, misreconstructed tracks contribute significantly, as shown in figure7.
Primary fraction 0.8 0.9 1 [GeV] T p 2 1 2 50 10 Simulation ATLAS p+p, Pb+Pb = 2.76 TeV NN s , s |<1 η | Pb+Pb 0-5% Pb+Pb 60-80% p+p
Figure 7. The fraction of reconstructed tracks matched to primary particles for two Pb+Pb centrality classes (solid markers) and pp (open markers) as a function of track pT. Their systematic
uncertainty bands are shown with solid, dashed and dotted lines for Pb+Pb central collisions, peripheral collisions and pp, respectively, and are further discussed in section7.4.
[GeV] rec T p 1 10 102 [GeV] gen T p 1 10 2 10 Simulation ATLAS Pb+Pb = 2.76 TeV NN s |<1 η centrality 0-5%, | [GeV] rec T p 1 10 102 [GeV] T truth p 1 10 2 10 p+p = 2.76 TeV s |<1 η | z-axis: probability -8 10 10-7 10-6 10-5 10-4 10-3 10-2 10-1 1
Figure 8. Examples of migrations from generated pT(p gen
T ) to reconstructed pT (precT ) for tracks
in the most central collisions in Pb+Pb (left) and for pp (right). The integral of the distribution in each pgenT bin is normalized to unity.
The spectra are then corrected for the track momentum resolution with an iterative Bayesian unfolding procedure [39]. Results are obtained with two iterations. The migra-tion matrices used are shown in figure 8 as functions of the generated particle transverse momentum (pgenT ) and reconstructed transverse momentum of the associated track (precT ).
[GeV] T p 1 10 102 E ff ic ie n c y 0 0.2 0.4 0.6 0.8 1 Simulation ATLAS p+p, Pb+Pb = 2.76 TeV NN s , s |<1 η | [GeV] T p 1 10 102 p+p Pb+Pb 60-80% Pb+Pb 50-60% Pb+Pb 30-40% Pb+Pb 10-20% Pb+Pb 0-5% |<1.75 η 1.5<|
Figure 9. Track reconstruction efficiency as a function of pT for five centrality classes for Pb+Pb
and for pp in two |η| regions. The discontinuity of the pp efficiency at 6 GeV is caused by the change in the TRT hit requirements (see section 5.1). The width of the band represents the systematic uncertainty.
The migration matrices are consistent for both particle charges and for the same η ranges as for the primary fraction correction and are therefore combined.
The unfolded spectra are corrected for the reconstruction efficiency using the efficiency estimated in simulation, defined as the number of primary charged particles matched to reconstructed tracks divided by the total number of generated primary particles. The track reconstruction efficiencies are estimated as a function of reconstructed particle pT, |η| and charge. They are found to agree in the same regions as the primary fractions and are also combined for both charges of particles, both sides of |η| and for |η| < 1. The efficiencies are smoothed by fitting to minimize the effect of statistical fluctuations at high pT in the simulation. A sample of efficiency curves is shown in figure9.
7 Systematic uncertainties
The systematic uncertainties of the measurements presented in this paper arise from several sources, which are summarized at the end of this section in table 4. Uncertainties related to the absolute normalization of the spectra come from the uncertainties of the integrated luminosity of the pp sample and event selection efficiency in Pb+Pb. The systematic uncertainties related to the event selection include the uncertainties on the jet trigger efficiencies used in the Pb+Pb and pp event samples. Uncertainties related to the selection of tracks include possible differences in the data and in the MC simulation. Finally, there are uncertainties in the determination of the applied corrections.
Systematic uncertainties are evaluated by varying parameters in the analysis for each source and observing the effects on the corrections and yields. Variations are applied
simultaneously to the Pb+Pb and pp data, so that final uncertainties on RAA and RCP properly reflect the correlated changes in the numerator and denominator. The total systematic uncertainties are determined by adding the uncertainties from each source in quadrature.
7.1 Absolute normalization
The uncertainty on the integrated luminosity of the pp samples is 3% and is taken into account in the invariant cross section and in the RAAmeasurements presented in this paper. It was estimated in a fashion similar to that previously described by ATLAS [40]. The uncertainty on the fraction of events in the MB sample in Pb+Pb collisions is evaluated in ref. [41] to be 2% for both the 2010 and 2011 runs. This uncertainty affects both the boundaries of the centrality intervals and the centrality-related geometric parameters, hTAAi. The largest effect is in the 90–100% centrality interval, which is not considered in the paper. To avoid double counting in the results presented in this paper, the uncertainty due to the event fraction in the MB sample is included only in the uncertainties of hTAAi and hNparti as given in table 2.
7.2 Event selection
The uncertainties on the determination of the jet trigger efficiencies in different jet samples in the pp sample are evaluated in the analysis published in ref. [38]. The resulting uncer-tainty on the spectra from this contribution does not exceed 3%.
In 2011 the Pb+Pb events were recorded if the anti-kt jet reconstruction algorithm found a jet with radius parameter R = 0.2 and ET > 20 GeV after underlying-event subtraction. The trigger efficiency in Pb+Pb events was studied in the inclusive jet analysis published in ref. [37]. This reaches 90% for jets with ET> 40 GeV and has a weak centrality dependence. The systematic uncertainties on the charged-particle spectra related to the jet trigger efficiency uncertainty is 1%, less than in pp, because only one jet trigger was used in the Pb+Pb data-taking.
7.3 Track selection
The uncertainty due to the track selection reflects possible differences in performance of the track reconstruction algorithms in data and in MC simulation. To estimate this uncertainty, the track quality requirements described in section5.1and the vertex pointing requirement described in section5.2 were tightened or loosened in both data and MC simulation. The resulting uncertainty is below 1% at pTbelow 10 GeV and rises with increasing pT, reaching a maximum of 10% at the highest measured pT for Pb+Pb and 4% for pp collisions.
Fake and secondary particles passing the tracking requirements create a small con-tamination at low pT and are accounted for through the primary fraction correction. The uncertainty of this contamination is due to the unknown relative contributions of primary, secondary and fake tracks. The uncertainty is estimated by comparing the fraction of primary tracks, as defined in this paper, to the fraction of tracks with a reconstructed impact parameter consistent with the particle arising from the primary vertex. In central
collisions, the uncertainty is 5% at the lowest measured pTand decreased to 0.5% at 1 GeV, in all centralities.
The uncertainty due to fake and secondary particles production at high pT is highly correlated with the uncertainty associated with the procedure for matching generator-level particles to reconstructed tracks. The uncertainty is at most 3% at the highest measured pT. In table 4, the high-pT part of the uncertainty on fake and secondary particles is included in the uncertainty of the matching.
7.4 Correction procedure
These uncertainties reflect the possible impact of variations in the derivation of the applied corrections. The uncertainty associated with matching generated particles to reconstructed tracks is correlated with the uncertainty associated with fake and secondary particles at high pT. The correlated part of the uncertainty was removed. To estimate this systematic uncertainty, generator-level to reconstructed-level matchings in simulation with different requirements were considered. The main contribution comes from additional constraints on the transverse momentum of reconstructed track, with respect to the generated transverse momentum of the particle to which the track is matched. The uncorrelated part of this uncertainty is below 1% up to 50 GeV and then rapidly increases with increasing pT. At the highest measured pT, it reaches 20% for Pb+Pb and 15% for pp yields.
The uncertainty associated with the unfolding reflects the need to choose a specific number of iterations to use in the unfolding procedure. It is estimated by changing the number of iterations, and observing the effect on the charged-particle yields. The uncer-tainty remains less than 1% at low pT and increases at high pT where it reaches 8%.
The uncertainty on the pT resolution reflects possible differences in the distortion of track pT in MC simulation and data. To estimate this uncertainty, the pT resolution (the width of the 1 − pgenT /precT distribution) was increased to 1.1 times the nominal width. The 10% broadening was estimated from the resolution of muon pTin the data. The uncertainty is 1% at low pT, but reaches 20% at very high pT.
The systematic uncertainty on the efficiency correction has several contributions. The first is the difference in the distributions for different η ranges and both charges before merging, as explained in section 6. This uncertainty is not higher than 2%. The second contribution is from the uncertainty on the particle composition, estimated from compar-isons of the relative rates of different identified particles types between simulation and the data measured by the ALICE collaboration [42]. This uncertainty is at most 3%. Both corrections play an important role only at low pT. The third uncertainty comes from the uncertainty associated with smoothing the track reconstruction efficiency correction at high pT. This reaches 2% at the highest pT. The more significant uncertainty at high pT comes from the uncertainty associated with the cross sections of the MC samples. These were varied, which resulted in an uncertainty of 5% at the highest pT due to the different acceptance and efficiency corrections of the MC samples.
The systematic uncertainty associated with possible mismodelling of the detector ma-terial is 2% for |η| < 1 and reaches 6% in the highest |η| region [28].
In general, the uncertainties associated with individual sources do not exceed 10%. The exceptions are the track momentum resolution, on the fake tracks at high pT and on the calculation of TAA. Systematic uncertainties [%] Spectra RCP RAA Strongest Source Pb+Pb pp variation Luminosity 3 3 hTAAi 1.5–13 centrality hTAAi/hTAA60−80%i 3.8–12 centrality
Jet trigger efficiency 1 3 1 3 pT
Track selection 10 4 10 10 pT
Fake and secondary tracks 5 0.5 5 5 pT, centrality
Matching gen – rec 20 15 15 13 pT
Unfolding 8 2 4 2 pT
pT resolution 20 7 14 12 pT
Efficiency correction 5 1 4 4 pT, η
Detector material 2–6 2–6 η
Table 4. Maximum values of systematic uncertainties in percent for the charged-particle spectra and the nuclear modification factors RCP and RAA. “Fake and secondary tracks” reflect only the
uncertainty at low pT; the high-pTpart is included in “Matching gen – rec”.
8 Results
The corrected charged-particle spectra measured in Pb+Pb collisions at √sNN= 2.76 TeV are shown in figure10 for the pseudorapidity range |η| < 2 and for five centrality intervals: 0–5%, 10–20%, 30–40%, 50–60% and 60–80% in the pT range 0.5–150 GeV. In figure 11, charged-particle Pb+Pb spectra in the 0–5% centrality interval are shown for eight regions of |η|. Both figures show the spectra divided by the hTAAi of the corresponding central-ity interval compared with the charged-particle production cross sections measured in pp collisions at√s = 2.76 TeV.
The charged-hadron yields in peripheral Pb+Pb collisions, depicted by diamond mark-ers in figure10, show a pTdependence similar to that of pp collisions. Going from peripheral to central collisions, the TAA-scaled Pb+Pb yields increasingly deviate from the pp spectra. This deviation is largest for pT less than 1 GeV and in the pT range 3–30 GeV.
Figure 12shows the nuclear modification factor RCP for four centrality classes (0–5%, 10–20%, 30–40%, 50–60%) with respect to the 60–80% class. The RCPas a function of pT reaches a minimum of 0.22 ± 0.03(syst.) at pT≈ 7 GeV in the 0–5% centrality class. The statistical uncertainty of the value at the minimum is negligible. The measurement of RCP is restricted to pT < 95 GeV because it is limited by the small sample size in the 60–80% centrality class.
[GeV] T p 1 10 102
]
-2) [mb GeV
Tdp
η
/(d
σ
2) d
Tp
π
1/(2
-19 10 -14 10 -9 10 -4 10 10 2 10 ATLAS p+p, Pb+Pb = 2.76 TeV NN s , s -1 = 0.15 nb PbPb int L -1 = 4.2 pb pp int L | < 2.0 η | 〉 AA T 〈 Pb+Pb/ -2 10 × 0-5% -4 10 × 10-20% -6 10 × 30-40% -8 10 × 50-60% -10 10 × 60-80% p+p -2/-4/-6/-8/-10 10 × p+pFigure 10. Fully corrected charged-particle transverse momentum spectra for |η| < 2 shown with filled markers in five centrality intervals: 0–5%, 10–20%, 30–40%, 50–60% and 60–80% as well as the fully corrected charged-particle transverse momentum pp cross section shown by open circles. Statistical uncertainties are smaller than the marker size. Systematic uncertainties are shown by open boxes. The different centrality intervals are scaled down by powers of ten for plot clarity. Each centrality interval is divided by the corresponding hTAAi and plotted together with the pp
cross section scaled by the same factor shown with solid lines. The total systematic uncertainty on the Pb+Pb spectra includes the uncertainty of hTAAi.
Figure 13 shows the nuclear modification factor RAA as a function of pT in five cent-rality intervals: 0–5%, 10–20%, 30–40%, 50–60% and 60–80% constructed as the ratio of the Pb+Pb to pp distributions from figure10. Figure14 shows RAA for 0–5% collisions in eight |η| ranges constructed as the ratio of the Pb+Pb to pp distributions from figure 11. The RAA measured as a function of pT shows a characteristic non-flat pT shape which becomes more pronounced for more central collisions. They first increase with increasing pT reaching a maximum at pT ≈ 2 GeV, a feature commonly associated with the Cronin
[GeV] T p 1 10 102
]
-2) [mb GeV
Tdp
η
/(d
σ
2) d
Tp
π
1/(2
-25 10 -19 10 -13 10 -7 10 -1 10 2 10 ATLAS p+p, Pb+Pb = 2.76 TeV NN s , s -1 = 0.15 nb PbPb int L -1 = 4.2 pb pp int L 0-5% 〉 AA T 〈 p+p Pb+Pb/ |<0.25 η 0.00<| -2 10 × |<0.50 η 0.25<| -4 10 × |<0.75 η 0.50<| -6 10 × |<1.00 η 0.75<| -8 10 × |<1.25 η 1.00<| -10 10 × |<1.50 η 1.25<| -12 10 × |<1.75 η 1.50<| -14 10 × |<2.00 η 1.75<|Figure 11. Fully corrected charged-particle transverse momentum spectra produced in eight |η| ranges shown with filled markers for the centrality interval 0–5%. Statistical uncertainties are smaller than the marker size. Systematic uncertainties are shown with open boxes. The distributions in different |η| intervals are scaled down by powers of ten for plot clarity. Pb+Pb spectra are divided by their corresponding hTAAi and plotted together with the cross section measured in pp collisions.
These results are shown with open markers of the same style. The total systematic uncertainty of the Pb+Pb spectra includes the uncertainty of hTAAi.
effect [43]. Then, RAA decreases with higher pTreaching a minimum at pT ≈ 7 GeV, where the charged-particle suppression is strongest. The rate of charged particles is noticeably suppressed even in the 60–80% centrality interval, reaching a minimum of 0.66±0.09(syst.), where the effects of jet quenching are expected to be smallest. The suppression is strongest in the most central 0–5% collisions, where the minimum is 0.14 ± 0.01(syst.). The statist-ical uncertainties in this pT region are negligible compared to the systematic uncertainties. Above this pT, RAAgenerally increases with increasing pTup to ≈ 60 GeV and then reaches a plateau, consistent with zero slope, at a value of 0.55 ± 0.01(stat.) ± 0.04(syst.) for the
CP R 1 0.2 [GeV] T p 1 10 102 |<2.5 η | ATLAS Pb+Pb = 2.76 TeV NN s -1 = 0.15 nb PbPb int L (50-60%)/(60-80%) (30-40%)/(60-80%) (10-20%)/(60-80%) (0-5%)/(60-80%)
Figure 12. The dependence of the central-to-peripheral nuclear modification factor RCP on pT
measured in the centrality intervals 0–5%, 10–20%, 30–40% and 50–60%. The centrality class 60–80% forms the denominator. Statistical uncertainties are shown with vertical bars and systematic uncertainties with brackets.
AA R 1 0.2 [GeV] T p 1 10 102 |<2.0 η | ATLAS p+p, Pb+Pb = 2.76 TeV NN s , s -1 = 0.15 nb PbPb int , L -1 = 4.2 pb pp int L 60 - 80 % 50 - 60 % 30 - 40 % 10 - 20 % 0 - 5 %
Figure 13. The dependence of the nuclear modification factor RAAon pTmeasured in the centrality
intervals 0–5%, 10–20%, 30–40%, 50–60% and 60–80%. Statistical uncertainties are shown with vertical bars and systematic uncertainties with brackets.
most central collisions.
The comparison of the RAA values with previous measurements from CMS [13] and ALICE [14] in the most central (0–5%) interval, common to all three experiments, is shown in figure 15. For this comparison the ATLAS RAA values are evaluated in the
[GeV] T p 1 10 102
AA
R
-3 10 -2 10 -1 10 1 10 ATLAS p+p, Pb+Pb = 2.76 TeV NN s , s -1 = 0.15 nb PbPb int L -1 = 4.2 pb pp int L 0-5% |<0.25 η 0.00<| -1 2 × |<0.50 η 0.25<| -2 2 × |<0.75 η 0.50<| -3 2 × |<1.00 η 0.75<| -4 2 × |<1.25 η 1.00<| -5 2 × |<1.50 η 1.25<| -6 2 × |<1.75 η 1.50<| -7 2 × |<2.00 η 1.75<|Figure 14. The RAAdependence on pTmeasured in eight |η| ranges for the centrality interval 0–5%.
Statistical uncertainties are shown with vertical bars and systematic uncertainties with brackets. The different |η| ranges are scaled down by powers of two for plot clarity.
pseudorapidity interval |η| < 1, the interval used by the CMS experiment. The ALICE experiment used a similar pseudorapidity interval, |η| < 0.8. The comparison reveals agreement of the measurements within their uncertainties. In other centrality intervals common to ATLAS and ALICE, the results agree as well. The ATLAS results extend the pT reach and precision of the previous measurements.
Figure 16 shows RAA as a function of the mean number of participating nucleons, hNparti, in the four momentum intervals corresponding to the local maximum of RAA in the region 1.7 < pT < 2.0 GeV, the local minimum in the region 6.7 < pT < 7.7 GeV, the plateau region 59.8 < pT < 94.8 GeV and to the pT interval where RAA has an intermediate magnitude, between the minimum and plateau value, in the region 19.9 < pT< 22.8 GeV. In all momentum intervals RAAdecreases with hNparti, however the decrease is strongest for the minimum interval and weakest in the plateau region. In the maximum and intermediate
AA R 1 0.2 [GeV] T p 1 10 102 0 - 5 % ATLAS p+p, Pb+Pb = 2.76 TeV NN s , s -1 = 0.15 nb PbPb int , L -1 = 4.2 pb pp int L ATLAS, CMS, ALICE, |<1.0 η | |<1.0 η | |<0.8 η |
Figure 15. The RAA dependence on pT measured in the centrality interval 0–5%. The
AT-LAS (shown as full circles) and CMS results [13] (shown as open diamonds) correspond to the pseudorapidity range |η| < 1, the ALICE results [14] (open squares) to |η| < 0.8. Statistical uncertainties are shown with vertical bars and systematic uncertainties with brackets.
〉 part N 〈 0 100 200 300 400
AA
R
1 ATLAS p+p, Pb+Pb = 2.76 TeV NN s , s -1 = 4.2 pb pp int L -1 = 0.15 nb PbPb int L | < 2 η | <2.0 GeV) T maximum (1.7<p <7.7 GeV) T minimum (6.7<p <22.8 GeV) T intermediate (19.9<p <94.8 GeV) T plateau (59.8<p 0.2Figure 16. The RAA values plotted as a function of hNparti measured in four transverse
momentum intervals corresponding to the maximum RAA (1.7 < pT < 2.0 GeV), minimum
RAA (6.7 < pT< 7.7 GeV), intermediate RAA (19.9 < pT < 22.8 GeV) and plateau of RAA
(59.8 < pT< 94.8 GeV). The statistical uncertainties, which are smaller than the size of markers in
all but a few cases, are shown with vertical bars and the systematic uncertainties with brackets.
momentum ranges the RAA values are consistent for hNparti < 100, but then deviate at larger hNparti. In the most central collisions, RAA in the maximum interval is comparable
to that in the plateau pT region. Comparing the plateau region to the RAA dependence on hNparti measured with the jets of comparable energy [9], both distributions show similar trend. They have also similar values for peripheral collisions, but in the more central collisions the jet RAA reaches lower values.
To further investigate the nature of the suppression mechanism, the pseudorapidity dependence of RAA was studied. Figure 17 shows the charged-particle cross section in pp collisions and the TAA-scaled yield in Pb+Pb collisions, dσ/dη, measured in the same centrality intervals as the spectra and RAA, integrated over the pT intervals used to char-acterize the shape of RAA in figure 16. The dσ/dη distributions for Pb+Pb, divided by their corresponding hTAAi, are compared to the pp cross section. The shapes of the Pb+Pb dσ/dη distributions change slightly within the four specified pT ranges. At fixed pT, the shapes agree for different centrality intervals as well as for the pp data.
Figure 18 shows RAA measured in the four defined pT intervals as a function of pseu-dorapidity. For all pT intervals RAA shows little dependence on |η| and is generally con-sistent with a flat behaviour within the statistical and systematic uncertainties.
[mb] η /d σ d 0.2 1 2 3 <2.0 GeV T 1.7<p p+p 〉 AA T 〈 Pb+Pb/ 60-80% 50-60% 30-40% 10-20% 0-5% <7.7 GeV T 6.7<p 2 10 × ATLAS p+p, Pb+Pb = 2.76 TeV NN s , s -1 = 0.15 nb PbPb int , L -1 = 4.2 pb pp int L | η | 0 0.5 1 1.5 2 [mb] η /d σ d 0.2 1 <22.8 GeV T 19.9<p 4 10 × | η | 0 0.5 1 1.5 2 <94.8 GeV T 59.8<p 6 10 ×
Figure 17. Fully corrected charged-particle pseudorapidity distributions for four transverse mo-mentum intervals defined in the text: maximum, minimum, intermediate and plateau. The different pT ranges are scaled down by powers of ten. Markers are shifted from the centres of the bin for
plot clarity. For each pTrange, data are shown in the centrality intervals: 0–5%, 10–20%, 30–40%,
50–60% and 60–80%. The statistical uncertainties, which are typically smaller than the size of markers, are shown with vertical bars and the systematic uncertainties with brackets or grey bands. Pb+Pb spectra are divided by the corresponding hTAAi and plotted together with the cross section
measured in pp collisions, shown with the open circles. The total systematic uncertainty of the Pb+Pb spectra includes the uncertainty of hTAAi.