The Impact of a managerial
overconfident narrative on capital
structure decisions
Tiago Emanuel Monteiro Barbosa
Católica Porto Business School April 2019
The Impact of a managerial
overconfident narrative on capital
structure decisions
Dissertation
Presented to Universidade Católica Portuguesa To obtain a Master degree in Finance
by
Tiago Emanuel Monteiro Barbosa
Under the supervision of Paulo Alves, Ph.D.
Católica Porto Business School April 2019
Acknowledgements
This dissertation was accomplished due to the significant addition of a group of people, to whom I express my sincere gratitude:
- To my supervisor, Professor Paulo Alves, for all the support, availability and suggestions that allowed for the constant improvement of this dissertation;
- To Professor Ricardo Ribeiro, for his precious help with the econometric concepts and STATA-related problems;
- To my family and friends for all the constant support and motivation throughout this journey.
Abstract
Capital Structure, which consists on the financing mix used by corporations in order to maximize their value, represents one of the most controversial topics on the corporate finance field. Despite the innumerous studies on this topic there is not yet a consensual theory on what is the ideal capital structure a firm should adopt.
As a consequence, a stream of research began to apply psychological and social based conventions in order to focus on the aspect that can possible help decode the capital structure puzzle: The cognitive and behavioral biases that influence the decision-making process.
This empirical study intends to examine the relationship between the overconfidence bias and the capital structure decisions. The sample comprises UK non-financial firms from 2004 and 2014 and the variables that will proxy for the overconfidence were adapted from Alves et al. (2016).
The results provide evidence of a negative relation between overconfidence and debt levels. Similar results were obtained for different specifications on the dependent and independent variables.
Resumo
A Estrutura de Capitais, que consiste na determinação da combinação ótima de financiamento usada pelas empresas de modo a maximizarem o seu valor, representa um dos temas mais controversos na área das Finanças Empresariais.
Não obstante os inúmeros estudos acerca deste assunto, não existe ainda uma teoria consensual sobre qual a estrutura de capitais ótima a adotar pelas empresas.
Como consequência, uma linha de investigação começou a aplicar conceitos da área da psicologia e das ciências sociais de modo a aproximarem-se dos aspetos que podem ajudar a decifrar o puzzle da estrutura de capitais: Os desvios comportamentais e cognitivos que influenciam o processo da tomada de decisão. Este estudo empírico tenciona examinar a relação existente entre o desvio comportamental do excesso de confiança e as decisões relacionadas com a estrutura de capitais. A amostra estudada consiste em empresas não financeiras do Reino Unido de 2004 a 2014 e a variável que servirá como medida para o excesso de confiança foi adaptada do estudo de Alves et al. (2016).
Os resultados evidenciam a existência de uma relação negativa entre o excesso de confiança e os níveis de divida apresentados pelas empresas. Resultados idênticos foram obtidos quando foram testadas diferentes especificações para a variável dependente e as variáveis independentes.
Palavras-Chave: Estrutura de Capitais; Finanças Comportamentais; Desvio
Table of Contents
Acknowledgements ... v
Abstract ... vii
Resumo ... ix
List of Figures ... xiv
List of Tables ... xvi
Chapter 1 - Introduction ... 1
Chapter 2 - Literature Review ... 4
2.1 Traditional Approach ... 4
2.2 Modigliani and Miller ... 6
2.3 Other Approaches ... 9
2.3.1 Models based on Transaction Costs: Bankruptcy Costs ... 9
2.3.2 Models based on Transactions Costs: Agency Costs ... 10
2.3.2.1 Agency Costs of Equity ... 11
2.3.2.2 Agency Costs of Debt ... 12
2.3.3 Trade-off Models ... 13
2.3.3.1 Static trade-off Model ... 13
2.3.4 Models based on asymmetric information ... 15
2.3.4.1 Pecking Order Theory ... 15
2.3.4.2 Signaling Models ... 17
2.4 An indecipherable puzzle? ... 18
2.5 The Behavioral Finance Approach: The missing piece ... 18
2.5.1 Overconfidence Bias ... 20
2.5.2 How to measure Overconfidence ... 21
2.5.3 Prior Research on the effects of Managerial Overconfidence ... 22
2.6 Determinants of Capital Structure – Empirical Evidence ... 25
2.6.1 Size ... 25
2.6.2 Assets Tangibility ... 26
2.6.3 Profitability ... 26
2.6.4 Non-Debt Tax Shields ... 27
2.6.5 Growth Opportunities ... 28
2.6.6 Business Risk ... 29
Chapter 3 - Data and Methodology ... 31
3.2 Sample Description ... 33
3.3 Variables ... 34
3.3.1 Dependent Variable... 35
3.3.2 Independent Variables ... 35
3.4 Methodology ... 39
Chapter 4 – Results and Discussion ... 42
4.1 Multicollinearity Analysis ... 42
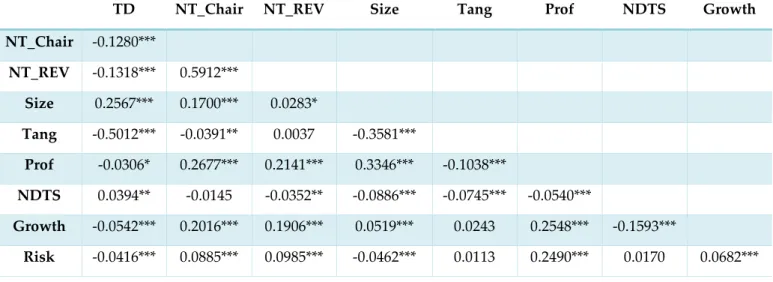
4.1.1 Matrix of correlation ... 42
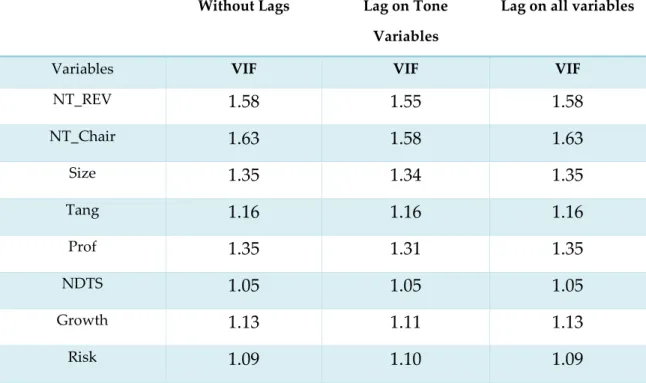
4.1.2 Variance Inflation Factors (VIF) ... 44
4.2 Empirical Results ... 45
4.2.1 Regression on quartiles ... 50
4.2.2 Regression with lagged explanatory variables ... 53
4.2.3 Further Analysis ... 57
List of Figures
Figure 1: "Pie Model" of Capital Structure ... 7 Figure 2: Representation of the Static Trade-Off Theory ... 14
List of Tables
Table 1: Expected relationship between leverage and the determinants of
capital structure. ... 30
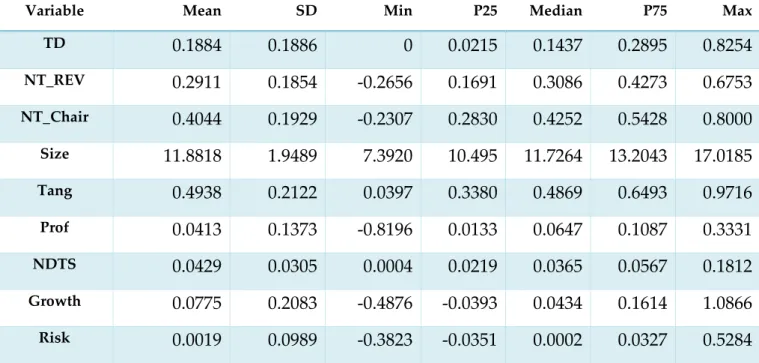
Table 2: Table of Descriptive Statistics ... 38
Table 3: Matrix of correlation ... 43
Table 4: VIF Test ... 45
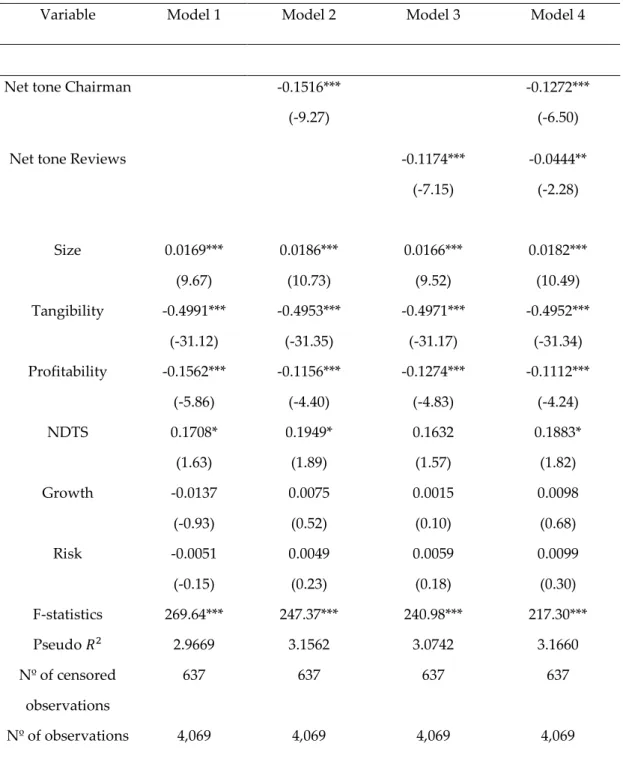
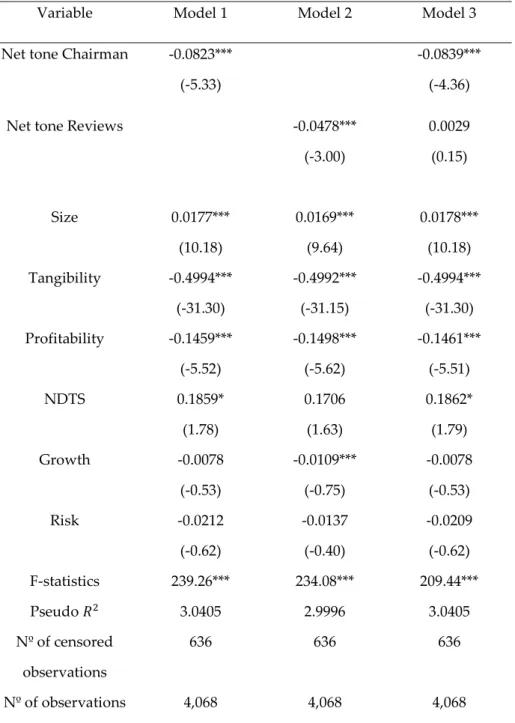
Table 5 TOBIT regressions. ... 46
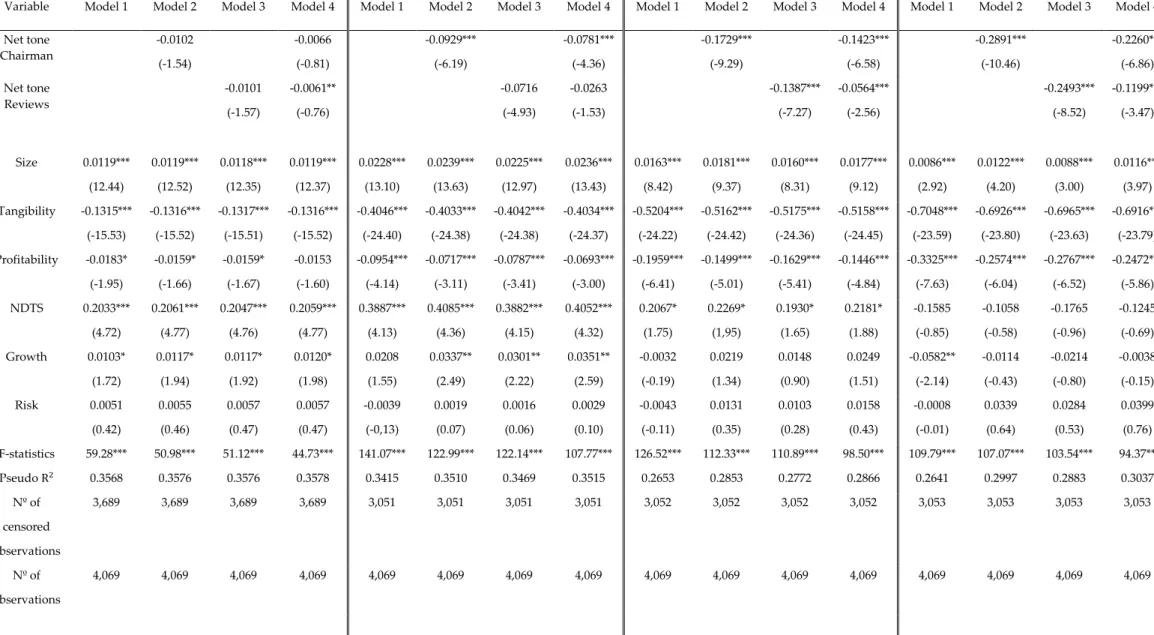
Table 6: TOBIT regressions – Quartile analysis ... 51
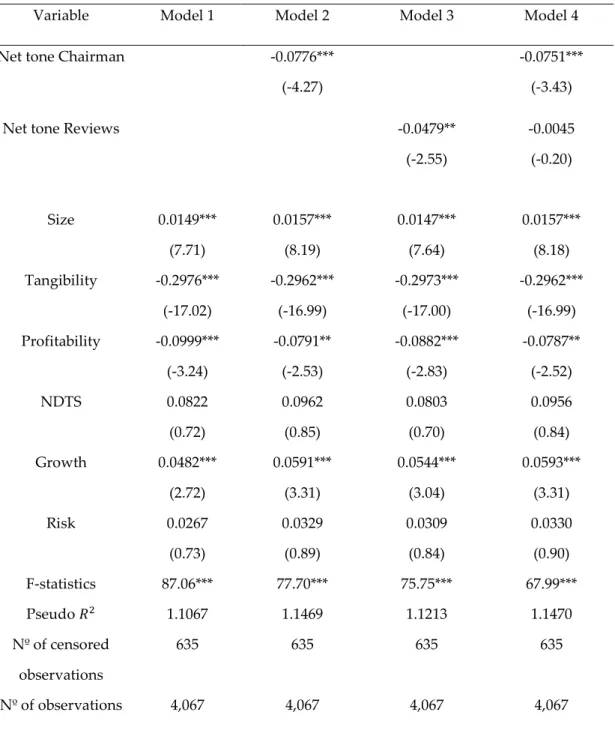
Table 7: TOBIT regressions – lagged tone explanatory variables. ... 54
Table 8: TOBIT regressions – lagged explanatory variables. ... 56
Chapter 1 – Introduction
Firms have at their disposal two channels to finance their investment opportunities: Equity and Debt. The decisions regarding the proportions of debt and equity a corporation should have on its capital structure represent one of the most challenging and critical topics on Finance Theory.
Although Modigliani and Miller (1958) concluded for the irrelevance of capital structure on the value of a firm, the market frictions that were not considered by the authors, led to a myriad of different theories attempting to study the impact of the capital structure on the firm value. Nevertheless, there is not yet an agreement on what the ideal capital structure is (Myers, 2001).
Given the discrepancy on empirical evidence following the traditional finance approach and the conclusions from the psychology literature about the behavioral biases that affect humans on their decision process, the rational assumptions made on the conventional approaches started to be replaced by more realistic behavioral assumptions that assume the irrational behavior of the market players (Shefrin, 2001). The overconfidence bias has been more integrated in models that intend to study manager’s irrational decision-making process when compared to the others behavioral biases given the fact that overconfidence is more prominent and idiosyncratic on more complex environments (Griffin and Tversky, 1992), which coincides precisely with the characteristics that define the managerial decision- making process.
The objective of this dissertation is to extend the capital structure literature and to contribute for the development of the behavioral capital structure concept by introducing the overconfidence bias as a possible factor that can help explain the capital structure decisions. Therefore, this dissertation examines the impact of an overconfident narrative on the capital structure decisions of a firm, which still constitutes an area where little empirical work is made, mainly due to the
difficulty of measuring this behavioral bias. On this study, the overconfidence bias was measured by using two variables from Alves et al. (2016). The authors not only developed a software which allowed them to extract and analyze PDF format annual reports but also employed that tool in order to examine the business reviews and the letter to shareholders’ sections of the annual reports which allowed them to study the tone of the narratives from both the CEO and the Chairman, respectively. Those variables were then applied for the purpose of this dissertation as they could serve as the proxy for an overconfident narrative from the firm’s Chairman and CEO.
This dissertation comprises panel data for non-financial firms listed on the London Stock Exchange’s Main Market and Alternative Investment Market (AIM) from 2004 to 2014 and the control explanatory variables necessary in order to conduct this study were retrieved using Thomson Reuters DataStream. The final sample consists of 4,069 observations resulting from 1,095 firms and eleven years (2004-2014).
For our analysis we use a Tobit regression model, censored from below so that the firms without total debt were excluded from the analysis. Our aim is to study the impact of an overconfident narrative of the Chairman and the CEO on the capital structure decisions of a firm, independently and jointly. Therefore, the regression model was constructed with the overconfidence bias as the main explanatory variables controlled by the most consensual determinants of capital structure. Prior literature appear to have found a consensus on the idea that biased managers tend to have higher levels of debt on their capital structure when compared to their rational peers, arguing that overconfident managers will undervalue the expected costs of financial distress, which ultimately will lead to higher levels of debt.
Our results seem to indicate that an overconfident narrative from both the CEO and the Chairman has a negative impact on the total debt ratio when
considered independently or jointly,implying that an overconfident Chairman or CEO tend to have less debt on their firms’ capital structure. These results can be explained by Malmendier et al. (2011) conclusions that an overconfident CEO favors internal financing to external financing.
This methodology was tested for firms with different levels of debt and considering a one-year lags on the independent variables and the results hold. The overconfidence bias varied on its significance according to the approach used and to the conditions imposed on the levels of total debt ratio, yet always presenting a negative relationship with the total debt ratio.
Moreover, the analysis was extended to consider the tone inconsistency between the narrative of the CEO and the Chairman. Specifically, we look if an unexpected managerial optimism impacts the level of debt a firm has on its capital structure. Results demonstrate a positive yet non-significant relationship between the unexpected managerial optimism and the total debt ratios of the firm.
The structure for the rest of the dissertation is as follows: Chapter 2 provides a literature review on the capital structure and behavioral finance topics. Chapter 3 provides details on the data and methodology. Chapter 4 presents and discusses the results. Finally, Chapter 5 concludes and points some further related areas to explore.
Chapter 2 – Literature Review
This section is divided into three different subsections: Firstly, we review the main theories about capital structure. Secondly, we introduced the behavioral finance concept and how it can be the missing piece in order to crack the capital structure puzzle but we discuss one dimension of managerial bias, namely the overconfidence. Lastly, taking into consideration prior studies on capital structure determinants, we describe the expected relationships between leverage and each determinant of capital structure decisions, including what prior literature on the effects of overconfidence on capital structure have concluded.
2.1 Traditional Approach
Capital structure, which represents one of the most debatable issues on the corporate finance field, intends to explain the “mix of securities and financing sources used by corporations to finance real investments” (Myers, 2001) in order to maximize firm value or minimize the weighted average cost of capital (WACC).
Durand (1952) is one of the first attempts to explain the capital structure decisions, specifying two different theoretical approaches to measure the relationship between capital structure decisions and the value of a firm.
The Net Income Method (NI Method) assumes that “the total investment
value1 does not remain constant, but increases with the proportion of bonds in
the capital structure” (Durand, 1952). Under this methodology, a higher use of bonds will reduce WACC and ultimately lead to a maximization of the value of
a firm. The firm value is, therefore, influenced by its capital structure. The argument is built on the assumptions that there are no taxes, the risk perception of investors is not influenced by the usage of debt and the cost of debt is lower than the cost of equity.
On the other hand, the Net Operating Income Method (NOI Method), states that “the total value of all bonds and stocks must always be the same regardless of the proportion of bonds and stocks” (Durand, 1952), meaning that the value of a firm does not depend on its capital structure. The increase on the level of risk perceived by the shareholders result in higher cost of equity which offsets the advantage of cheaper debt, and consequently the overall cost of capital does not change.
The traditional approach, also called as the intermediate approach, is a middle term between the NOI and NI approaches. While the NI Approach suggests the optimal capital structure would be obtained with 100% debt and the NOI Approach states that the capital structure decisions would be irrelevant to the value of a firm, the traditional approach establishes the existence of an optimal capital structure, that is achieved by increasing the debt levels in the capital structure, but only up to a certain level. On that optimal capital structure point, the WACC is minimized and the value of the firm is maximized.
Given the fact that the cost of debt is lower than the cost of equity, as debt levels increase, the WACC tends to decrease until is reached a certain level of debt. Increases in debt beyond that level, will lead to an increase on the cost of equity due to the increase of financial risk and a rise on the cost of debt. This will ultimately result on a decrease of the firm value.
2.2 Modigliani and Miller
Modigliani and Miller (1958, hereafter MM) represents a cornerstone on the capital structure literature, proposing that the choice concerning financing with debt or equity was irrelevant to the value of a firm (Proposition I) and to the WACC and that expected return on equity is a positively linearly function of the market value debt to equity ratio (Proposition II), and therefore the capital structure decisions were irrelevant. Although Durand (1952) had already presented this idea on his Net Operating Income Theory, MM were the pioneers in explaining the process that leads to the irrelevance of capital structure decisions.
It is however necessary to point out that MM’s study relies on very strong assumptions, including the followings: i) the inexistence of taxes, bankruptcy costs and transaction costs; ii) firms can only issue riskless debt or stocks; iii) homogeneous risk classes; iv) inexistence of information asymmetry between investors and managers about the firm’s future investment opportunities; v) investors can borrow at the same rate as companies; vi) the inexistence of agency costs. These set of assumptions were considered necessary and a way to simplify the capital structure issue in order to ease the approach on the topic (Modigliani and Miller, 1958; Myers, 2001).
On Proposition I, MM state that the value of a firm is constant regardless the level of leverage.
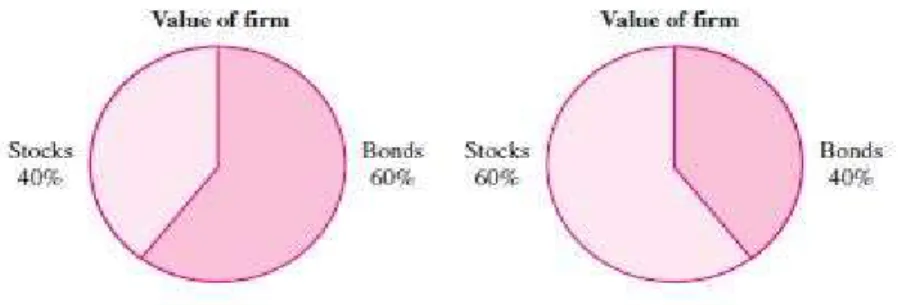
There is a clear “separation of investment and financing decisions” (Brealey et al, 2010). MM show that the value of a firm is only determined by its assets and the net present value of growth opportunities (NPVGO) and the proportions of debtholders and shareholders would not interfere on neither of these two. Brealey et al. (2010), described the Proposition I of MM as being the application of the Law of Conservation of Value: The value of the firm is determined by real
assets and not by the amounts of debt and equity on the right-hand side of the balance sheet as it can be easily perceived on Figure 1 (Ross, Westerfield and Jaffe, 2003).
Brealey and Myers (1992) refer that "If the total value of the stock "cake" (preferred and ordinary stocks together) is fixed, the owners of the company (usually shareholders) do not care of how the cake is cut”.
MM also presented an arbitrage argument, claiming that whenever the market value of an unlevered firm differs from the market value of a levered firm and assuming that the firms are identical, investors would have an arbitrage opportunity and would take advantage of that, which would terminate the stock price difference. For instance, supposing that the shares of the levered firm are highly priced, a rational investor would simply buy stocks from the unlevered firm.
From these two arguments MM were able to prove the irrelevance of capital structure on the firm value. One implication from Proposition I is that the WACC of a firm is constant no matter its capital structure.
After establishing Proposition I, MM were able to formulate Proposition II which postulates that the expected return on equity is a positively linearly function of the market value debt to equity ratio.
Figure 1: "Pie Model" of Capital Structure Figure 1: “Pie Model” of Capital Structure
Mathematically, it corresponds to following formula:
(1) 𝑟𝑒 = 𝑟𝑎+ (𝑟𝑎− 𝑟𝑑) ∗𝐷𝐸
Where:
𝑟𝑒- expected return on equity
𝑟𝑎- expected return of an unlevered firm 𝑟𝑑 – expected return on the debt
𝐷
𝐸 - Debt to equity ratio
This mathematical expression shows that in an unlevered firm, 𝑟𝑒 = 𝑟𝑎 ,
meaning that equity investors would require a return equal to 𝑟𝑎. When the firm
adds debt to its capital structure, the equity investors will demand an additional premium to compensate them for the risk of leverage. Thus, the rate of return of a levered firm is equal to the rate of return of an unlevered firm plus an additional return ((𝑟𝑎− 𝑟𝑑) ∗𝐷𝐸) required by stockholders to compensate them for the risk of
leverage. The change in the capital structure weights (E/V; D/V) is exactly offset by the change in the cost of equity and therefore the WACC remains the same.
On this paper, the authors despite having assumed the non-existence of taxes, still reflected about the effect that it might have on the capital structure of a company, but concluded that even in that scenario, the capital structure would continue to be irrelevant.
In 1963, MM corrected their aforementioned conclusion assuming that they made a mistake on the previous paper by undervaluing the tax advantages of financing with debt. Given the fact that debt is tax-deductible, when a firm adds debt to their capital structure it reduces taxes, everything else equal. That reduction in taxes will increase the Cash Flow of the firm, which will ultimately lead to an increase on the value of the firm by the present value of the annual
interest tax shield (Modigliani and Miller, 1963). Thus, the value of a levered firm is equal to the value of an unlevered firm plus the present value of the annual interest tax shields. In this scenario, the capital structure decisions of a firm influence its value, and with the assumptions made by MM, namely the inexistence of bankruptcy costs, the greatest value of a firm would be obtained when it is financed exclusively with debt (Brealey et al., 2007).
2.3 Other Approaches
Although MM’s study was criticized (Durand, 1959; Ross et al., 1993) due to the unrealistic assumptions made in their models, that do not take into account the market imperfections presented in the real world (Myers, 2001), their theory is considered the building block to a large number of studies about the several aspects of capital structure. Other authors developed new theories which were built on by dropping some of the MM’s assumptions: “By weakening the assumptions required by MM, a number of authors have been able to show that the total market value of a firm is affected by changes in its level of debt” (Scott, 1976).
2.3.1 Models based on Transaction Costs: Bankruptcy
Costs
MM assume that there were no bankruptcy costs while formulating their propositions. Scott (1976) narrates the danger of MM‘s no bankruptcy assumption since it does not take into consideration the negative effects that higher levels of debt could have on firms (Scott, 1976). Scott (1976), Warner (1977), Wruck (1990) and Baxter (1967), among others, draw attention to the costs
incurred when a firm struggles or fails to meet its obligations and tried to understand the impact of debt on the probability of default.
Scott (1976) assuming that the market for real assets was not perfect, presented a “multiperiod model of debt, equity and firm valuation” where he showed that there was an ideal capital structure and that there was a positive linear relationship between the firm’s level of debt and probability of bankruptcy. This conclusion was also drawn by Baxter (1967). Other authors (e.g. Warner, 1977; Haugen-Senbet, 1978) also attempted to measure the costs of bankruptcy and to seek for the existence of an optimal capital structure.
There are three different types of bankruptcy costs and Barclays et al. (1999) identified the indirect costs of bankruptcy to be the ones with a greater impact on a firm’s market value.
Kraus and Lintzenberg (1973) developed a model that assumed a trade-off between bankruptcy costs and tax savings. They postulate that the tax benefits of financing with debt is offset by the increase on bankruptcy costs (Jensen and Smith, 1984). According to the authors, the market value of a levered firm could be seen as:
(2) 𝑀𝑉 𝐿𝑒𝑣𝐹𝑖𝑟𝑚 = 𝑀𝑉 𝑈𝑛𝑙 𝐹𝑖𝑟𝑚 + 𝐶𝑜𝑟𝑝𝑇𝑎𝑥𝑅 ∗ 𝑀𝑉 𝐷𝑒𝑏𝑡 − 𝐶𝑜𝑚𝑝 𝐶𝑜𝑟𝑝𝑇𝑎𝑥𝑅 ∗ 𝑃𝑉 𝐵𝑎𝑛𝑘𝑟𝑢𝑝𝑡𝑐𝑦 𝐶𝑜𝑠𝑡𝑠
This model constitutes the first attempt to model the capital structure issue as a trade-off.
2.3.2 Models based on Transactions Costs: Agency Costs
Jensen and Meckling (1976) put forward an agency relationship is defined as a “contract under which one or more persons (the principal) engage another person (the agent) to perform some service on their behalf”. This relationship can result in a conflict if all individuals involved in the relationship pursue the maximization of their utility. In such scenario, it can be perceived that not all of
the agent’s decisions will be in the best interest of the principal. The solution to this divergence of interests between the parties involved is not possible without incurring in costs and in this sense, the authors defined costs as the aggregation of the monitoring expenses by the principal, the bonding expenses incurred by the agent and the residual loss which are incurred due to the fact that the decisions made do not maximize the wealth of the shareholders (Jensen and Meckling, 1976).
Jensen and Meckling (1976) also described two different types of agency problems: the agency costs of equity which are related with the conflicts between managers and shareholders and the agency costs of debt which occurs due to the separation between debtholders and shareholders.
2.3.2.1 Agency Costs of Equity
The agency cost of equity occur due to the conflict of interest between managers and shareholders. Both parties here described do not have their interests aligned. The shareholders have almost no control over the managers which may lead managers to place their personal interests above shareholders’ interests.
Jensen and Meckling (1976) argue that when a manager does not own 100% of a firm, he bears the totality of the costs but is only entitled to a fraction of the benefits, which will take himself to maximize his own utility and not being particularly concerned with the shareholders’ interests. This situation leads to an agency cost because of the monitoring costs incurred by shareholders to control the managers.
In addition to the aforementioned conflict between managers and shareholders, there is another problem that may emerge, which is related with the amount of available cash-flows after financing all the investments with positive net present value. Jensen (1986) stated that managers with a substantial
amount of cash flow at their disposal, in the absence of positive net present value projects, tend to invest that cash in negative net present value investments rather than distribute dividends to shareholders. A way to reduce this conflict of interests is through the increase of the debt levels of the company (Myers, 2001; Jensen and Meckling, 1976), given the disciplinary role of debt on the actions of a manager (Jensen, 1976). It will prevent him to unnecessarily waste cash flows, will increase his efficiency and his incentives to produce higher values for the owner (Myers, 2001).
2.3.2.2 Agency Costs of Debt
As it was previously explained, the increase on leverage can be viewed as a way to reduce the agency costs of equity. Despite that, by increasing debt for that reason or any other, the firm can potentially face another problem: agency costs of debt. That occurs due to the existence of default risk and the fact that debtholders lack capacity to control managers. If the firm goes bankrupt the creditors have a priority claim over the firm’s cash flows.
Brealey and Myers (2007) explain how managers can act on the shareholders’ behalf and transfer the value from debtholders to shareholders. According to the authors, that shift of value can be obtained by deciding to invest in high risk investments (that may even present a negative net present value) rather than in low risk investments. By doing this, the creditors will be negatively affected: If the investment succeeds, the shareholders receive most of the profits while the creditors do not have any upside from the investment. In the other hand, if the investment fails, and given the fact that shareholders have limited liability, the creditors will incur in a significant loss. (Jensen and Meckling, 1976; Myers, 2001).
Another way to transfer the value to shareholders consists on a dividend pay-out higher than expected or even through the pay-pay-out of extraordinary dividends in order to reduce the amount of assets for the creditors. The market price of the
firms’ stocks will reduce but in a lower magnitude than the amount of dividends paid (Brealey and Myers, 2007).
In addition to these two most recognized situations, Brealey and Myers (2007) presented three other situations that exemplify agency costs of debt. These situations can be minimized through the use of covenants, protective puts and convertible bonds.
According to Jensen and Meckling (1976), the optimal capital structure is achieved by balancing the benefits of debt with the agency costs of debt.
2.3.3 Trade-off Models
These models relate the advantages and disadvantages of financing with debt in order to find the perfect mix between financing with debt and equity. According to Myers (2001) it is about balancing the costs of bankruptcy with the tax benefits derived from using debt. The rationale behind these models is empirical but bundles the theories based on agency costs, bankruptcy costs and taxes.
They point out to the existence of an interior optimal capital structure which means that the choice between financing with debt or equity is preponderant to the maximization of the firm value.
2.3.3.1 Static trade-off Model
As it was previously explained, the first attempt to approach the capital structure as trade-off belongs to Kraus and Lintzenberg (1973). In their model, the authors assumed a trade-off between bankruptcy costs and tax savings, meaning that the optimal capital structure of a firm would be obtained by financing with a certain level of debt that would balance the bankruptcy costs with the tax benefits.
Myers (1984) suggests that firms set their debt-to-value ratio and their financial decisions are based on the idea that they need to gradually move in the direction that allows to meet that value. According to the author, the optimal debt ratio is a “trade-off between the costs and benefits of borrowing, holding the firm’s assets and investment plans constant”.
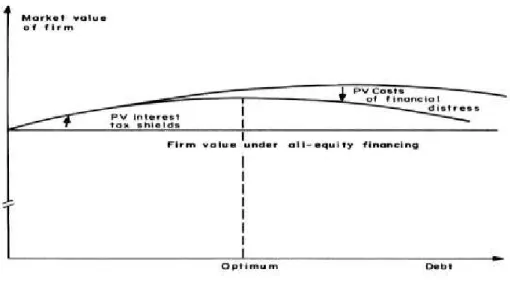
As Shyam et al. (1999) refer, the static trade off theory assumes that the trade-off that firms face is between the “marginal present values of interest tax shields” and “the costs of financial distress” (Figure 2).
One problem from the Static trade-off theory is the fact that the costs of adjustments are not considered. If in fact, these costs did not exist and this theory holds, then there would not be any explanation for firms not to be at the optimal debt-to-value ratio. But this is not the case in reality because there are adjustment costs that differ across firms and that is the reason why firms’ observable debt-to-value ratio differ from their optimal ratio (Myers, 1984).
A major drawback on this theory is that it assumes that the capital market is efficient and the existence of symmetrical information (Baker and Wurgler, 2002) Moreover, it has an extremely low 𝑅2(Myers, 1984), which indicates that the
proportion of variability of the data around its mean is little explained by the model.
2.3.4 Models based on asymmetric information
These models are based on the differences between economic agents regarding the access to information and on the idea that the manager knows better about the risk, value and investment opportunities of the firm than an outside investor (Harris and Raviv, 1991). The authors proposed two sets of approaches to this issue. Therefore, the two approaches will be reviewed in the subsequent subsections.
2.3.4.1 Pecking Order Theory
On this approach, Harris and Raviv (1991) consider that the “capital structure is designed to mitigate inefficiencies in the firm’s investment decisions that are caused by the information asymmetry”. (Myers, 1984; Myers and Majluf, 1984; Donaldson, 1961).
Assuming an information asymmetry scenario, the pecking order theory consists on a different approach on how firms make their financing. Myers (1984) defined as pecking order theory a conclusion that had already been drawn but not named by Donaldson (1961)2: in order to finance their investments, firms prefer
internal finance to external finance and in the case external finance is necessary, due to “unpredictable oscillations” in the firms’ investment opportunities and profitability, then firms would prefer to issue debt and only then they will issue equity as a last resource (Myers, 1984; Fama and French, 2002).
Myers (1984) confesses he used to look down on the pecking order theory because the argument that firms would want to avoid issue costs did not
2 Donaldson(1961) observed in his study that: Management strongly favored internal generation as a source of
convince him due to the fact that “issue costs in themselves do not seem large enough to override the costs and benefits of leverage emphasized on the static trade off story” (Myers, 1984). Despite that Myers and Majluf (1984) presented a theoretical framework that explains how financing decisions can influence investment decisions and might help complete the theory. The rationale behind the model is simple: Assuming that the managers are on the behalf of old shareholders and in the presence of asymmetric information between the manager and the investor regarding the NPV of an investment opportunity and what will be the value of the firm if the opportunity is not taken, the underpricing on the firm shares can lead to situations where positive NPV investments are not taken because managers would be transferring value from old to new shareholders(Harris and Raviv, 1991). A key point of this study is that by financing their investments opportunities through the use of debt, the incentive to drop a positive NPV investment would be less when compared to the financing through the issuance of equity (Myers and Majluf, 1984).
Myers and Majluf (1984) argue that the last preferred source of financing is issuing equity because investors, knowing that managers are better informed than them on the prospects of the firm will only issue equity if the inside information they have is unfavorable and so the investors will place a low value on the new equity issuance. Therefore, Myers states “Issue safe securities before risky ones” (Myers, 1984).
This has led to the pecking order theory that as mentioned before assumes that firms show a preference for a hierarchy on the use of their sources of financing in the presence of asymmetric information. At the top of the hierarchy there is internal financing. If external finance is necessary, then the firm will prioritize the issuance of debt over equity (Frank and Goyal, 2009). Therefore, the pecking order theory explains why more profitable firms tend to have less debt (Myers, 2001).
This model postulates that there is not an optimal capital structure but instead it will depend on profitability, dividend policy and the growth opportunities (Myers and Majluf, 1984).
2.3.4.2 Signaling Models
Starting from an asymmetric information scenario, these models stem from the objective of the managers to transfer their inside information into investors to make the stock prices of the firm rise. As this transference cannot be done simply by announcing it due to the fact that investors would not fully trust on them, one approach to solve this situation is to give investors signals. Therefore, these models assume that capital structure works as “a signal of private information”, while the models discussed on the previous subsection postulate that capital structure was used as a solution to the underinvestment problem (Harris and Raviv, 1991).
The most remarkable research on this issue is from Ross (1977), despite other authors had also debated the topic (Leland-Pyle, 1977; Easterbrook, 1984). Briefly, Ross (1977) concludes that the issuance of debt is a signal of good news to investors since for any level of debt, the worst firms face higher bankruptcy costs and so firms with high levels of debt represent to investors an indicator of the better quality of the firm. The author also concludes that the manager will face a trade-off between the higher value of stocks obtained by the benefits of signaling and the bankruptcy costs.
2.4 An indecipherable puzzle?
Despite the growing body of literature on the capital structure topic, it still remains an indecipherable puzzle (Myers, 2001), since there is not yet a consensual theory on the choice debt-equity. Theories based on a traditional finance approach hold in common one main concept: the rational behavior of the market participants. Those theories tend to ignore the importance that managers have on the capital structure decisions and how their emotions can affect that decision. Managers are not all rational as assumed by the traditional finance approach (Shefrin, 2001).
Studies in psychology science department documented that individuals face cognitive and behavioral biases that influence the decision-making process and in certain cases lead to systematic errors.
Given the inconsistency on empirical evidence following the traditional finance approaches, and this new evidences from the psychology field on the behavior biases that affect humans making their decisions, researchers started to replace the rational assumptions by more realistic behavioral assumptions that can better explain the decision-making process.
2.5 The Behavioral Finance Approach: The missing piece
Behavioral Finance, has been growing in importance in the last decades due to the fact that it has been observed that market players hardly behave as stated in the traditional finance theory. It consists on psychology and social-based conventions applied to finance theory and offers a more realistic view about the decision-making process by replacing the rationality assumptions, used on traditional theory, for more realistic behavioral assumptions. Thaler,
acknowledged as one of the founding fathers of behavioral finance, defines it as “simply open-minded finance” (Thaler, 1993).
Several papers written on the behavioral finance area have demonstrated the irrationality of individuals. Mackay (1841) presents a study on crowd psychology and shows how easily individuals can be irrational and deceived when the crowd opinion influences them. On his book, he reported several manias that happened throughout history, with a particular attention given to the Tulipomania, where it was observed a completely irrational speculation about tulips. Nowadays, it represents a valuable lesson for investors on the irrationality of the markets. Kahneman and Tversky (1979) formulates what is one of the most famous components of behavioral economics – Prospect Theory. It constitutes an evidence of the irrational behavior of individuals. In simple terms, Kahneman and Tversky (1979), found that individuals do not weight gains and losses linearly. Prospect theory claims that people make decisions not based on the utility of the decision but rather on the potential value of gains and losses (Heukelom, 2014).
Researches in psychology and behavioral decision-making found out a set of behavioral biases that influence humans to decide in a way that do not coincide with traditional finance theories (Lobão, 2006; Shefrin, 2001; Choi and Pritchard, 2003): i) loss aversion ; ii) overconfidence ; iii) confirmation bias ; iv) endowment effect and v) hindsight bias. Hirshleifer (2001) grouped the different behavioral biases according to their cause: heuristic simplification, self- deception and emotional loss of control. He went on arguing that these aspects can explain the vast majority of the most known judgement biases.
For the purpose of this dissertation, it will be given prominence to the overconfidence bias since it constitutes one of the most studied bias on the literature that deals with managers’ irrationality given the fact that overconfidence is more prominent and idiosyncratic on more complex
environments and managerial decisions are precisely a complex process (Griffin and Tversky, 1992).
2.5.1 Overconfidence Bias
“Overconfidence is a very serious problem. If you don’t think it affects you, that’s probably because you’re overconfident.” – Carl Richards
The study of this phenomenon has its roots in the psychology literature but has recently been incorporated in the Finance and Economic world. Some authors attribute the existence of this bias to a Darwin’s natural selection process. In this sense, these authors believe that if this human characteristic was able to be passed through generations that must be because it is important on individuals’ survival. Hundreds of research papers have been written about the overconfidence bias and it appears to be a consensus that humans tend to show overconfidence about their own skills: Decision-makers demonstrate a tendency to “overestimate the precision of their knowledge” (Lichtenstein et al., 1982). Thaler and De Bondt (1994) stated: “Perhaps the most robust finding in the psychology of judgement is that people are overconfident”. Psychologists point out to the fact that overconfidence leads individuals to make an overestimation of their own intellectual abilities(Svenson, 1981) as well as their capacities to keep events under their control and simultaneously to underestimate risks (Nofsinger, 2005).
One of the features of overconfidence is known as better than average effect (Bruce, 2010). It consists on the idea that individuals have that they can performance above average in a myriad of tasks even though they are not able to compare themselves with the descriptive average (Taylor and Brown, 1988).
A fascinating finding on the overconfidence behavior affecting managers is that the overconfidence effect is more prominent when managers are dealing
with more challenging tasks (Fischhoff et al., 1977; Lobão, 2006). The environment in which the job is performed as well as the thought that they have the power on the outcome of their actions are also empirically related with higher levels of overconfidence (Lobão, 2006).
Prior literature about this behavioral bias concluded that overconfidence leads managers to choose higher levels of debt (Hackbarth, 2004; Fairchild, 2005), perform more acquisitions and pay less dividends. A more deeply review on the results from prior studies about the effects that managerial and chairman overconfidence can have on the definition of capital structures will be given at a further sub-section.
2.5.2 How to measure Overconfidence
One of the reasons to explain why this concept of managerial overconfidence is still an unexplored area, with a reduced number of studies made, has to do with the difficulty on measuring overconfidence. Quantifying a behavioral characteristic as overconfidence ex-ante can be problematic.
Malmendier and Tate (2005) in order to measure overconfidence focused on CEOs exposure to idiosyncratic risk. The authors used a logic based on call options to classify a CEO as overconfident. Thus, given the fact that usually a portion of the CEO remuneration is paid through firm stock options, a risk-averse CEO will exercise his call options prior to the expiration date assuming that they are in the money for a minimum percentage defined by the authors as the benchmark. On the other hand, an overconfident CEO will exercise his options later than the benchmark level given the fact that his excessive belief on himself leads him to think he can make the stock prices keep an upward tendency. In 2008, Malmendier and Tate referred another indicator for the study of overconfidence. The authors suggested overconfidence to be measured
according to how the press perceives the CEOs, with overconfident CEOs to be seen as risk-takers and non- conservative.
Lin et al. (2005) used the frequency of corrected managers’ predictions about the firms’ earnings to serve as a measure for overconfidence. This idea is based on prior literature that suggest that managers who overtime were able to correctly predict the firms’ earnings tend to be more affected by the overconfidence bias.
A measure that has been used on the literature about this subject are surveys. Oliver (2005) used the “average of the past 12 months Consumer Sentiment Index (CSI) from the University of Michigan from 1978 to 2004” as a proxy for management confidence. The rationale behind the use of surveys is to analyze the CEOs answers for certain types of questions, mainly forecasts on future performance of their firms. An overconfidence CEO will have the tendency to overestimate their forecasts. The literature also takes in consideration the tendency for managers to be involved in mergers and acquisitions as a proxy for CEOs overconfidence. A more confident manager will perform more mergers and acquisitions.
Kim (2017) used the management tone as a proxy for overconfidence. Nevertheless, the method used on his paper to compute the management tone differs from the one that will be used on this dissertation. The author calculated the variable tone by “dividing conference call transcripts into management parts and analyst parts, and separately analyzing tones using Loughran-McDonald (2011) Dictionary for corporate documents”.
2.5.3 Prior Research on the effects of Managerial
Overconfidence
Although the vast majority of studies conducted on capital structures decisions rely on firm fundamental features, it is necessary to take into account
the decisive role that managers have on investment decisions. Managers, as any other individuals, are exposed and display behavioral biases that influence their decision making process.
Roll (1986) concluded that overconfident managers tend to overvalue the benefits of the takeover which leads them to overpay for their targets and ex-post value destroying.
Berger et al. (1997) analyzed the impact that managerial entrenchment have on the capital structure decisions of a firm. The author postulated that amount of leverage a firm has is in fact influenced by the degree of managerial entrenchment. Moreover, their results indicate a negative relationship between entrenched managers and debt. The model conducted on the study presented evidence that the level of leverage is lower “when the CEO has a long tenure in office, has weak stock and compensation incentives” and is not intensely supervised by the key shareholders or the board of directors.
Shefrin (2001) alerted for the existence of two behavioral factors that were disturbing the practice of value maximization. The author described those keys to be “external obstructions” derived from investors’ irrationality and the “behavioral costs” which are related to managers and employees’ “psychologically induced errors”. The author concluded that overconfident managers tend to have more leverage on their firms and adopt a non-optimal capital structure.
Malmendier and Tate (2002; 2005) found out that overconfident CEOs “have a heightened sensitivity of corporate investment to cash flow” (Malmendier and Tate, 2005) and that have the tendency to perform more value –destroying mergers and acquisitions. Stein (1988) suggests that takeover processes can bring a manager into reactions that can potentially cause unwanted effects even “in the absence of managerial moral hazard”.
Hirshleifer (1993) established a relation between managerial reputation and how it affects their investment decisions, arguing that managers are concerned with protecting their reputation given the “direct value of prestige” and the “better bargaining power to increase his pay” and consequently their investment decisions may be biased in order to fulfill that personal intent. The author gathered together the three different forms of incentives a manager has in order to use their investments decisions as a tool to create their personal reputation and enumerate the variety of investment biases that those incentives lead to. The paper ends up with the idea the managerial concern for their reputation does not only carry negative consequences. In fact, the author states that it may help a manager work hard and act on the behalf of its creditors. Nevertheless, the main conclusion to be drawn from this study is that managers suffer from investment biases related with their concern for their reputation which contrasts with the rational behavior described in the traditional finance approach.
Hackbarth (2008) presented a relationship between overconfidence and capital structures decisions. He stated that firms with overconfident managers tend to have higher levels of debt on their capital structure. This conclusion is also obtained by Shefrin (1999). In the same line of investigation, Fairchild (2005) incorporating agency costs between managers and shareholders and asymmetric information on his model, concluded that overconfident managers will use excessively levels of debt given their unwillingness to issue equity.
Taking into consideration all the available studies and models on the relation between capital structure and overconfidence bias, it is safe to state that there is a consensual prediction that biased managers will tend to have higher levels of debt on their capital structure when compared to their rational peers. The rationale behind this conclusion is that overconfident managers will undervalue the expected costs of financial distress and therefore will try to take advantage of
the benefits from financing with debt, which ultimately will lead to higher levels of debt.
2.6 Determinants of Capital Structure – Empirical
Evidence
2.6.1 Size
Rajan and Zingales (1995) and Frank and Goyal (2003) state that the impact of size on leverage is uncertain. According to Rajan and Zingales (1995), and taking into consideration the pecking order theory, the size of a firm can be negatively correlated with the amount of leverage used in the sense that in larger firms the information asymmetry between investors and insiders will be reduced and firms will demonstrate a preference for equity issuance. On the other hand, and having the trade-off theory in mind, size can be positively correlated with leverage given the fact that the probability of a larger firm, that are more diversified and present more stable cash flows, facing a bankruptcy scenario is lower when compared to a smaller firm. These same conclusions were obtained by Frank and Goyal (2003).
Titman and Wessels (1988) found evidence that supports a positive correlation between size and leverage. Larger firms are able to finance themselves through debt at a lower cost given the lower probability of facing bankruptcy costs. Thus, attending to the trade-off theory, the authors concluded that, large firms should present higher levels of leverage.
2.6.2 Assets Tangibility
Frank and Goyal (2009)assumes that according to the pecking order theory,
assets tangibility and leverage are negatively correlated. That happens due to the lower asymmetry of information that firms with more tangible assets face, which allows them to face a cheapest cost on equity issuance and consequently the leverage ratios reduce. On that same paper, the author defends that, as tangible assets are easier to evaluate by individuals outside the firm, the costs of financial distress will be lower which will lead to a positive relationship between tangibility and the amount of leverage, assuming a trade-off theory point of view. That same conclusion had been drawn by the authors Frank and Goyal (2003).
Other authors as Rajan and Zingales (1995), Harris and Raviv (1991) and Titman and Wessels (1988) described a positive correlation between tangibility and leverage, taking in consideration a trade-off theory scenario. Rajan and Zingales (1995) explained that if a firm has considerable proportions of tangible assets on their balance sheets, they may serve as collateral which allows the firm to diminish the agency costs of debt. In this case, loans will be more easily obtained given the fact that lenders will have more confidence on the firm and consequently the leverage increases.
2.6.3 Profitability
According to Fama and French (2002), less profitable firm tend to have more bankruptcy costs which will lead them to have lower leverage. De Angelo and Masuli (1980) developed a model that led them to the conclusion that firms with high profitability will face a higher tax rate, meaning that the interest tax shields value will be higher and consequently firms will have more leverage. Jensen (1986) also agrees with a positive relation between leverage and profitability if the “market for corporate control is effective”. Thus, according to the trade-off theory, profitability and leverage are positively correlated.
On the other hand, and having in mind an information asymmetry framework, Myers and Majluf (1984) concluded that firms prioritize their sources of financing. As a first source firms use internal resources, followed if necessary by debt and equity as a last option. This hierarchy on the financing sources made the authors conclude that the firm’s profitability is inversely related with the amount of leverage. Rajan and Zingales (1995), Frank and Goyal (2003) and Titman and Wessels (1988) also concluded for the existence of a negative relation between the two variables.
2.6.4 Non-Debt Tax Shields
The trade-off theory assumes a negative relationship between non-debt tax shields and leverage. DeAngelo and Masulis (1980) developed a model in which they were able to prove that firms with a greater amount of non-debt tax shields when compared to their cash flows tend to present a lower level of leverage given the fact that the tax benefits resulting from depreciation and the tax benefits from debt work as substitutes. Every firm try to take advantage of the tax benefits from financing with debt but as leverage increases, the opportunities to exploit other tax benefits besides the one provided by debt decrease. Fama and French (2002) also found evidence for the existence of a negative relation between these two variables.
Bradley et al. (1984) tested the relationship between leverage and non-debt tax shields and the results have shown that these two variables are positively correlated. The existence of this positive relationship was justified with the fact that the higher levels of depreciation generated as a consequence of the firms’ great proportion of investments in tangible assets, tend to lead to a higher level of leverage on their capital structure. The occurrence of this result was explained by Graham (2005). The author justified that this happen due to the fact that firms
with high levels of profitability will invest more in assets and in order to finance these assets will have to loan more.
2.6.5 Growth Opportunities
According to the pecking order theory, there is a positive relationship between growth opportunities and leverage, meaning that firms with more growth opportunities are expected to have more leverage on its capital structure. Shyam, Sunder and Myers (1999) described that growth opportunities lead firms to invest more which will reduce the amount of cash flows and consequently will make firms have to use external financing. In fact, this is the pecking order theory in its essence. Firms prefer to use retained earnings in order to finance their investment opportunities. If the amount of growth opportunities is high, then probably the internal financing won’t be enough what we lead firm to use external financing with a particular preference for debt.
On the other hand, the expected relationship between these two variables is negative if the problematic is analyzed in a trade-off perspective. Myers (1977) states that growth companies should have lower levels of leverage due to the fact that a high level of leverage may endanger the possibilities of taking investment opportunities that could create value for the firm which can possibly cause a slowdown on the pace of growth. Titman and Wessels (1988) made reference to the agency costs of debt and the bankruptcy costs in order to explain the negative relation between growth opportunities and leverage. Firms that present high growth rates will face more bankruptcy costs as well as higher agency costs. The higher bankruptcy costs are explained by the lack of assets to sell in a financial distress situation and the higher agency costs result from the freedom to choose their future investments. Jensen (1976) studied this relationship taking into consideration the agency costs of equity and concludes that managers’ power will be increased if the firm grows beyond its optimal size because the manager
will have more resource under his control. Thus, Jensen (1976) predicts a positive relationship between the amount of leverage on a firm capital structure and growth opportunities.
2.6.6 Business Risk
The trade-off theory assumes a negative relation between business risk and leverage due to the effects of bankruptcy and debt agency costs. Several authors have studied this relationship. Titman and Wessels (1988) stated that the business risk of a firm has volatility as its proxy and found out that “a firm’s optimal debt level is a decreasing function of the volatility of earnings”, meaning that the debt level is also negatively correlated with business risk. Bradley et al. (1984) and Long and Malitz (1985) share the same idea as Titman and Wessels. Bradley et al. (1984) proposed that the debt ratio presents a negative relation with the costs of financial distress and with the variability on the firm value. Thus, the costs of financial distress increase when the change on the firm value increases, which led them to the conclusion that in that case firms will have lower levels of leverage.
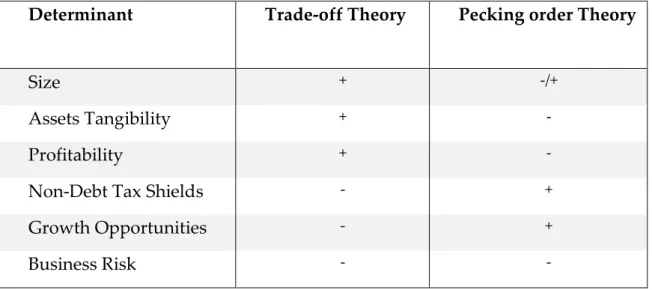
Table 1 presents a simplified overview on the expected relationship (positive or negative) between leverage and each determinant, according to what is postulated by the trade-off and pecking order theories.
Table 1: Expected relationship between leverage and the determinants of capital structure. Determinant Trade-off Theory Pecking order Theory
Size + -/+
Assets Tangibility + -
Profitability + -
Non-Debt Tax Shields - +
Growth Opportunities - +
Business Risk - -
These six determinants are considered the most relevant in explaining the proportions of debt a firm has on its capital structure according to the traditional finance theory. However, bearing in mind that the purpose of this thesis is related with a behavioral finance concept as it intends to study the impact of a behavioral bias on the determination of the capital structure, it is necessary to add some other variables that will measure the overconfidence on the speech of both the firm’s CEO/CFO and Chairman. Those other variables are, as it was previously mentioned, the Net Tone Rev and the Net Tone Chairman, which will measure the overconfidence bias by analyzing the firms’ annual reports sections signed by the CEO/CFO and Chairman, respectively.
Chapter 3 – Data and Methodology
The objective of this dissertation is to study the impact of the overconfidence bias on the capital structure decisions of a firm. This area of investigation introduces a behavioral bias concept in order to try to explain several factors that traditional finance approach fails to explain.
On this chapter it will not only be described the empirical hypothesis under study but also the data, variables and methodology used to conduct the investigation of the research questions.
3.1 Empirical Hypothesis
A vast number of studies have been written on the determinants of capital structure in the past years with the common denominator of being conducted following a traditional finance approach which heavily relies on firm fundamentals. That approach assumes the rational behavior of the market participants ignoring the critical role that managers and their emotions play on the capital structure puzzle.
In recent years and taking in consideration the inconsistency of empirical results following the conventional approaches, researchers started to apply concepts from psychology literature into the finance theory in order to replace the rational assumptions by more realistic behavioral assumptions that can explain the decision-making process.
A growing body of literature reports the existence of symptoms of overconfidence on a vast number of CEO’s decisions and suggests that CEO’s overconfidence has an impact on a myriad of firms’ decisions, including the definition of its capital structure. The inclusion of this behavioral bias effect on
the definition of a firm’s capital structure can be the missing piece in order to solve the problem that still prevails on the financial world that is of determining the optimal capital structure.
The purpose of this dissertation, which intends to verify the results from previous literature by analyzing the impact of the overconfidence bias on capital structure decisions in a set of different firms and using a variable to measure a overconfident speech adapted from Alves et al. study (2016), is twofold: First, to examine if the overconfidence bias presented on both firms’ CEO/ CFO and Chairman annual report signed sections affects the capital structure decisions, which still constitutes an area where little empiric research exists. Second, both of them will be put together in a regression to study which one of them prevails when considered jointly.
Prior literature suggests that overconfident CEOs tend to have more debt on their capital structure as mentioned on Chapter 2. In this study the focus will be on the effects of an overconfident narrative from both firms’ CEO/CFO and Chairman on the definition of the firm’ capital structure.
Thus, the following hypothesis will be under study:
Hypothesis 1: Ceteris paribus, there is a positive relationship between CEO/CFOs overconfident narrative and their firms’ leverage ratios.
Hypothesis 2: Ceteris paribus, there is a positive relationship between Chairmans’ overconfident narrative and their firms’ leverage ratios.
Hypothesis 3: Ceteris paribus, there is a positive relationship between Chairmans’ and CEO/CFOs overconfident narrative and their firms’ leverage ratios when considered jointly.
3.2 Sample Description
In order to explain the possible impact of the overconfidence bias on capital structure decisions, it was necessary to define a way to measure overconfidence. In this study, it will be used as proxies for both the CEO/CFO overconfident speech and the Chairman overconfident speech, the “net tone of Reviews” and the “net tone of Chair”, respectively (Alves et al., 2016). On their paper, in order to evaluate the management and individual board chair’s incremental predictive power for future earnings, the authors developed and evaluated a “web-based software tool” that allowed them to analyze the business reviews which are signed by the CEO/CFO and the letters to shareholders signed by the chairman presented on digital PDFs annual reports. For the computation of the two variables mentioned above, the authors defined a set of positive and negative words3 and the software ran the business reviews and the letter to shareholders
sections to search for the existence of those words. The variables were then computed using the following formulas:
(3) 𝑁𝑒𝑡 𝑡𝑜𝑛𝑒 𝑅𝑒𝑣 =(𝑝𝑜𝑠+𝑛𝑒𝑔)𝑘𝑒𝑦𝑤𝑜𝑟𝑑𝑠 𝑓𝑜𝑟 𝑏𝑢𝑠𝑖𝑛𝑒𝑠𝑠,𝑓𝑖𝑛𝑎𝑛𝑐𝑎𝑙 𝑎𝑛𝑑 𝑜𝑝𝑒𝑟𝑎𝑡𝑖𝑛𝑔 𝑟𝑒𝑣𝑖𝑒𝑤𝑠 𝑃𝑜𝑠𝑖𝑡𝑖𝑣𝑒 𝑘𝑒𝑦𝑤𝑜𝑟𝑑𝑠− 𝑁𝑒𝑔𝑎𝑡𝑖𝑣𝑒 𝑘𝑒𝑦𝑤𝑜𝑟𝑑𝑠 (4) 𝑁𝑒𝑡 𝑡𝑜𝑛𝑒 𝐶ℎ𝑎𝑖𝑟 =(𝑝𝑜𝑠+𝑛𝑒𝑔)𝑘𝑒𝑦𝑤𝑜𝑟𝑑𝑠 𝑓𝑜𝑟 𝑐ℎ𝑎𝑖𝑚𝑎𝑛 𝑃𝑜𝑠𝑖𝑡𝑖𝑣𝑒 𝑘𝑒𝑦𝑤𝑜𝑟𝑑𝑠−𝑁𝑒𝑔𝑎𝑡𝑖𝑣𝑒 𝑘𝑒𝑦𝑤𝑜𝑟𝑑𝑠′𝑠 𝑠𝑡𝑎𝑡𝑒𝑚𝑒𝑛𝑡
Although the purpose of their work was not to measure the effect of an overconfidence speech on the capital structure decisions but instead to “focus on the ability of narratives to predict future earnings”, the aforementioned variables developed on their paper can be applied to this study. Thus, these variables will
be the proxy to measure the overconfidence bias on both CEO/CFO and Chairman speech, since according to prior research, the linguistic style of an author is dependent on its personal features (Argamon et al., 2009) and can be an indicator of its behavioral biases. Their study was focused on UK non-financial firms between 2003 and 2014 and the final list of firms as well as the aforementioned variables were collected from the companion website of the paper (Alves et al. 2016).
The control variables necessary to run the regression for this study were obtained for the same set of firms used on Alves et al. (2016) in order to match with the main explanatory variables. Control variables were collected from Thomson Reuters DataStream. It were retrieved data for Earnings before Interest and Taxes - EBIT, Total Assets, Depreciation and Amortizations, Total Debt, Net Sales and Tangible Assets.
The initial data contained 21,054 observations resulting from 1,759 firms and twelve years (2003-2014). However, after all observations with missing and inconsistent values were excluded as well as after the creation of the ratios that will proxy for the determinants of capital structure, the data was shortened to 4,823 observations for the same time horizon, with a total of 1,208 firms. Posteriorly, after trimming the distribution by deleting the top and bottom 1% in order to remove outliers, the final data was reduced to 4,069 observations with a total of 1,095 firms and eleven years (2004-2014).
3.3 Variables
In order to perform a regression model necessary for answering the proposed research questions, the determinants described at the end of Chapter 2 as well as the dependent variables need to be measured. That is accomplished by
using proxies to serve as a measure for each variable. Prior research has already defined a set of proxies that should be used for each variable. In this thesis, it will be used a proxy for each variable according to previous literature.
3.3.1 Dependent Variable
As the purpose of this study is to analyze if a certain behavioral bias influence the capital structure decisions, the dependent variable has to be a measure of how a firm finance their real investments. Thus, in the present dissertation, it will be measured by Total Debt (TD) (Hall et al., 2004; Titman and Wessels, 1988) as follows:
(5) TD = Total Debt+Market CapitalizationTotal Debt ;
There is some debate over whether it should be used market value of assets or book value. The book value is a backward looking measure and works as a “plug number” rather than a “managerially relevant number”. Contrarily, the market measure is forward looking (Frank and Goyal, 2009) and we opt for this approach.
3.3.2 Independent Variables
The set of independent variables used to conduct this study correspond to the most relevant determinants of capital structure referred on previous literature. The proxies for each determinant of capital structure were chosen according to previously conducted works, namely Titman and Wessels (1988), Serrasqueiro and Caetano (2013), Marsh (1982), Alves et al. (2016) and Shyam, Sunders and Myers (1999).
1) Size: The size of a company is frequently used as a relevant
determinant on the determination of capital structure. Prior research have used different measures for this determinant: sales (Smith and Watts, 1992) and the logarithm of sales (Serrasqueiro and Caetano, 2013). In this dissertation, the size of a company is obtained by the logarithm of assets (Hovakimian et al., 2001; Frank and Goyal, 2009) as follows:
(6) 𝑆𝐼𝑍𝐸 = 𝐿𝑛(𝐴𝑠𝑠𝑒𝑡𝑠)
2) Tangibility: Frank and Goyal (2009) stated that tangible assets lead to
the reduction of distress costs and the debt agency costs considering the ease on valuation when compared to intangible assets. It will be computed as the ratio between tangible fixed assets and total assets (Titman and Wessels, 1988).
(7) 𝑇𝐴𝑁𝐺 =𝑇𝑎𝑛𝑔𝑖𝑏𝑙𝑒 𝐹𝑖𝑥𝑒𝑑 𝐴𝑠𝑠𝑒𝑡𝑠𝑇𝑜𝑡𝑎𝑙 𝐴𝑠𝑠𝑒𝑡𝑠
3) Profitability: In this dissertation it will be measured as the ratio of
EBIT over total assets (Marsh, 1982). Nonetheless, prior literature also used the ratio of Earnings Before Interest, Taxes, Depreciations and amortizations (EBITDA) over total assets (Frank and Goyal, 2009) as a measure for profitability.