Temperature Abuses on Frozen Broccoli : Influence on Quality
Betty Despra, Andrea Molinari and Cristina L.M. Silva
Escola Superior de Biotecnologia, Universidade Cat(Mica Poduguesa, Rua Dr. Antonio Bernardino de Almeida, 4200 Porto, Portugal
SUMMARY
Frozen storage is generally the most quality detrimental step of the freezing process for food products marked through retail channels. This is due to the temperature abuses products suffer during distribution and storage.
The objective of this study was to simulate these temperature abuses on frozen broccoli and to evaluate their impact on its quality. The quality parameters analysed along storage, before and after temperature abuses, were titratable acidity, pH, moisture, total and reduced sugars, colour (L, a, b), and peroxidase. Products were also cooked and evaluated by a trained sensory panel. No significant difference in acidity, pH, moisture and sugars was found during storage between abused and control samples. No regeneration of peroxidase activity (inactivated by blanching)
occurred. However, a significant colour difference, smaller and smaller along storage, has been observed between both samples. Storage time and temperature abuses had no significant effect on sensory characteristics and no significant difference and preference between sample were found. However, a significant preference for the control Sample was observed in the final test among people who found a difference. It can be conclude, anyway, that frozen broccoli can suffer some temperature abuses without getting much more quality loss perceived by the consumer.
INTRODUCTION
Maintenance of low freezing temperatures throughout the frozen-food distribution chain is imperative to get high-quality products. From a legislative point of view, temperatures of -18°C or lower are required in most countries. Higher product temperatures can be allowed but only for very short periods such as defrosting of a display cabinet (Reid, 1993). This need is quite well accepted but in practice it goes on being difficult to apply. Indeed, temperature abuses can take place since the factory warehouse, for example if products are handled too long or at too high temperature outside the cold chamber. Frozen products can also suffer temperature abuses in the subsequent steps of the distribution, such as transportation, intermediate storage, retail display and storage in the domestic freezer (Bramsnaes, 1981).
The importance of storage temperature on the quality of frozen products was already pointed out in the work on time-temperature-tolerance carried out by the US Department of Agriculture in the western regional research laboratories (WWRL,1975). More recent works have been done to study the stability of some frozen vegetables and the results reported are similar. For instance, Lyon et al. (1988) and McEwan et al. (1990) have investigated the quality of Brussels
sprouts and cauliflowers, respectively. They showed that quality deterioration is more severe with warmer storage temperatures and that quality losses are cumulative and irreversible even in shorts periods of temperature abuses. It is important to note that data can not be transferred from one product to another except if the
PPP
factors (product quality, processing and packaging) are the same. This is why, more research works are needed to determine the real quality loss for each frozen product (Reid, 1993).The objective of this study was to provide information on sensory and chemical quality of frozen broccoli thermoabused. The temperature abuses carried out in this study were designed to simulate the time-temperature history of the product along the distribution chain from the production to the consumer house.
MATERIALS AND METHODS
Samples
Broccoli (cv. Marathon and cv. Lord grown in Portugal) were obtained from a local Portuguese industry (Friopesca) immediately after freezing. They were previously sorted, washed, cut and blanched (2 min, 100°C). Just frozen broccoli was immediately carried from the company to the laboratory into insulated boxes and stored one night at -22°C±2°C before packaging. For the packaging treatment, approximately 900 g of frozen broccoli were put in polyethylene bags (37cm x 25cm). Thermocouples were previously placed in the centre of broccoli stems. Packaged broccoli was then randomly put in two different insulated boxes (further control and test samples) and stored in a home freezer Ariston (Merlon' Electrodomesticos S.A., Portugal) at -220C±2°C during on month before the beginning of temperature abuses.
Experiment Design
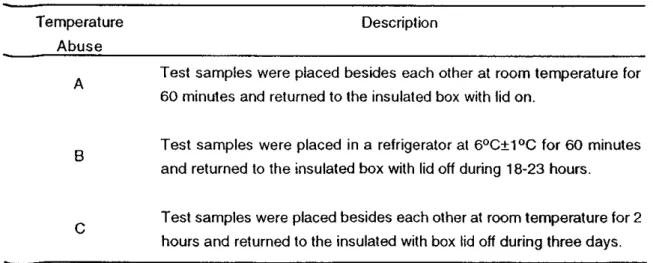
Control samples were kept during the whole experiment in the freezer inside the insulated box with lid on. Meanwhile, test samples were put through three types of temperature abuses (Table 1) according to a definite schedule (Table 2).
Table 1 : Temperature abuses
on broccoliTemperature Description
Abuse A
Test samples were placed besides each other at room temperature for 60 minutes and returned to the insulated box with lid on.
B
Test samples were placed in a refrigerator at 6°C±1°C for 60 minutes and returned to the insulated box with lid off during 18-23 hours.
C
Test samples were placed besides each other at room temperature for 2 hours and returned to the insulated with box lid off during three days.
Table 2 : Schedule of temperature abuses Temperature Abuse A
B
C
33 61 65 Frozen storage 35 62 (days) 55 01 63 64 CO twice, 6 hours intervalAnalyses
Temperature in broccoli samples was monitored every 15 minutes during temperature abuses and then every hour during 2 days using a Data Logger (Serie 1000 Squirrel Data Logger, Grant Instruments Ltd, Cambridge).
Concurrently, abused and control broccoli were regularly assessed by sensory and chemical analyses. Products were thawed at room temperature prior to chemical analyses but directly used for sensory evaluation. Table 3 presents the different storage times of evaluation.
Table 3 : Schedule of chemical and sensory analyses
Products evaluation Frozen storage (days)
1 37 2 54 3 60 4 66 5 88
Moisture content
Moisture content determination was made by drying overnight approximately 5 g of broccoli sample (Eheart and Oadland, 1973) at 70°C in a drying oven (WTB Winder, Germany).
PH
pH was determined using an adaptation of Eheart and Gott (1965) method. 50 g of broccoli sample and 100 ml of distilled water were mixed, ground for 3 minutes with a mixer (Moulinex, France) and pH determination was made after 2 minutes using a glass electrode pH meter (micropH 2001, Crison Instruments S.A., Spain).
Titratable acidity
Titratable acidity was measured according to the AOAC Official Methods of Analysis (1995). This analysis is based on the titration of a prepared broccoli solution with 0,1 N NaOH using phenolphtalein. The prepared solution was obtained by mixing broccoli and desionised water, by grinding the mixture, boiling, cooling and finally filtering it. The filtrate was used as the broccoli prepared solution.
Totaland reduced
Total and reduced sugars contents were determined according to the Portuguese norm NP-1420 (1987). This analysis is based on the Luff-Schoorl method using Carrez reagents to determine copper oxide content after hydrolysis of broccoli.
Colour
Colour measurement was performed using a colorimeter (Chroma Meter CR-300, Minolta). 50 g of broccoli and 100 ml of distilled water were mixed, ground for 3 minutes and the prepared pulp was placed in a Petri plate on the platform of the colorimeter. L, a, b values were measured and the total colour difference, AE, between control and test samples was calculated as follows :
OE = (AL)2+(Aa)2+(Ab) 2 (1)
where : AL = Lt-Le
Aa = ark
c : control sample
Ab = bt-be
t : test sample
Peroxidase assay
Peroxidase activity was determined by a spectrophotometer assay adapted from Barth et al: (1993) and Hemeda and Klein (1990) methods. 20 g of broccoli were mixed with 50 ml of distilled water, ground with a mixer for 2 minutes and filtered through three layers of cheese-cloth . The filtrate was used for the enzyme assay.
The assay was carried out at 25°C with a spectrophotometer (Shimadzu UV 1601, Japan) at 470 nm. The substrate mixture contained 10 ml of 1% guaiacol (Sigma, G-5502) 10 ml of 0.3% hydrogen peroxide (Riedel de Haen, 31642) and 100 ml of 0.05 M sodium phosphate buffer pH 6.5. The reaction cuvette contained 2.9 ml of substrate mixture and 0.1 ml of broccoli extract. Readings were made each 0.2 minutes for two minutes. One unit of peroxidase activity was defined as a change of 0.001 in absorbance per minute in the linear part of the curve.
Two replications were made for each analysis and the precision of all the methods was determined by repeating ten times each analysis with the same sample.
Sensory evaluation
For assessment, 250 g of frozen broccoli were put in 1 litre of boiling water with 4.2 g of salt. The pan was covered and broccoli were cooked for 7 minutes. Broccoli were presented just after cooking to a trained sensory panel of 11 people. The final evaluation (after 88 days of frozen storage) was achieved with 19 people. Two samples (control and test broccoli) were presented to the judges and they were asked first to indicate if they could find a difference between samples, then to evaluate each sample for green colour intensity, brightness, amount of yellow, amount of brown, firmness, broccoli flavour intensity and off flavour using 7 points-scales and finally to say which one they preferred.
Statistical analyses
Statistical analyses were assessed by two-ways ANOVA. Sources of variations were treatments and time for chemical analyses and judges and treatments for sensory evaluation. The Least Significant Difference method (95% confidence level) was then used to locate difference if significance was found. Panel results from the preference and difference tests were analysed using the table of critical number of correct answers for two-sided paired-comparison test.
RESULTS AND DISCUSSION
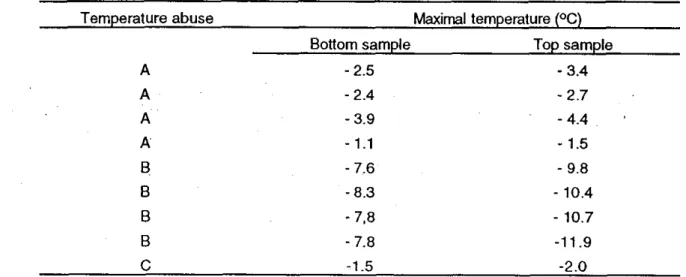
Maximal temperatures reached by two samples of abused broccoli are reported for each temperature abuse in Table 4. The first sample was placed on the bottom of the insulated box, the other one on the top during storage in the freezer.
Table 4 : Maximal temperatures reached by two samples of abused broccoli
Temperature abuse Maximal temperature (°C)
Bottom sample Top sample
A - 2.5 - 3.4 A - 2.4 - 2.7 A - 3.9 - 4.4 A - 1.1 - 1.5 - 7.6 - 9.8 -8.3 -10.4 - 7,8 - 107 - 7.8 -11.9 C -1.5 -2.0
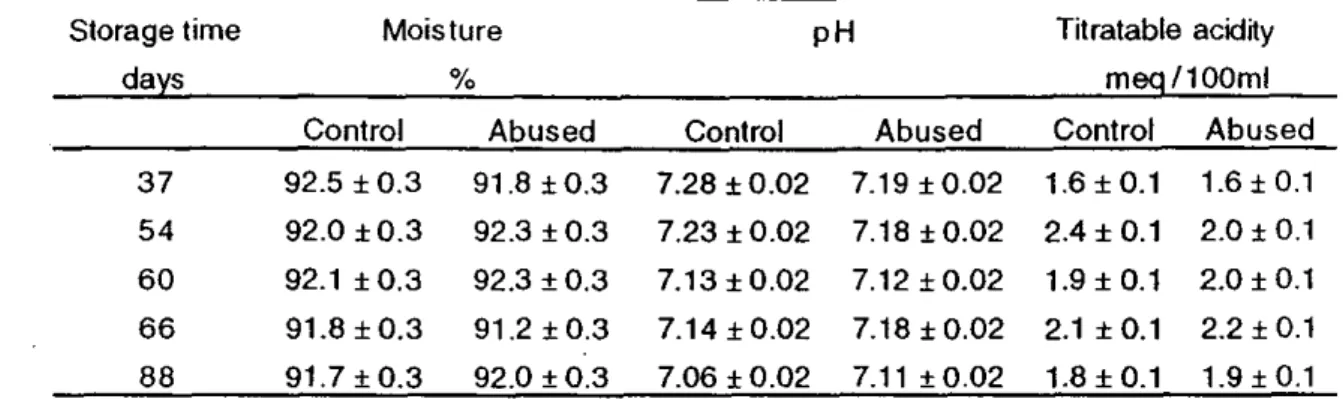
Moisture content, pH and titratable acidity of frozen broccoli samples are presented in Table 5. No significant difference was found between control vs abused broccoli for none of these three parameters. However, pH decreased significantly along frozen storage for control broccoli (p<0.01). Titratable acidity of both samples was also significantly different along frozen storage. Total and reduced sugars contents of frozen broccoli samples, presented in Table 6, showed no significant difference between control vs abused samples. Significance was found for both samples along frozen storage.
In both control and abused broccoli, no peroxidase activity was detected over the whole frozen storage.
L, a, b values of control and abused frozen broccoli and the total colour difference,
SE,
between them (Equation 1) are presented in-i-Ale 7. These results revealed a significant colour u< difference between control and abused samples. The difference considered very distinct at the beginning, became smaller once all the temperature abuses were achieved. Concurrently,colorimeter measurements allowed to find a significant difference (p<0.01) between L values (lightness) and a values (green colour) of both samples.
Table 5 Moisture content, pH and titratable acidity of control and abused frozen broccoli
Storage time Moisture pH Titratable acidity
days meq /100m1
Control Abused Control Abused Control Abused
37 92.5 ± 0.3 91.8 ± 0.3 7.28± 0.02 7.19 ± 0.02 1.6 ± 0.1 1.6± 0.1 54 92.0 ± 0.3 92.3 ± 0.3 7.23 ± 0.02 7.18 ± 0.02 2.4± 0.1 2.0± 0.1 60 92.1 ±0.3 92.3 ± 0.3 7.13± 0.02 7.12± 0.02 1.9± 0.1 2.0± 0.1 66 91.8 ± 0.3 91.2 ± 0.3 7.14 ± 0.02 7.18 ± 0.02 2.1 ± 0.1 2.2± 0.1 88 91.7 ± 0.3 92.0± 0.3 7.06 ± 0.02 7.11 ± 0.02 1.8± 0.1 1.9± 0.1
Table 6 : Total and reduced sugars content of control and abused frozen broccoli
Frozen storage Total sugars Reduced sugars
days g/100q q /100q
Control Abused Control Abused
37 1.5 1.6 1.6 1.6
54 1.9 1.8 1.7 1.5
60 1.8 1.7 1.7 1.6
66 1.6 1.6 1.6 1.6
88 1.7 1.7 1.5 1.6
Table 7 : L, a, b values and total colour difference, AE, between control and abused broccoli
Storage time L a
b
AEdays
Control Abused Control Abused Control Abused
37 48.3 ± 0.2 42.9± 0.2 -17.0 ± 02 -15.9± 0.2 21.4 ± 0.3 18.8 0.3 3.96 54 44.7 t 0.2 44.0 ± 0.2 -16.7± 0.2 -15.7 ± 0.2 21.1 ±0.3 20.6 ± 0.3 1.30 60 44.3 ± 0.2 43.3± 0.2 -16.7± 0.2 -16.1 ± 0.2 20.6 ± 0.3 20.9 ± 0.3 1.20 66 44.5 ± 0.2 42.9 ± 0.2 -16.6 ± 0.2 -16.3± 0.2 20.9 ± 0.3 20.7 ± 0.3 1.69 88 45.4 ± 0.2 44.8± 0.2 -16.7 ± 0.2 -16.2 ± 0.2 20.7 ± 0.3 20.9 ± 0.3 0.79
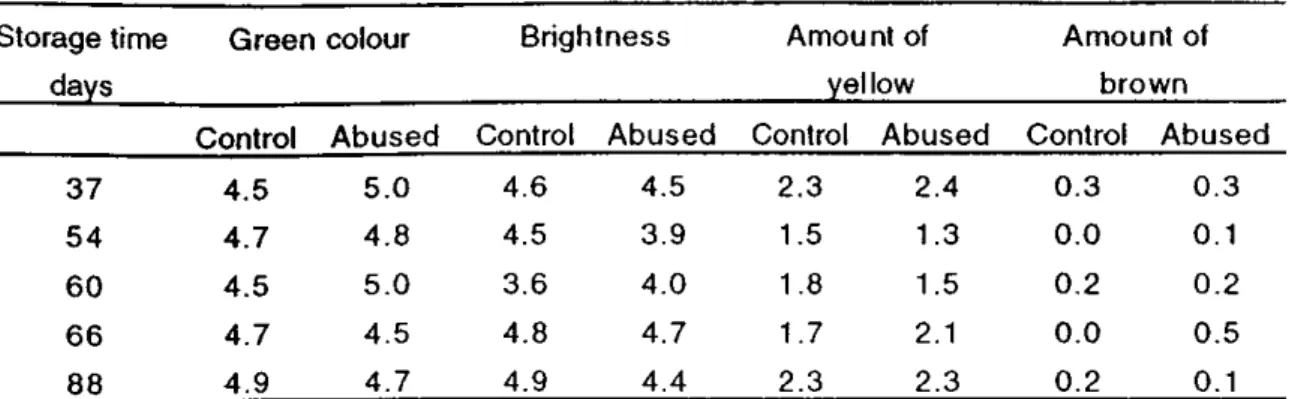
Panel scores presented in Tables 8 and 9 revealed no significant difference between control and abused broccoli as regards to the quality parameters studied. No significant difference neither was found between products in the difference paired-comparison test (Table 10) except for the third one. Concerning preference (Table 10), no significance was obtained but it is interesting to note that in the last evaluation, people who found a difference between samples preferred the control one (p=0.05).
Table 8 : Panel mean scores of colour parameters for cooked control and abused broccoli
Storage time Green colour Brightness Amount of Amount of
days yellow brown
Control Abused Control Abused Control Abused Control Abused
37 4.5 5.0 4.6 4.5 2.3 2.4 0.3 0.3
54 4.7 4.8 4.5 3.9 1.5 1.3 0.0 0.1
60 4.5 5.0 3.6 4.0 1.8 1.5 0.2 0.2
66 4.7 4.5 4.8 4.7 1.7 2.1 0.0 0.5
88 4.9 4.7 4.9 4.4 2.3 2.3 0.2 0.1
Table 9 : Panel mean scores of firmness and flavour for cooked control and abused broccoli
Storage time Firmness Broccoli flavour Off-flavour days
Control Abused Control Abused Control Abused
37 4.0 4.7 4.5 5.2 0.6 0.3
54 4.1 3.4 4.5 4.2 0.7 0.9
60 4.5 3.9 4.2 4.4 1.1 0.8
66 4.0 3.8 4.2 4.1 0.4 0.6
88 4.8 .4.2 4.5 4.3 0.9 1.0
Table 10 : Panel results of difference and preference tests between broccoli samples
Storage time Difference test Preference test days
Difference No difference Control sample Abused sample
37 9 2 4 6
54 8 3 4 6
60 10 1 7 6
66 6 5 8 5
88 14 5 14 6
It can be conclude that frozen broccoli can suffer some temperature abuses without getting much more quality loss perceived by the consumer.
ACKNOWLEDGEMENTS
The authors would like to acknowledge the collaboration of the company FRIOPESCA and in particular Eng. Antonio Jose Oliveira. The author Betty Despre also acknowledges the research financial support from JNICT.
REFERENCES
AOAC. 1995. Official Methods of Analysis. Supplement March 1996. Official Method 942.15.
Barth, M.M., Kerbel, E.L., Perry, A.K. and Schmidt, S.J. Modified atmosphere packaging Affects ascorbic acid, enzyme activity and market quality of Broccoli. Journal of Food Science. Vol. 58 (1), pp. 140-143. 1993.
Bramsnaes, F. Maintaining the quality of frozen food during distribution. Food Technology. pp. 38-43. April 1981.
Eheart, M.S. and Gott, C. Chlorophyll, ascorbic acid and pH changes in green vegetables cooked by stir-fry, microwave, and conventional methods and a comparison of chlorophyll methods. Food Technology. pp. 185-189. May 1965.
Eheart, M.S an Odland, D. Quality of frozen green vegetables blanched in four concentrations of ammonium bicarbonate. Journal of Food Science. Vol. 38, pp. 954-958. 1973.
Hemeda, H.M. and Klein, B.P. Effects of naturally occurring antioxidants on peroxidase activity of vegetables extracts. Journal of Food Science. Vol. 55 (1), pp. 184-185 and 192. 1990.
Lyon, D.H., McEwan, J.A., Taylor, J.M. and Reynolds M.A. Sensory quality of frozen Brussels sprouts in a time-temperature tolerance study. Food Quality and Preference. Vol. 1(1), pp. 37-41. 1988.
McEwan, J.A., Springett, M.B., Colwill, J.S., Griffiths, N.M., Churchill, H.M. and Williams, B.M. Time-temperature tolerance study of Cauliflower : Sensory profiling and in-house acceptability. Campden Food and Drink Research Association, Technical Memorandum AP 586. 1990.
Norma Portuguese NP-1420. Determinacâo dos acticares totais, dos actIcares redutores e dos acikares não redutoreS (sacarose). Tecnica de Luff-Schoorl. Processo corrente. 1987.
Reid, S. In Frozen Food Technology. Edited by Mallet C.P. Blackie Academic & Professional. Glasgow. Basic physical phenomena in the freezing and thawing of plant and animal tissues, chapter 1, pp. 1-58. 1993.
WRRL. Cited by Talburt, V.F. and Smith, 0. in Potato Processing, p.429. AVI Publishing Company. Connecticut. 1975.