arXiv:1508.04735v2 [hep-ex] 26 Jan 2016
EUROPEAN ORGANISATION FOR NUCLEAR RESEARCH (CERN)
CERN-PH-EP-2015-179
Searches for scalar leptoquarks in
pp
collisions at
√
s
= 8 TeV with the ATLAS detector
The ATLAS Collaboration
Abstract
Searches for pair-produced scalar leptoquarks are performed using 20 fb−1 of proton–proton collision data provided by the LHC and recorded by the AT-LAS detector at √s = 8 TeV. Events with two electrons (muons) and two or more jets in the final state are used to search for first (second)-generation leptoquarks. The results from two previously published ATLAS analyses are interpreted in terms of third-generation leptoquarks decaying to bντ¯b ¯ντ and
tντ¯t ¯ντfinal states. No statistically significant excess above the Standard Model expectation is observed in any channel and scalar leptoquarks are excluded at 95% CL with masses up tomLQ1 <1050 GeV for first-generation leptoquarks,
mLQ2 < 1000 GeV for second-generation leptoquarks, mLQ3 < 625 GeV for third-generation leptoquarks in thebντ¯b ¯ντchannel, and 200< mLQ3 <640 GeV in thetντ¯t ¯ντchannel.
c
2016 CERN for the benefit of the ATLAS Collaboration.
Contents
1 Introduction 3
2 The ATLAS detector 4
3 Data and Monte Carlo samples 5
3.1 Monte Carlo for background predictions 5
4 Searches for first- and second-generation LQs 6
4.1 Trigger and data collection 7
4.2 Object selection 7
4.3 Event pre-selection 8
4.4 Signal regions 9
4.5 Background estimation 10
4.5.1 Control regions for Z/γ∗+jets and t¯t backgrounds 10
4.5.2 Kinematic distributions 11
4.6 Systematic uncertainties 11
4.7 Results 13
5 Search for third-generation LQs in the bντ¯b ¯ντchannel 15
5.1 Object and event selection 15
5.2 Background estimation 17
5.3 Results 17
6 Search for third-generation LQs in the tντ¯t ¯ντchannel 19
6.1 Object and event selection 21
6.2 Background estimation 22
6.3 Results 22
1 Introduction
Leptoquarks (LQ) are predicted by many extensions of the Standard Model (SM) [1–7] and may provide an explanation for the many observed similarities between the quark and lepton sectors of the SM. LQs are colour-triplet bosons with fractional electric charge. They carry non-zero values of both baryon and lepton number [8]. They can be either scalar or vector bosons and are expected to decay directly to lepton–quark pairs (where the lepton can be either charged or neutral).
The coupling strength between scalar LQs and the lepton-quark pairs depends on a single Yukawa coupling, termed λLQ→ℓq. The additional magnetic moment and electric quadrupole moment in-teractions of vector LQs are governed by two coupling constants [9]. The coupling constants for both the scalar and vector LQs, and the branching fraction of the LQ decay into a quark and a charged lepton, β, are model dependent. The production cross-section and couplings of vector LQs are enhanced relative to the contribution of scalar LQs, although the acceptance is expected to be similar in both cases. This analysis considers the simpler scenario of scalar LQ pair-production, for which the form of the interaction is known and which provides more conservative limits on LQ pair-production than for vector LQ pair-production.
In proton–proton collisions, LQs can be produced singly and in pairs. The production of single LQs, which happens at hadron colliders in association with a lepton, depends directly on the un-known Yukawa coupling λLQ→ℓq. However, LQ pair-production is not sensitive to the value of the coupling. In pp collisions with a centre-of-mass energy √s = 8 TeV, the dominant pair-production mechanism for LQ masses below ∼1 TeV is gluon fusion, while the qq-annihilation production process becomes increasingly important with increasing LQ mass.
The minimal Buchmüller–Rückl–Wyler model (mBRW) [10] is used as a benchmark model for scalar LQ production. It postulates additional constraints on the LQ properties, namely that the couplings have to be purely chiral, and makes the assumption that LQs are grouped into three families (first, second and third-generation) that couple only to leptons and quarks within the same generation. The latter requirement excludes the possibility of flavour-changing neutral currents (FCNC) [11], which have not been observed to date.
Previous searches for pair-produced LQs have been performed by the ATLAS Collaboration with 1.03 fb−1of data collected at √s = 7 TeV, excluding at 95% confidence level (CL) the existence of scalar LQs with masses below 660 (607) GeV for first-generation LQs at β = 1 (0.5) [12] and 685 (594) GeV for second-generation LQs at β = 1 (0.5) [13]. The CMS Collaboration excluded at 95% CL the existence of scalar LQs with masses below 830 (640) GeV for first-generation LQs at β = 1 (0.5) and 840 (650) GeV for second-generation LQs at β = 1 (0.5) with 5.0 fb−1of data collected at √s = 7 TeV [14].
Pair-produced third-generation scalar LQs decaying to bντ¯b ¯ντ have been excluded by the CMS
Collaboration for masses below 700 GeV at β = 0, and for masses below 560 GeV over the full β range using 19.7 fb−1 of data collected at √s = 8 TeV [15]. Third-generation scalar LQs have
been excluded in the bτ+¯bτ−channel at β = 1 for masses up to 740 GeV by the CMS Collaboration using 19.7 fb−1of data collected at √s = 8 TeV [16], and by the ATLAS Collaboration at β = 1 for masses up to 534 GeV using 4.7 fb−1of data collected at √s = 7 TeV [17]. The CMS Collaboration
also excluded third-generation scalar LQs in the tτ−¯tτ+channel at β = 1 for masses up to 685 GeV
using 19.7 fb−1of data collected at √s = 8 TeV [15].
In this paper, searches for pair-produced first- and second-generation scalar LQs (LQ1 and LQ2, respectively) are performed by selecting events with two electrons or muons plus two jets in the final state (denoted by eejj and µµjj, respectively). In addition, limits are placed on pair-produced third-generation scalar LQs (LQ3) by reinterpreting ATLAS searches for supersymmetry (SUSY) in two different channels [18,19]. LQ production and decay mechanisms can be similar to those of stop quarks (˜t) and sbottom quarks (˜b). For example, ˜t˜t → tt ˜χ0χ˜0gives the same event topology
as LQ3 LQ3 →tντ¯t ¯ντ in the limit where the neutralino ( ˜χ0) is massless. Two ATLAS analyses
optimised for these SUSY processes are therefore used to set limits on the equivalent LQ decay processes: LQ3 LQ3 →bντ¯b ¯ντand LQ3 LQ3 →tντ¯t ¯ντ.
The results for each LQ3 channel cannot be combined since the parent LQs have different electric charges in the two cases (−13e for the LQ3 LQ3 →bντ¯b ¯ντchannel and
2
3e for the LQ3 LQ3 →tντ¯t ¯ντ
channel, where e is the elementary electric charge). The branching fractions of LQ3 decays to bντ and tντ are assumed to be equal to 100% in each case. Although complementary decays of
a charge −13e ( 2
3e) LQ into a tτ−¯tτ
+(bτ+¯bτ−) final state are also allowed, kinematic suppression
factors which favour LQ decays to b-quarks over t-quarks and the relative strengths of the Yukawa couplings would have to be considered. Since these suppression factors are model dependent, limits are not provided as a function of β for the LQ3 channels.
2 The ATLAS detector
The ATLAS experiment [20] is a multi-purpose detector with a forward-backward symmetric cyl-indrical geometry and nearly 4π coverage in solid angle. The three major sub-components of ATLAS are the tracking detector, the calorimeter and the muon spectrometer. Charged-particle tracks and vertices are reconstructed by the inner detector (ID) tracking system, comprising silicon pixel and microstrip detectors covering the pseudorapidity1range |η| < 2.5, and a straw tube tracker that covers |η| < 2.0. The ID is immersed in a homogeneous 2 T magnetic field provided by a solen-oid. Electron, photon, jet and tau energies are measured with sampling calorimeters. The ATLAS calorimeter system covers a pseudorapidity range of |η| < 4.9. Within the region |η| < 3.2, elec-tromagnetic calorimetry is provided by barrel and endcap high-granularity lead/liquid argon (LAr)
1ATLAS uses a right-handed coordinate system with its origin at the nominal interaction point (IP) in the centre of the
detector and the z-axis along the beam pipe. The x-axis points from the IP to the centre of the LHC ring, and the y-axis points upward. Cylindrical coordinates (r, φ) are used in the transverse plane, φ being the azimuthal angle around the beam pipe. The pseudorapidity is defined in terms of the polar angle θ as η = − ln tan(θ/2).
calorimeters, with an additional thin LAr presampler covering |η| < 1.8, to correct for energy loss in material upstream of the calorimeters. Hadronic calorimetry is provided by a steel/scintillator-tile calorimeter, segmented into three barrel structures within |η| < 1.7, and two copper/LAr hadronic endcap calorimeters. The forward region (3.1 < |η| < 4.9) is instrumented by a LAr calorimeter with copper (electromagnetic) and tungsten (hadronic) absorbers. Surrounding the calorimeters is a muon spectrometer (MS) with air-core toroids, a system of precision tracking chambers providing coverage over |η| < 2.7, and detectors with triggering capabilities over |η| < 2.4 to provide precise muon identification and momentum measurements.
3 Data and Monte Carlo samples
The results presented here are based on proton–proton collision data at a centre-of-mass energy of √
s = 8 TeV, collected by the ATLAS detector at the LHC during 2012. Data samples correspond-ing to an integrated luminosity of 20.3 fb−1 are used by all channels except for the LQ3 LQ3 → bντ¯b ¯ντanalysis which uses 20.1 fb−1because of requirements made by the trigger used in the
ana-lysis.
Simulated signal events of pair-produced scalar LQs decaying to e+e−q ¯q, µ+µ−q ¯q, tντ¯t ¯ντ, and
bντ¯b ¯ντ final states are produced using the Pythia 8.160 [21] event generator with CTEQ6L1 [22]
parton distribution functions (PDFs). The coupling λLQ→ℓqwhich determines the LQ lifetime and width [23] is set to √0.01 × 4πα, where α is the fine-structure constant. This value gives the LQ a full width of less than 100 MeV, which is much smaller than the detector resolution. For LQ masses in the ranges considered here (200 GeV ≤ mLQ≤ 1300 GeV, in steps of 50 GeV), the value
of the coupling used is such that the LQs can be considered to decay promptly. The production cross-section of pair-produced LQs is assumed to be independent of the coupling strength. The signal process is normalised to the expected next-to-leading-order (NLO) cross-sections for scalar LQ pair-production [24]. The signal production cross-section is 23.5 fb for a LQ mass of 600 GeV, and 0.40 fb for a 1 TeV LQ and is the same for each generation.
3.1 Monte Carlo for background predictions
The Monte Carlo (MC) samples used to estimate the contributions from SM backgrounds to the LQ1 and LQ2 searches are discussed here. Details about the MC models used for estimating backgrounds in the LQ3 searches are available in Refs. [18] (for the bντ¯b ¯ντchannel) and [19] (for
the tντ¯t ¯ντchannel).
The MC samples used to model the Z/γ∗+jets background with a dilepton invariant mass (mℓℓ) less
1.4.1[25]. The high-mass Drell–Yan samples are generated assuming massive c- and b-quarks instead of the conventional massless treatment.
Samples of t¯t events are produced with POWHEG box [26,27] interfaced with PYTHIA 6. MC
samples representing the WW, WZ, and ZZ diboson decays are generated with HERWIG 6.52 [28] and use the AUET2 [29] values for the tunable parameters (the ‘AUET2 MC tune’). Samples of single-top-quark events in the Wt and s-channel are generated with MC@NLO 4.01 [30,31] and the AUET2 MC tune, while the t-channel samples are generated with AcerMC 3.8 [32] interfaced with PYTHIA 8 and use the AUET2B [33] MC tune. The hadronisation and parton showering of the samples produced with MC@NLO are done using HERWIG 6.52 coupled to JIMMY 4.31 [34]. The W+jets samples are produced with ALPGEN 2.14 interfaced with JIMMY 4.31, also with the AUET2 MC tune applied. The choice of PDFs used to produce the MC simulated samples is generator dependent: AcerMC, PYTHIA, HERWIG and ALPGEN use CTEQ6L1, while MC@NLO uses CT10[35]. For all samples, the detector response is modelled [36] using GEANT4 [37], except for the Drell–Yan background samples, which use a fast detector simulation where the calorimeter response is parameterised. The differences between fast and full simulation in terms of kinematic spectra and modelling of relevant objects are evaluated to be negligible.
The cross-sections of background processes used in the analysis are taken from theoretical predic-tions. Single-top production cross-sections in the s-channel [38], t-channel [39], and in associated
production with a W boson [40], are calculated to NLO+NNLL accuracy. W+jets and Z → ττ
cross-sections with NNLO accuracy are used [41]. The cross-sections for WW, WZ, and ZZ pro-cesses are calculated at NLO [42,43]. The theoretical cross-section for WW production is scaled by a factor 1.2 and the uncertainty is increased by an extra 20%, in order to take into account the ATLAS [44] and CMS measurements [45], which showed an excess in data at the level of 20% (see Refs. [46,47] for more discussion about possible causes of the excess).
For the Z/γ∗+jets and t¯t backgrounds, LO and NLO cross-sections, respectively are used. These backgrounds are constrained using two control regions (CRs), as described in Section4.5.
4 Searches for first- and second-generation LQs
The first- and second-generation analyses exploit similarities in the final states and use common search strategies to select dilepton plus dijet final states. Control regions are used to constrain estimates of the dominant backgrounds to the data. A set of discriminating variables is used to define signal regions (SRs) that are used for a counting analysis.
4.1 Trigger and data collection
Selected data events are required to have all relevant components of the ATLAS detector in good working condition. For the LQ1 (eejj) analysis, the trigger requires at least two electromagnetic calorimeter clusters, defined as energy deposits in the cells of the electromagnetic calorimeter. The leading cluster is required to have transverse momentum pT > 35 GeV and the sub-leading one
pT> 25 GeV. This trigger selects electrons without imposing any requirement on the isolation and
this allows a data-driven estimate of the background contribution from jets in the final state that pass the electron selection, as described in detail in Ref. [48]. The trigger is 98% efficient with respect to the offline selection, which requires pTabove 40 (30) GeV for the leading (sub-leading)
electron.
For the LQ2 (µµjj) analysis, events are selected from data using a trigger which requires the pres-ence of at least one muon candidate in the event with pTabove 36 GeV. This trigger is fully efficient
relative to the offline selection for muons with pTabove 40 GeV [49].
4.2 Object selection
Electrons are selected and identified by imposing requirements on the shape of the cluster of en-ergy deposits in the calorimeter, as well as on the quality of the track, and on the track-to-cluster matching. The identification efficiency is on average 85% [50]. Electron candidates must have transverse energy ET > 30 GeV and |η| < 2.47. Electron candidates associated with clusters in
the transition region between the barrel and endcap calorimeters (1.37 < |η| < 1.52) are excluded. All electrons are required to be reconstructed with cluster-based or combined cluster- and track-based algorithms and to satisfy calorimeter quality criteria. Requirements are made on the trans-verse (|d0|) and longitudinal (|z0|) impact parameters of the electron relative to the primary vertex
and must satisfy |d0| < 1 mm and |z0| < 5 mm. In addition, electrons are required to be
isol-ated by imposing requirements on the E∆R<0.2T measured in the calorimeter within a cone of size ∆R = p(∆η)2+ (∆φ)2 = 0.2 around the electron cluster excluding the electron cluster energy, and
corrected to account for leakage (i.e. energy deposited by the electron outside of the cluster) and the average number of proton–proton interactions per bunch-crossing. The isolation requirements are optimised for high-pT electrons following the strategy in Ref. [48]. The leading electron is
required to have E∆R<0.2
T < 0.007 × ET+ 5 GeV, and the sub-leading electron is required to have
E∆R<0.2T < 0.022 × ET+ 6 GeV.
Muon tracks are reconstructed independently in the ID and the MS. Tracks are required to have a minimum number of hits in each system, and must be compatible in terms of geometrical and momentum matching. In particular, in order to prevent mis-measurements at high pT, muons are
required to have hits in all three MS stations, as described in Ref. [48]. In order to increase the muon identification efficiency, when one muon in the event satisfies the three-stations requirement, the criteria for the second muon in the event are relaxed to require hits in only two MS stations.
Information from both the ID and MS is used in a combined fit to refine the measurement of the momentum of each muon [51]. Muon candidates are required to have pT> 40 GeV, |η| < 2.4, |d0| <
0.2 mm and |z0| < 1.0 mm. Muons must also pass a relative-isolation requirement p∆R<0.2T /pT <
0.2, where p∆R<0.2T is the sum of the transverse momenta of all the tracks with pT above 1 GeV
(except for the muon track) within a cone of ∆R < 0.2 around the muon track, and pT is the
transverse momentum of the muon.
Jets are reconstructed from clusters of energy deposits detected in the calorimeter using the anti-kt algorithm [52] with a radius parameter R = 0.4 [53]. They are calibrated using energy- and η-dependent correction factors derived from simulation and with residual corrections from in-situ measurements. The jets used in the analysis must satisfy pT > 30 GeV and |η| < 2.8. Jets
recon-structed within a cone of ∆R = 0.4 around a selected electron or muon are removed. Additional jet quality criteria are also applied to remove fake jets caused by detector effects. A detailed descrip-tion of the jet energy scale measurement and its systematic uncertainties is given in Ref. [54].
4.3 Event pre-selection
Multiple pp interactions during bunch-crossings (pile-up) can give rise to multiple reconstructed vertices in events. The primary vertex of the event, from which the leptons are required to originate, is defined as the one with the largest sum of squared transverse momenta of its associated tracks. Events are selected if they contain a primary vertex with at least three associated tracks satisfying pT,track > 0.4 GeV.
MC events are corrected to better describe the data by applying a per-event weight to match the distribution of the average number of primary vertices observed in data. A weighting factor is also applied in order to improve the modelling of the vertex position in z. Scale factors are applied to account for differences in lepton identification and selection efficiency between data and MC simu-lation. The scale factors depend on the lepton kinematics and are described in detail in Ref. [51] for muons, and in Ref. [55] for electrons. The energy and momentum of the selected physics objects are corrected to account for the resolution and scale measured in data, as described in Ref. [51] for muons, in Ref. [55] for electrons and in Ref. [54] for jets.
Events are selected in the eejj channel if they contain exactly two electrons with pT> 40 (30) GeV
for the leading (sub-leading) electron and at least two jets with pT> 30 GeV. For the µµjj channel,
events are selected if they contain exactly two muons with pT> 40 GeV and opposite-sign charge,
and at least two jets with pT> 30 GeV. No requirements are placed on the charges of the electron
candidates due to inefficiencies in determining the charge of high-pT tracks associated with
elec-trons. These sets of requirements form the basic event ‘pre-selection’ for the analyses, which is used to build the control and signal regions discussed in the following sections.
4.4 Signal regions
After applying the event pre-selection requirements, a set of signal regions is defined using addi-tional kinematic variables in order to discriminate LQ signals from SM background processes and to enhance the signal-to-background ratio. The variables used are:
– mℓℓ: The dilepton invariant mass.
– ST: The scalar sum of the transverse momenta of the two leading leptons and the two leading
jets.
– mminLQ: The lowest reconstructed LQ mass in the event. The reconstructed masses of the two LQ candidates in the event (mminLQ and mmaxLQ) are defined as the invariant masses of the two lepton–jet pairs with the smallest difference (and mminLQ < mmax
LQ).
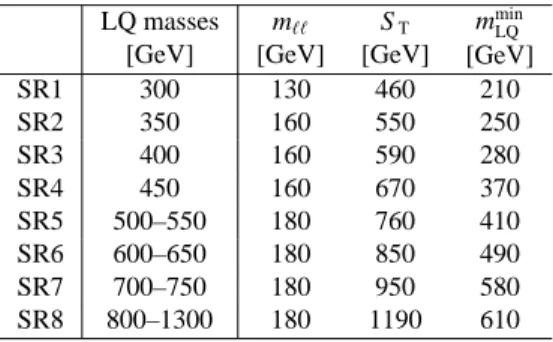
Signal regions are determined by optimising the statistical significance as defined in Ref. [56]. The optimisation procedure is performed in a three-dimensional space constructed by mℓℓ, ST and
mminLQ for each of the signal mass points. Several adjacent mass points may be grouped into a single SR. The signal acceptance of the selection requirements is estimated to be ≈ 50% in the µµjj channel and between 65% and 80% in the eejj channel (assuming β = 1.0). The difference is due to tighter quality selection requirements in the µµjj channel used to prevent muon mis-measurements in MS regions with poor alignment or missing chambers. The optimised signal regions are presented in Table1together with the mass of the corresponding LQ hypothesis. Each LQ mass hypothesis is tested in only one signal region, where limits on σ × β are extracted.
LQ masses [GeV] mℓℓ [GeV] ST [GeV] mmin LQ [GeV] SR1 300 130 460 210 SR2 350 160 550 250 SR3 400 160 590 280 SR4 450 160 670 370 SR5 500–550 180 760 410 SR6 600–650 180 850 490 SR7 700–750 180 950 580 SR8 800–1300 180 1190 610
Table 1: The minimum values of mℓℓ, ST, and mminLQ used to define each of the signal regions targeting different
LQ masses in the eejj and µµjj channels. Each signal region is valid for one or more mass hypotheses, as shown in the second column.
4.5 Background estimation
The main SM background processes to the LQ1 and LQ2 searches are the production of Z/γ∗+jets events, t¯t events where both top quarks decay leptonically, and diboson events. Additional small contributions are expected from Z → ττ and single-top processes. Multi-jets, W+jets, t¯t (where one or more top quarks decays hadronically), and single-top events with mis-identified or non-prompt leptons arising from hadron decays or photon conversions can also contribute. These fake lepton backgrounds are estimated separately in the eejj and µµjj channels using the same data-driven techniques as described in Ref. [48] and are found to be negligible for the µµjj channel. Normalisation factors, derived using background-enriched control regions, are applied to the MC predictions for Z/γ∗+jets and t¯t backgrounds to predict as accurately as possible the background in the signal regions. These control regions are constructed to be mutually exclusive to the signal region and the assumption is made that normalisation factors and their associated uncertainties in the signal region are the same as in the background-enriched control regions.
4.5.1 Control regions for Z/γ∗+jets and t ¯t backgrounds
Two control regions with negligible signal contributions are defined to validate the modelling ac-curacy of the MC simulated background events and to derive normalisation scale factors. The Z/γ∗+jets control region is defined by the pre-selection requirements with an additional require-ment of 60 < mee< 120 GeV in the eejj channel and 70 < mµµ < 110 GeV in the µµjj channel.
These control regions define a pure sample of Z/γ∗+jets events. The t¯t control region is defined in both channels by applying the pre-selection requirements, but demanding exactly one muon and one electron (both with pTabove 40 GeV) in the offline selection instead of two same-flavour
leptons. In the case of the t¯t control region for the eejj channel, the trigger requirement is modified by requiring a single isolated electron with pTabove 24 GeV, which is fully efficient relative to the
offline selection for electrons with pT above 30 GeV. In both cases, the same selection criteria are
applied to data and MC events.
Normalisation factors are applied to the MC predictions for the Z/γ∗+jets and t¯t background pro-cesses. They are obtained by performing a combined maximum likelihood fit to the observed yields in the control regions and signal region under consideration. Systematic uncertainties on the pre-dicted MC yields related to the uncertainty on the cross-sections are taken into account by the fit through the use of dedicated nuisance parameters. The fit procedure is performed using the HistFit-terpackage [57], which is a tool based on the RooStats framework [58]. The normalisation scale factor obtained from a background-only fit for the Z/γ∗+jets background in the eejj (µµjj) channel is 1.1 ± 0.2 (0.97 ± 0.15), while the normalisation scale factor for t¯t is 1.10 ± 0.05 (1.01 ± 0.05). The fitted background scale factors have little sensitivity to the inclusion of signal regions and the eventual presence of a signal.
4.5.2 Kinematic distributions
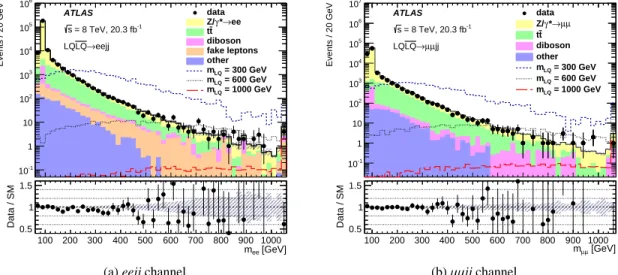
The distributions of the kinematic variables after performing the background-only fits in the control regions, and applying the event pre-selection requirements are shown in Figs.1,2and3for the data, background estimates, and for three LQ masses of 300, 600 and 1000 GeV (with β = 1.0).
Events / 20 GeV -1 10 1 10 2 10 3 10 4 10 5 10 6 10 ATLAS -1 = 8 TeV, 20.3 fb s eejj → LQ LQ data ee → * γ Z/ t t diboson fake leptons other = 300 GeV LQ m = 600 GeV LQ m = 1000 GeV LQ m [GeV] ee m 100 200 300 400 500 600 700 800 900 1000 Data / SM 0.5 1 1.5
(a) eejj channel
Events / 20 GeV -1 10 1 10 2 10 3 10 4 10 5 10 6 10 7 10 ATLAS -1 = 8 TeV, 20.3 fb s jj µ µ → LQ LQ data µ µ → * γ Z/ t t diboson other = 300 GeV LQ m = 600 GeV LQ m = 1000 GeV LQ m [GeV] µ µ m 100 200 300 400 500 600 700 800 900 1000 Data / SM0.5 1 1.5 (b) µµjj channel
Figure 1: Distributions of the dilepton invariant mass (mℓℓ) in the eejj (left) and µµjj (right) channels after applying the pre-selection cuts. The signal model assumes β = 1.0. The last bin includes overflows. The ratio of the number of data events to the number of background events (and its statistical uncertainty) is also shown. The hashed bands represent all sources of statistical and systematic uncertainty on the background prediction.
4.6 Systematic uncertainties
The theoretical uncertainty on the NLO cross-section is taken into account for diboson, single-top, W+jets, and Z → ττ processes. For the two dominant backgrounds (t¯t and Z/γ∗+jets) the modelling uncertainties are estimated using the symmetrised deviation from unity of the ratio of data to MC events in the t¯t and Z/γ∗+jets control regions, which is fitted with a linear function for ST > 400 GeV. The modelling systematic uncertainty is then applied as a function of ST, in the
form of a weighting factor. The choice of STfor such a purpose is motivated by its sensitivity to
mis-modelling of the kinematics of jets and leptons. It varies in the eejj (µµjj) channel between 8%
(10%) and 25% (30%) for the Z/γ∗+jets background and between 6% (10%) and 24% (40%) for
the t¯t background. It increases for signal regions targeting higher mLQ.
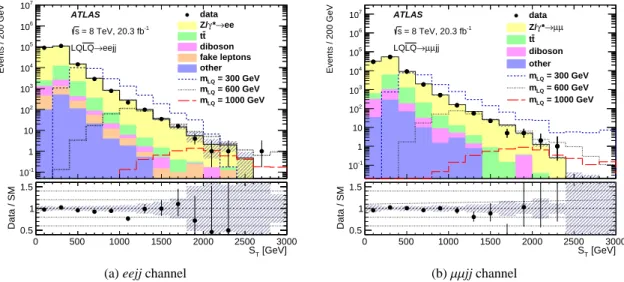
Events / 200 GeV -1 10 1 10 2 10 3 10 4 10 5 10 6 10 7 10 ATLAS -1 = 8 TeV, 20.3 fb s eejj → LQ LQ data ee → * γ Z/ t t diboson fake leptons other = 300 GeV LQ m = 600 GeV LQ m = 1000 GeV LQ m [GeV] T S 0 500 1000 1500 2000 2500 3000 Data / SM 0.5 1 1.5
(a) eejj channel
Events / 200 GeV -1 10 1 10 2 10 3 10 4 10 5 10 6 10 7 10 ATLAS -1 = 8 TeV, 20.3 fb s jj µ µ → LQ LQ data µ µ → * γ Z/ t t diboson other = 300 GeV LQ m = 600 GeV LQ m = 1000 GeV LQ m [GeV] T S 0 500 1000 1500 2000 2500 3000 Data / SM0.5 1 1.5 (b) µµjj channel
Figure 2: Distributions of the total scalar energy (ST) in the eejj (left) and µµjj (right) channels after applying
the pre-selection cuts. The signal model assumes β = 1.0. The last bin includes overflows. The ratio of the number of data events to the number of background events (and its statistical uncertainty) is also shown. The hashed bands represent all sources of statistical and systematic uncertainty on the background prediction.
Events / 100 GeV -1 10 1 10 2 10 3 10 4 10 5 10 6 10 7 10 ATLAS -1 = 8 TeV, 20.3 fb s eejj → LQ LQ data ee → * γ Z/ t t diboson fake leptons other = 300 GeV LQ m = 600 GeV LQ m = 1000 GeV LQ m [GeV] min LQ m 0 200 400 600 800 1000 1200 1400 Data / SM 0.5 1 1.5
(a) eejj channel
Events / 100 GeV -1 10 1 10 2 10 3 10 4 10 5 10 6 10 7 10 ATLAS -1 = 8 TeV, 20.3 fb s jj µ µ → LQ LQ data µ µ → * γ Z/ t t diboson other = 300 GeV LQ m = 600 GeV LQ m = 1000 GeV LQ m [GeV] min LQ m 0 200 400 600 800 1000 1200 1400 Data / SM0.5 1 1.5 (b) µµjj channel
Figure 3: Distributions of the lowest reconstructed LQ mass (mmin
LQ) in the eejj (left) and µµjj (right) channels
after applying the pre-selection cuts. The signal model assumes β = 1.0. The last bin includes overflows. The ratio of the number of data events to the number of background events (and its statistical uncertainty) is also shown. The hashed bands represent all sources of statistical and systematic uncertainty on the background prediction.
are used to correct for pile-up effects. They are derived as a function of the number of primary vertices in the event to take into account additional pp collisions in a recorded event (in-time pile-up), or as a function of the expected number of interactions per bunch-crossing to constrain past and future collisions affecting the measurement of energies in the current bunch-crossing (out-of-time pile-up). An additional uncertainty on the jet energy resolution (JER) is taken into account. The relative impact on the background event yields from the JES (JER) uncertainty is between 8% (1%) in SR1 and 26% (1%) in SR8. The signal selection efficiency change due to the JES uncertainties ranges between 3% in SR1 and 1% in SR8, while the effect of the JER is negligible.
The electron energy scale and resolution are corrected to provide better agreement between MC predictions and data. The uncertainties on these corrections are propagated through the analysis as sources of systematic uncertainty. Uncertainties are taken into account for the electron trig-ger (∼ 0.1%), identification (∼ 1%) and reconstruction (∼ 1%) efficiencies, and for uncertainties associated with the isolation requirements (∼ 0.1%).
Scaling and smearing corrections are applied to the pTof the muons in order to minimise the
differ-ences in resolution between data and MC simulated events. The uncertainty on these corrections is below 1%. Differences in the identification efficiency and in the efficiency of the trigger selection are taken into account and are less than 1%.
QCD renormalisation and factorisation scales are varied by a factor of two to estimate the impact of higher orders on the signal production cross-section. The variation is found to be approximately 14% for all mass points. The uncertainty on the signal cross-section related to the choice of PDF set is evaluated as the envelope of the prediction of 40 different CTEQ6.6 NLO error sets [24]. The uncertainty ranges from 18% at mLQ= 300 GeV to 56% at mLQ= 1300 GeV. These uncertainties are
the same for all LQ generations. The effect on the choice of PDF set on the signal acceptance times reconstruction efficiency is estimated using the Hessian method [59]. The final PDF uncertainties on the signal samples are approximately 1% for most mass points, rising to 4% for some higher LQ masses. The impact of the choice of PDF set on the acceptance times reconstruction efficiency for each background process is estimated using the Hessian method (using the same method as for signals). The uncertainties range from 4% in the low-mass signal regions to 17% in the high-mass signal regions.
4.7 Results
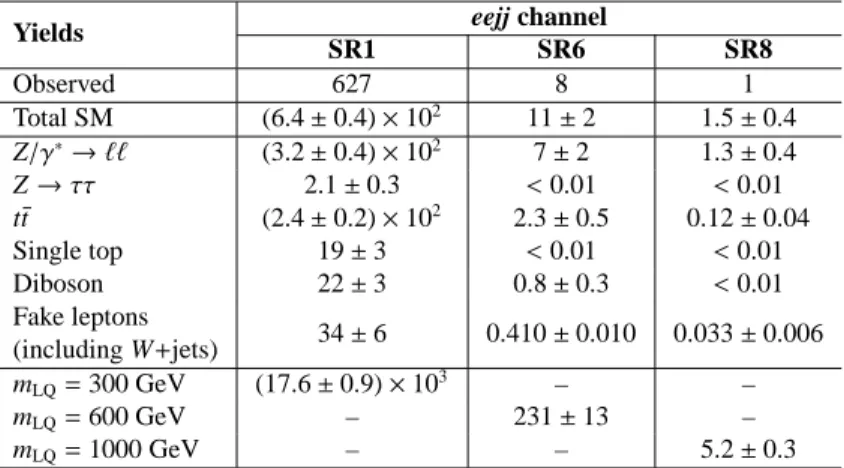
The observed and expected yields in three representative signal regions for the eejj and the µµjj channels after the combined maximum likelihood fits are shown in Table2and Table3, respect-ively. The fit maximizes the likelihood constructed using the two CRs and the SR under study. When contructing the likelihood, the signal stregth and the background scale factors are treated as free parameters, the systematic uncertainties are treated as nuisance parameters.
Yields eejj channel SR1 SR6 SR8 Observed 627 8 1 Total SM (6.4 ± 0.4) × 102 11 ± 2 1.5 ± 0.4 Z/γ∗→ ℓℓ (3.2 ± 0.4) × 102 7 ± 2 1.3 ± 0.4 Z → ττ 2.1 ± 0.3 < 0.01 < 0.01 t¯t (2.4 ± 0.2) × 102 2.3 ± 0.5 0.12 ± 0.04 Single top 19 ± 3 < 0.01 < 0.01 Diboson 22 ± 3 0.8 ± 0.3 < 0.01 Fake leptons (including W+jets) 34 ± 6 0.410 ± 0.010 0.033 ± 0.006 mLQ= 300 GeV (17.6 ± 0.9) × 103 – – mLQ= 600 GeV – 231 ± 13 – mLQ= 1000 GeV – – 5.2 ± 0.3
Table 2: Background and signal yields in three representative signal regions for LQs with masses mLQ= 300,
600 and 1000 GeV for the eejj channel (assuming β = 1.0). The observed number of events is also shown. Statistical and systematic uncertainties are given.
Yields µµjj channel SR1 SR6 SR8 Observed 426 5 1 Total SM (4.1 ± 0.3) × 102 7.0 ± 1.2 1.3 ± 0.4 Z/γ∗→ ℓℓ 209 ± 18 4.6 ± 1.0 0.9 ± 0.3 Z → ττ 0.9 ± 0.1 < 0.01 < 0.01 t¯t 172 ± 18 1.7 ± 0.6 0.18 ± 0.11 Single top 14 ± 5 0.3 ± 0.4 < 0.01 Diboson 14 ± 2 0.5 ± 0.2 0.19 ± 0.05 Fake leptons (including W+jets) < 0.01 < 0.01 < 0.01 mLQ= 300 GeV (12.0 ± 0.6) × 103 – – mLQ= 600 GeV – 152 ± 18 – mLQ= 1000 GeV – – 3.4 ± 1.3
Table 3: Background and signal yields in three representative signal regions for LQs with masses mLQ= 300,
600 and 1000 GeV for the µµjj channel (assuming β = 1.0). The observed number of events is also shown. Statistical and systematic uncertainties are given.
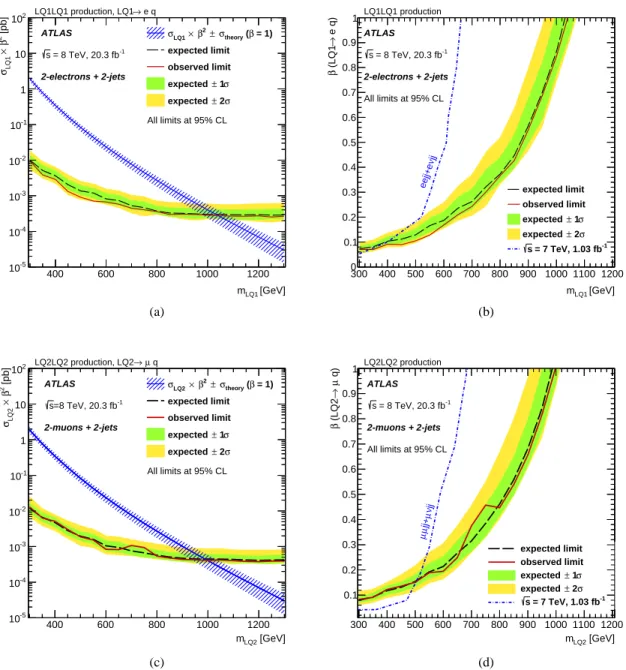
No significant excess above the SM expectation is observed in any of the signal regions and a modified frequentist CLs method [60] is used to set limits on the strength of the LQ signal, by
constructing a profile likelihood ratio. Pseudo-experiments are used to determine the limits. The cross-section limits on scalar LQ pair-production are presented as a function of β for both chan-nels in Fig.4. Also shown are the results of the ATLAS searches for first- and second-generation LQs using 1.03 fb−1 data at √s= 7 TeV which also included searches in the eνjj and µνjj de-cay channels and therefore provide better sensitivity at low values of β. First (second)-generation scalar LQs are excluded for β = 1 at 95% CL for mLQ1 < 1050 GeV (mLQ2 < 1000 GeV). The
expected exclusion ranges are the same as the observed ones. First (second)-generation scalar LQs are excluded for mLQ1 < 650 GeV (mLQ2 < 650 GeV) at β = 0.2 and mLQ1 < 900 GeV
(mLQ2< 850 GeV) at β = 0.5.
5 Search for third-generation LQs in the bν
τ¯b ¯
ν
τchannel
The ATLAS search for pair-production of third-generation supersymmetric partners of bottom quarks (sbottom, ˜b) [18] is reinterpreted in terms of the LQ model, in the case where each LQ decays to a b-quark and a ντ neutrino. In the original analysis, the ˜b is assumed to decay via
˜b→ b˜χ0
, and ˜t via ˜t→ b ˜χ± in the case where mχ˜± − m ˜
χ0 is small and the ˜χ±decay products are undetectable. The search is performed for final states with large missing transverse momentum (~pmissT , with magnitude ETmiss) and two jets identified as originating from b-quarks. The full ana-lysis strategy is covered in Ref. [18]. A complete description of the anaana-lysis, including treatment of systematic uncertainties on background processes can be found there, but the event selection and background estimation methods used are summarised here for clarity.
5.1 Object and event selection
Events are required to have exactly two b-tagged [61] jets with pT> 20 GeV and |η| < 2.5, and ETmiss
> 150 GeV. Additional jets in the event are accepted if they have pT> 20 GeV and |η| < 4.9. Events
with one or more electrons (muons) with pT > 7 (6) GeV are vetoed. Candidate signal events
are selected from data using a ETmiss trigger which is 99% efficient for events passing the offline selection. Several variables are defined and used to optimise the event selection:
– ∆φmin: The minimum azimuthal distance (∆φ) between any of the leading three jets and the
~pmiss T .
– meff: The scalar sum of the pT of the leading two or three jets (depending on the signal
region) and the ETmiss.
[GeV] LQ1 m 400 600 800 1000 1200 [pb] 2β × LQ1 σ -5 10 -4 10 -3 10 -2 10 -1 10 1 10 2 10 ATLAS -1 = 8 TeV, 20.3 fb s 2-electrons + 2-jets All limits at 95% CL e q → LQ1LQ1 production, LQ1 = 1) β ( theory σ ± 2 β × LQ1 σ expected limit observed limit σ 1 ± expected σ 2 ± expected (a) [GeV] LQ1 m 300 400 500 600 700 800 900 1000 1100 1200 e q) → (LQ1 β 0 0.1 0.2 0.3 0.4 0.5 0.6 0.7 0.8 0.9 1 ATLAS -1 = 8 TeV, 20.3 fb s 2-electrons + 2-jets All limits at 95% CL jj ν eejj+e LQ1LQ1 production expected limit observed limit σ 1 ± expected σ 2 ± expected -1 = 7 TeV, 1.03 fb s (b) [GeV] LQ2 m 400 600 800 1000 1200 [pb] 2β × LQ2 σ -5 10 -4 10 -3 10 -2 10 -1 10 1 10 2 10 ATLAS -1 =8 TeV, 20.3 fb s 2-muons + 2-jets All limits at 95% CL q µ → LQ2LQ2 production, LQ2 = 1) β ( theory σ ± 2 β × LQ2 σ expected limit observed limit σ 1 ± expected σ 2 ± expected (c) [GeV] LQ2 m 300 400 500 600 700 800 900 1000 1100 1200 q) µ → (LQ2 β 0.1 0.2 0.3 0.4 0.5 0.6 0.7 0.8 0.9 1 LQ2LQ2 production ATLAS -1 = 8 TeV, 20.3 fb s 2-muons + 2-jets All limits at 95% CL jj νµ jj+ µµ expected limit observed limit σ 1 ± expected σ 2 ± expected -1 = 7 TeV, 1.03 fb s (d)
Figure 4: The cross-section limits on scalar LQ pair-production times the square of the branching ratio as a function of mass (left) and the excluded branching ratio as a function of the LQ mass (right) to eq for the eejj channel (top) and to µq for the µµjj channel (bottom). The ±1(2)σ uncertainty bands on the expected limit represent all sources of systematic and statistical uncertainty. The expected NLO production cross-section (β = 1.0) for scalar LQ pair-production and its corresponding theoretical uncertainty due to the choice of PDF set and renormalisation/factorisation scale are also included. The exclusion limits on LQ1 [12] and LQ2 [13] set by ATLAS in the eejj +eνjj and µµjj +µνjj search channels using 1.03 fb−1of data collected at
√
– mbb: The invariant mass of the two b-tagged jets in the event.
– mCT: The contransverse mass [62], used to measure the masses of pair-produced heavy
particles that decay semi-invisibly (i.e. decays where one of the decay products can be detected, but the other cannot).
In the original analysis, different signal regions were optimised according to the masses of the third-generation squark and the lightest supersymmetric particle (LSP). In the case of the LQ model reinterpretation the signal regions corresponding to the case where the mass of the LSP is approximately zero have best sensitivity, but all the signal regions are retained for coherence with the original analysis. The different signal region definitions are given in Table4. Signal re-gion A (SRA) has five different mCTthresholds. Signal region B (SRB) is optimised towards the
region where the squark and LSP masses are approximately equal. The signal region with the best expected limit is used for each point in the exclusion plots.
5.2 Background estimation
The dominant background process is the production of Z bosons in association with heavy-flavour jets where the Z boson subsequently decays to two neutrinos (Z(→ νν) + b¯b). Its contribution is estimated from data in an opposite-sign dilepton control region. Top quark pair-production (t¯t) and W bosons produced in association with heavy flavour quarks also contribute significantly and are normalised in dedicated control regions before being extrapolated to the signal regions using MC simulation. Different control regions are defined for each signal region, requiring one or two leptons plus additional requirements similar to the corresponding signal region. The contributions from Z+jets, W+jets, and top quark production are estimated simultaneously with a profile likeli-hood fit to the three control regions. Contributions from diboson and t¯t+W/Z processes are estim-ated from MC simulation in all regions. The contribution from multi-jet events is estimestim-ated from data by taking well-measured multi-jet events from data and smearing the jets with jet response functions taken from MC simulation and validated in data. This procedure is described in detail in Ref. [63]. The contribution from multi-jet events in signal regions is found to be negligible.
5.3 Results
The number of data events observed in each signal region is reported in Table5, together with the SM background expectation after the background-only fit, and the expected number of signal events for different LQ masses. The signal acceptance efficiency is around 2% for all but the lowest LQ masses targeted (dropping to 0.27% efficiency for mLQ= 200 GeV). All sources of systematic
and statistical uncertainty are taken into account. The dominant systematic uncertainties on the background prediction are the jet energy scale (JES: 1–5%) and resolution (JER: 1–8%), and the b-tagging uncertainty (2–10%). Detector-related systematic uncertainties on the signal prediction
Description Signal Regions
SRA SRB
Event cleaning Common to all SR
Lepton veto No e/µ after overlap removal with pT> 7(6) GeV for e(µ)
Emiss
T > 150 GeV > 250 GeV
Leading jet pT > 130 GeV > 150 GeV
Second jet pT > 50 GeV > 30 GeV
Third jet pT veto if > 50 GeV > 30 GeV
∆φ(~pmiss
T , lead jet) - > 2.5
b-tagging leading 2 jets 2nd- and 3rd-leading jets
(pT> 50 GeV, |η| < 2.5) (pT> 30 GeV,|η| < 2.5) nb-jets= 2 ∆φmin > 0.4 > 0.4 Emiss T /meff (meff = EmissT + p j1 T + p j2 T) Emiss T /meff> 0.25 – Emiss T /meff (meff = EmissT + p j1 T + p j2 T + p j3 T) – Emiss T /meff> 0.25 mCT > 150, 200, 250, 300, 350 GeV -HT,3 - < 50 GeV mbb > 200 GeV
SRA, mCT> SRB
150 GeV 200 GeV 250 GeV 300 GeV 350 GeV
Observed 102 48 14 7 3 65 Total SM 94 ± 13 39 ± 6 16 ± 3 5.9 ± 1.1 2.5 ± 0.6 64 ± 10 Top quark 11.1 ± 1.8 2.4 ± 1.4 0.4 ± 0.3 < 0.01 < 0.01 41 ± 7 Z production 66 ± 11 28 ± 5 11 ± 2 4.7 ± 0.9 1.9 ± 0.4 13 ± 4 W production 13 ± 6 5 ± 3 2.1 ± 1.1 1.0 ± 0.5 0.5 ± 0.3 8 ± 5 Others 4.3 ± 1.5 3.4 ± 1.3 1.8 ± 0.6 0.12 ± 0.11 0.10+0.12 −0.10 2.0 ± 1.0 Multi-jet 0.2 ± 0.2 0.06 ± 0.06 0.02 ± 0.02 < 0.01 < 0.01 0.16 ± 0.16 mLQ= 300 GeV (8.5 ± 0.2) × 102 435 ± 17 96 ± 8 7 ± 2 0.6 ± 0.6 68 ± 7 mLQ= 600 GeV 21.9 ± 0.4 19.0 ± 0.4 15.6 ± 0.4 12.0 ± 0.3 8.7 ± 0.3 1.8 ± 0.1
Table 5: For each signal region in the bντ¯b ¯ντchannel, the observed event yield is compared with the back-ground prediction obtained from the fit. Signal yields for different values of mLQ(assuming β = 0.0) are given
for comparison. The category ‘Others’ includes the diboson and t¯t+W/Z processes. Statistical, detector-related and theoretical systematic uncertainties are included, taking into account correlations [18].
are dominated by uncertainties on the b-tagging efficiency (∼30%). The second-largest source of uncertainty is due to the JES and is around 3%.
The uncertainties on the signal production cross-section are estimated using the methods described in Section4.6. These uncertainties are the same for all LQ genertions but the uncertainty due to the choice of PDF set varies with mLQ. Since the third-generation analyses consider a different mass
range to the first- and second-generation analyses, in this case the uncertainty due to the choice of PDF set ranges from 7.1% at mLQ= 200 GeV to 30% at mLQ= 800 GeV. Effects on the acceptance
due to the choice of PDF set are negligible.
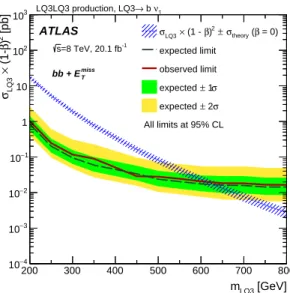
No significant excess above the SM expectation is observed in any of the signal regions. Figure5 shows the observed and expected exclusion limits for the scalar LQ3 pair-production scenario ob-tained by taking, for each signal mass configuration, the signal region with the best expected limit. These limits are obtained using the methods described in Section4.7. These methods compare the observed numbers of events in the signal regions with the fitted background expectation and accounting for signal contamination in the corresponding CRs for a given model. Pair-produced third-generation scalar LQs decaying to bντ¯b ¯ντare excluded at 95% CL for mLQ3< 625 GeV. The
expected excluded range is mLQ3< 640 GeV.
6 Search for third-generation LQs in the tν
τ¯t ¯
ν
τchannel
The ATLAS search for pair-production of the supersymmetric partner of the top quark (stop quark, ˜t) [19] is reinterpreted in terms of the LQ model, in the case where each LQ decays to a top quark and a ντneutrino. The original analysis has dedicated signal regions targeting ˜t decays into t ˜χ0and
the subsequent semileptonic decay of the t¯t pair. Events compatible with t¯t plus extra EmissT are se-lected with final states containing one isolated lepton, jets, and ETmiss. A complete description of the
[GeV] LQ3 m 200 300 400 500 600 700 800 [pb] 2) β (1-× LQ3 σ 4 − 10 3 − 10 2 − 10 1 − 10 1 10 2 10 3 10 LQ3LQ3 production, LQ3→ b ντ ATLAS All limits at 95% CL T miss bb + E = 0) β ( theory σ ± 2 ) β (1 - × LQ3 σ expected limit observed limit σ 1 ± expected σ 2 ± expected -1 =8 TeV, 20.1 fb s
Figure 5: The expected (dashed) and observed (solid) 95% CL upper limits on third-generation scalar LQ pair-production cross-section times the square of the branching ratio to bντas a function of LQ mass, for the
bντ¯b ¯ντchannel. The ±1(2)σ uncertainty bands on the expected limit represent all sources of systematic and statistical uncertainty. The expected NLO production cross-section (β = 0.0) for scalar LQ pair-production and its corresponding theoretical uncertainty due to the choice of PDF set and renormalisation/factorisation scale are also included.
analysis strategy, including the treatment of systematic uncertainties on background processes can be found in Ref. [19]. The event selection and the background estimation methods are summarised here for clarity.
6.1 Object and event selection
Events are required to contain exactly one electron with pT > 25 GeV and |η| < 2.47, or muon
with pT > 25 GeV and |η| < 2.4. Events containing more than one electron or muon with looser
identification and pTrequirements (10 GeV for both) are vetoed. In some signal regions, events are
vetoed if they are consistent with containing a hadronically decaying τ lepton. Events are required to have a minimum of four jets with pT> 20 GeV and |η| < 2.5, with at least one of these passing
b-tagging requirements [61]. In addition, selected events must have EmissT > 100 GeV. Several variables are used to further select signal events and reject background processes:
– mT: The transverse mass of the electron or muon and the EmissT .
– amT and mτT,2: These are two variants on the stransverse mass (mT,2) [64–66] which is a
generalisation of the transverse mass when applied to signatures with two invisible particles in the final state. The asymmetric stransverse mass amT, aims to reject dileptonic t¯t events
where one of the leptons is not reconstructed or is outside the acceptance (and therefore adds to the EmissT of the event). The second implementation of this variable, the τ stransverse mass mτT,2, targets t¯t events where one top decays leptonically and the other top decays into a τ that subsequently decays hadronically.
– topness: This variable is designed to reject dileptonic t¯t events where one lepton is assumed to be lost, as detailed in Ref. [67]. The topness variable is based on the minimisation of a χ2-type function.
– mhad−top: This quantity is used to reject dileptonic t¯t events but retain signal events that con-tain a hadronically decaying on-shell top quark, as in the LQ → t+ντand ˜t1→ t ˜χ01scenarios.
– ∆φ(jet1,2, ~pmiss
T ): The azimuthal opening angle between the leading or sub-leading jet and
~pmiss
T used to suppress multi-jet events where ~p miss
T is aligned with one of the leading two
jets.
– ETmiss/√HT: An approximation of the EmissT significance, where HT is defined as the scalar
pTsum of the leading four jets.
– HT,sigmiss: An object-based missing transverse momentum, divided by the per-event resolution of the jets, and shifted to the scale of the background [68].
The variables listed above are used to define three cut-and-count SRs and one shape-fit SR. Table6 de-tails the event selections for these signal regions. The SR labelled tN_boost targets LQ/stop masses of &700 GeV and takes advantage of the ‘boosted’ topology of such a heavy parent particle. The selection assumes that either all decay products of the hadronically decaying top quark, or at least the decay products of the hadronically decaying W boson, collimate into a jet reconstructed with a radius parameter R = 1.0 [69,70].
6.2 Background estimation
The dominant sources of background are the production of t¯t events and W+jets where the W boson decays leptonically. Other background processes considered are single top, dibosons, Z+jets, t¯t produced in association with a vector boson (t¯tV), and multi-jets.
The predicted numbers of t¯t and W+jets background events in the SRs are estimated from data using a fit to the number of observed events in dedicated control regions. Each SR has an associated CR for each of the t¯t and W+jets backgrounds. The CRs are designed to select events as similar as possible to those selected by the corresponding SR while keeping the contamination from other backgrounds and potential signal low. This is achieved by e.g. requiring that 60 < mT < 90
GeV and in the case of the W+jets CR, inverting the b-jet requirement so that it becomes a b-jet veto. The simulation is used to extrapolate the background predictions into the signal region. The background fit predictions are validated using dedicated event samples, referred to as validation regions (VRs), and one or more VR is defined for each of these. Most VRs are defined by changing the mT windows to 90 < mT < 120 GeV. The VRs are designed to be kinematically close to the
associated SRs to test the background estimates in regions of phase space as similar as possible to the SRs.
The multi-jet background is estimated from data using a matrix method described in Refs. [71,72]. The contribution is found to be negligible. All other (small) backgrounds are determined entirely from simulation and normalised to the most accurate theoretical cross-sections available.
6.3 Results
The number of events observed in each signal region is reported in Tables7and8, together with the SM background expectation and the expected number of signal events for different LQ masses. The signal acceptance is between 1.5% and 3% depending on the LQ mass. All sources of systematic uncertainty and statistical uncertainty are taken into account. The dominant sources of uncertainty on the background prediction come from uncertainties related to the JES, JER, t¯t background mod-elling, the b-tagging efficiency, and statistical uncertainties.
tN_diag tN_med tN_high tN_boost
Lepton = 1 lepton
Jets ≥ 4 with pT> ≥ 4 with pT> ≥ 4 with pT> ≥ 4 with pT>
60, 60, 40, 25 GeV 80, 60, 40, 25 GeV 100, 80, 40, 25 GeV 75, 65, 40, 25 GeV
b-tagging ≥ 1b-tag (70% eff.) amongst four selected jets
Large-R jet – ≥ 1, pT> 270 GeV
and m > 75 GeV
∆φ(jetlargeR2 , ~pmiss
T ) – > 0.85
Emiss
T > 100 GeV > 200 GeV > 320 GeV > 315 GeV
mT > 60 GeV > 140 GeV > 200 GeV > 175 GeV
amT – > 170 GeV > 170 GeV > 145 GeV
mτ
T,2 – – > 120 GeV –
Topness – – – > 7
mhad−top ∈ [130, 205] GeV ∈ [130, 195] GeV ∈ [130, 250] GeV
τ-veto loose τ particle ID – – modified, see [19].
∆R(b−jet, ℓ) < 2.5 – < 3 < 2.6 Emiss T / √ HT > 5 GeV1/2 – Hmiss T,sig – > 12.5 > 10 ∆φ(jeti, ~pmissT ) > 0.8(i = 1, 2) > 0.8(i = 2) – > 0.5, 0.3(i = 1, 2)
Exclusion setup shape-fit in mTand cut-and-count
Emiss T .
Table 6: Selection criteria for the four SRs (tN_diag, tN_med, tN_high, and tN_boost) employed to search for LQ3 LQ3 → tντ¯t ¯ντevents [19]. The details of the limit-setting procedure for the exclusion setup can be found in Section6.3.
tN_med tN_high tN_boost Observed 12 5 5 Total SM 13 ± 2 5.0 ± 0.9 3.3 ± 0.7 t¯t 6.5 ± 1.7 2.0 ± 0.6 1.1 ± 0.4 W+jets 2.1 ± 0.5 0.9 ± 0.3 0.28 ± 0.14 Single top 1.1 ± 0.5 0.54 ± 0.19 0.39 ± 0.15 Diboson 1.4 ± 0.6 0.9 ± 0.3 0.7 ± 0.3 Z+jets 0.009 ± 0.005 0.003 ± 0.002 0.004 ± 0.002 t¯tV 2.0 ± 0.6 0.8 ± 0.3 0.9 ± 0.3 mLQ= 300 GeV 20 ± 3 3.4 ± 1.1 3.8 ± 1.2 mLQ= 600 GeV 10.7 ± 0.3 7.9 ± 0.3 8.9 ± 0.3
Table 7: The number of observed events in the three cut-and-count signal regions, together with the expected number of background events and signal events for different LQ masses (assuming β = 0.0) in the tντ¯t ¯ντ channel [19].
Detector-related systematic effects are evaluated for signal using the same methods used for the backgrounds (see Ref. [19] for details). The dominant detector-related systematic effects are the uncertainties on the JES (4%) and the b-tagging efficiency (3%).
The uncertainties on the signal production cross-section are estimated using the methods described in Section4.6. The effect on the choice of PDF set on the signal acceptance is less than 1% for most mass points, but increases to 1.7% for mLQ= 800 GeV.
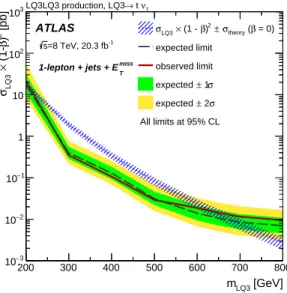
Similar methods as described in Section4.7are used to assess the compatibility of the SM background-only hypothesis with the observations in the signal regions. The observed number of events is found to agree well with the expected number of background events in all signal regions. No significant excess over the expected background from SM processes is observed and the data are used to derive one-sided limits at 95% CL. The results are obtained from a profile likelihood-ratio test following the CLsprescription [60]. The likelihood of the simultaneous fit is configured to include all CRs
and one SR or shape-fit bin. The ‘exclusion setup’ event selection is applied (see Table6), and all uncertainties except the theoretical signal uncertainty are included in the fit.
Exclusion limits are obtained by selecting a priori the signal region with the lowest expected CLs
value for each signal grid point. The expected and observed limits on the LQ3 LQ3 → tντ¯t ¯ντ
pro-cess are shown in Fig.6. Third-generation scalar LQs decaying to tντ¯t ¯ντare excluded at 95% CL
in the mass range 210 < mLQ3< 640 GeV. The expected exclusion range is 200 < mLQ3< 685 GeV.
The limits for stop production in the case where the neutralino is massless are slightly stronger than the limits set on LQ3 production since the nominal stop limits consider a mostly right-handed stop. This leads to the top quarks being polarised in such a way that the acceptance increases. The limit worsens at low mass, due to the effect of greater contamination from top backgrounds.
[GeV] LQ3 m 200 300 400 500 600 700 800 [pb] 2) β (1-× LQ3 σ 3 − 10 2 − 10 1 − 10 1 10 2 10 3 10 LQ3LQ3 production, LQ3→ t ντ ATLAS All limits at 95% CL T miss 1-lepton + jets + E = 0) β ( theory σ ± 2 ) β (1 - × LQ3 σ expected limit observed limit σ 1 ± expected σ 2 ± expected -1 =8 TeV, 20.3 fb s
Figure 6: The expected (dashed) and observed (solid) 95% CL upper limits on the third-generation scalar LQ pair-production cross-section times the square of the branching ratio to tντ as a function of LQ mass, for the tντ¯t ¯ντchannel. The ±1(2)σ uncertainty bands on the expected limit represent all sources of system-atic and statistical uncertainty. The expected NLO production cross-section (β = 0.0) for third-generation scalar LQ pair-production and its corresponding theoretical uncertainty due to the choice of PDF set and renormalisation/factorisation scale are also included.
tN_diag 125 < Emiss T < 150 GeV 125 < E miss T < 150 GeV E miss T > 150 GeV E miss T > 150 GeV
120 < mT< 140 GeV mT> 140 GeV 120 < mT< 140 GeV mT> 140 GeV
Observed 117 163 101 217 Total SM (1.4 ± 0.2) × 102 (1.5 ± 0.2) × 102 98 ± 13 (2.4 ± 0.3) × 102 t¯t (1.2 ± 0.2) × 102 (1.4 ± 0.2) × 102 85 ± 12 (2.0 ± 0.3) × 102 W+jets 7 ± 3 6 ± 3 4.6 ± 1.5 10 ± 4 Single top 5 ± 2 6 ± 2 6± 2 9 ± 4 Diboson 0.29 ± 0.18 0.8 ± 0.5 0.3 ± 0.3 0.30 ± 0.15 Z+jets 0.17 ± 0.08 0.24 ± 0.12 0.30 ± 0.15 0.5 ± 0.3 t¯tV 1.5 ± 0.5 2.9 ± 0.9 2.5 ± 0.8 11 ± 3 mLQ= 300 GeV 28 ± 3 77 ± 6 64 ± 5 269 ± 10 mLQ= 600 GeV 0.15 ± 0.04 0.62 ± 0.08 0.83 ± 0.09 18.8 ± 0.4
Table 8: The number of observed events in the shape-fit signal region, together with the expected number of background events and signal events for different LQ masses (assuming β = 0.0) in the tντ¯t ¯ντchannel [19].
7 Summary and conclusions
Searches for pair-production of first-, second- and third-generation scalar leptoquarks have been performed with the ATLAS detector at the LHC using an integrated luminosity of 20 fb−1of data from pp collisions at √s = 8 TeV. No significant excess above the SM background expectation is observed in any channel. The results are summarised in Table9.
Decay channel Excluded range (95% CL)
Expected Observed
eejj (β = 1.0) mLQ1< 1050 GeV mLQ1< 1050 GeV
µµjj (β = 1.0) mLQ2< 1000 GeV mLQ2< 1000 GeV
bντ¯b ¯ντ(β = 0.0) mLQ3< 640 GeV mLQ3< 625 GeV
tντ¯t ¯ντ(β = 0.0) 200 < mLQ3< 685 GeV 210 < mLQ3< 640 GeV
Table 9: Expected and observed exclusion ranges at 95% CL for each of the four LQ decay channels con-sidered.
The results presented here significantly extend the sensitivity in mass compared to previous searches. Low-mass regions are also considered and limits on the cross-sections are provided for the different final states analysed. Since β is not constrained by the theory, searches in the low mass regions are also important in order to extract limits for low-β values for the LQ1 and LQ2 analyses.
Acknowledgements
We thank CERN for the very successful operation of the LHC, as well as the support staff from our institutions without whom ATLAS could not be operated efficiently.
We acknowledge the support of ANPCyT, Argentina; YerPhI, Armenia; ARC, Australia; BMWFW and FWF, Austria; ANAS, Azerbaijan; SSTC, Belarus; CNPq and FAPESP, Brazil; NSERC, NRC and CFI, Canada; CERN; CONICYT, Chile; CAS, MOST and NSFC, China; COLCIENCIAS, Colombia; MSMT CR, MPO CR and VSC CR, Czech Republic; DNRF, DNSRC and Lundbeck Foundation, Denmark; IN2P3-CNRS, CEA-DSM/IRFU, France; GNSF, Georgia; BMBF, HGF, and MPG, Germany; GSRT, Greece; RGC, Hong Kong SAR, China; ISF, I-CORE and Benoziyo Center, Israel; INFN, Italy; MEXT and JSPS, Japan; CNRST, Morocco; FOM and NWO, Neth-erlands; RCN, Norway; MNiSW and NCN, Poland; FCT, Portugal; MNE/IFA, Romania; MES of Russia and NRC KI, Russian Federation; JINR; MESTD, Serbia; MSSR, Slovakia; ARRS and MIZŠ, Slovenia; DST/NRF, South Africa; MINECO, Spain; SRC and Wallenberg Foundation, Sweden; SERI, SNSF and Cantons of Bern and Geneva, Switzerland; MOST, Taiwan; TAEK, Tur-key; STFC, United Kingdom; DOE and NSF, United States of America. In addition, individual groups and members have received support from BCKDF, the Canada Council, CANARIE, CRC, Compute Canada, FQRNT, and the Ontario Innovation Trust, Canada; EPLANET, ERC, FP7, Hori-zon 2020 and Marie Skłodowska-Curie Actions, European Union; Investissements d’Avenir Labex and Idex, ANR, Region Auvergne and Fondation Partager le Savoir, France; DFG and AvH Found-ation, Germany; Herakleitos, Thales and Aristeia programmes co-financed by EU-ESF and the Greek NSRF; BSF, GIF and Minerva, Israel; BRF, Norway; the Royal Society and Leverhulme Trust, United Kingdom.
The crucial computing support from all WLCG partners is acknowledged gratefully, in particu-lar from CERN and the ATLAS Tier-1 facilities at TRIUMF (Canada), NDGF (Denmark, Nor-way, Sweden), CC-IN2P3 (France), KIT/GridKA (Germany), INFN-CNAF (Italy), NL-T1 (Neth-erlands), PIC (Spain), ASGC (Taiwan), RAL (UK) and BNL (USA) and in the Tier-2 facilities worldwide.
References
[1] S. K. Dimopoulos and L. Susskind,Nucl.Phys. B155 no. 1, (1979) 237–252.
[2] S. Dimopoulos,Nucl.Phys. B168 (1980) 69–92.
[3] E. J. Eichten and K. Lane, Phys.Lett. B90 no. 1,2, (1980) 125–130.
[4] V. D. Angelopoulos, J. R. Ellis, H. Kowalski, et al.,Nucl.Phys. B292 (1986) 59–92. [5] W. Buchmüller and D. Wyler,Phys.Lett. B177 (1986) 377–382.
[6] J. C. Pati and A. Salam,Phys.Rev. D10 (1974) 275–289. Erratum ibid. D11.703, 1975. [7] H. Georgi and S. Glashow,Phys. Rev. Lett. 32 (1974) 438–441.
[8] B. Schrempp and F. Schrempp,Phys.Lett. B153 (1985) 101.
[9] J. L. Hewett and T. G. Rizzo,Phys.Rev. D56 (1997) 5709–5724,arXiv:hep-ph/9703337
[hep-ph].
[10] W. Buchmüller, R. Rückl, and D. Wyler,Phys.Lett. B191 (1987) 442–448. Erratum ibid. B448:320, 1999.
[11] V. A. Mitsou, N. C. Benekos, I. Panagoulias, and T. Papadopoulou, Czech.J.Phys. 55 (2005)
B659–B666,arXiv:hep-ph/0411189 [hep-ph].
[12] ATLAS Collaboration,Phys.Lett. B709 (2012) 158–176,arXiv:1112.4828 [hep-ex].
Erratum ibid. B711:442-455, 2012.
[13] ATLAS Collaboration,Eur.Phys.J. C72 (2012) 2151,arXiv:1203.3172 [hep-ex].
[14] CMS Collaboration,Phys.Rev. D86 (2012) 052013,arXiv:1207.5406 [hep-ex].
[15] CMS Collaboration,JHEP 07 (2015) 042,arXiv:1503.09049 [hep-ex].
[16] CMS Collaboration,Phys.Lett. B739 (2014) 229,arXiv:1408.0806 [hep-ex].
[17] ATLAS Collaboration,JHEP 1306 (2013) 033,arXiv:1303.0526 [hep-ex].
[18] ATLAS Collaboration,JHEP 1310 (2013) 189,arXiv:1308.2631 [hep-ex].
[19] ATLAS Collaboration,JHEP 1411 (2014) 118,arXiv:1407.0583 [hep-ex].
[20] ATLAS Collaboration,JINST 3 (2008) S08003.
[21] T. Sjöstrand, S. Mrenna, and P. Z. Skands,Comput.Phys.Commun. 178 (2008) 852–867,
arXiv:0710.3820 [hep-ph].
[22] J. Pumplin et al.,JHEP 0207 (2002) 012,arXiv:hep-ph/0201195 [hep-ph].
[23] A. Belyaev, C. Leroy, R. Mehdiyev, and A. Pukhov,JHEP 0509 (2005) 005,
arXiv:hep-ph/0502067 [hep-ph].
[24] M. Kramer, T. Plehn, M. Spira, and P. Zerwas,Phys.Rev. D71 (2005) 057503,
arXiv:hep-ph/0411038 [hep-ph].
[25] T. Gleisberg et al.,JHEP 0902 (2009) 007,arXiv:0811.4622 [hep-ph].
[26] P. Nason,JHEP 0411 (2004) 040,arXiv:hep-ph/0409146 [hep-ph].
[27] S. Frixione, P. Nason, and C. Oleari,JHEP 0711 (2007) 070,arXiv:0709.2092 [hep-ph].
[28] G. Corcella et al.,JHEP 0101 (2001) 010,arXiv:hep-ph/0011363 [hep-ph]. [29] ATLAS Collaboration, tech. rep., 2011. ATL-PHYS-PUB-2011-008,
https://cdsweb.cern.ch/record/1345343.
[30] S. Frixione, E. Laenen, P. Motylinski, and B. R. Webber,JHEP 0603 (2006) 092,
arXiv:hep-ph/0512250 [hep-ph].
[31] S. Frixione, E. Laenen, P. Motylinski, B. R. Webber, and C. D. White,JHEP 0807 (2008)
029,arXiv:0805.3067 [hep-ph].
[32] B. P. Kersevan and E. Richter-Was,Comput.Phys.Commun. 184 (2013) 919–985,
arXiv:hep-ph/0405247 [hep-ph].
[33] ATLAS Collaboration, tech. rep., 2011. ATL-PHYS-PUB-2011-014, https://cds.cern.ch/record/1400677.
[34] J. Butterworth, J. R. Forshaw, and M. Seymour,Z.Phys. C72 (1996) 637–646,
arXiv:hep-ph/9601371 [hep-ph].
[35] H.-L. Lai et al.,Phys.Rev. D82 (2010) 074024,arXiv:1007.2241 [hep-ph].
[36] ATLAS Collaboration,Eur. Phys. J C70 (2010) 823–874. 53 p,arXiv:1005.4568
[physics.ins-det].
[37] S. Agostinelli et al.,Nucl.Instrum.Meth. A506 (2003) 250–303.
[38] N. Kidonakis,Phys.Rev. D81 (2010) 054028,arXiv:1001.5034 [hep-ph].
[39] N. Kidonakis,Phys.Rev. D83 (2011) 091503,arXiv:1103.2792 [hep-ph].
[40] N. Kidonakis,Phys.Rev. D82 (2010) 054018,arXiv:1005.4451 [hep-ph].
[41] S. Catani, L. Cieri, G. Ferrera, D. de Florian, and M. Grazzini,Phys.Rev.Lett. 103 (2009)
082001,arXiv:0903.2120 [hep-ph].
[42] J. M. Campbell, R. K. Ellis, and C. Williams,JHEP 1107 (2011) 018,arXiv:1105.0020 [hep-ph].
[43] J. M. Campbell and R. K. Ellis,Phys.Rev. D60 (1999) 113006,arXiv:hep-ph/9905386
[hep-ph].
[44] ATLAS Collaboration,Phys.Rev. D87 no. 11, (2013) 112001,arXiv:1210.2979
[hep-ex].
[45] CMS Collaboration,Eur.Phys.J. C73 no. 2, (2013) 2283,arXiv:1210.7544 [hep-ex].
[46] T. Gehrmann et al.,Phys.Rev.Lett. 113 no. 21, (2014) 212001,arXiv:1408.5243 [hep-ph].
![Table 4: Summary of the event selection in each signal region for the bν τ ¯b ¯ ν τ channel [18].](https://thumb-eu.123doks.com/thumbv2/123dok_br/16103006.1107875/18.918.195.720.277.811/table-summary-event-selection-signal-region-bν-channel.webp)
![Table 6: Selection criteria for the four SRs (tN_diag, tN_med, tN_high, and tN_boost) employed to search for LQ3 LQ3 → tν τ ¯t ¯ν τ events [19]](https://thumb-eu.123doks.com/thumbv2/123dok_br/16103006.1107875/23.918.174.745.247.785/table-selection-criteria-srs-boost-employed-search-events.webp)
![Table 7: The number of observed events in the three cut-and-count signal regions, together with the expected number of background events and signal events for different LQ masses (assuming β = 0.0) in the tν τ ¯t ¯ν τ channel [19].](https://thumb-eu.123doks.com/thumbv2/123dok_br/16103006.1107875/24.918.288.630.140.325/table-observed-regions-expected-background-different-assuming-channel.webp)