arXiv:1411.6111v1 [astro-ph.HE] 22 Nov 2014
of the Highest Energy Cosmic Rays Detected by the Pierre Auger Observatory
The Pierre Auger Collaboration
A. Aab42 , P. Abreu64 , M. Aglietta53 , E.J. Ahn81 , I. Al Samarai29 , I.F.M. Albuquerque17 , I. Allekotte1 , J. Allen84 , P. Allison86
, A. Almela11, 8, J. Alvarez Castillo57
, J. Alvarez-Mu˜niz74 , R. Alves Batista41 , M. Ambrosio44 , A. Aminaei58 , L. Anchordoqui80 , S. Andringa64 , C. Aramo44 , V.M. Aranda71 , F. Arqueros71 , H. Asorey1 , P. Assis64 , J. Aublin31 , M. Ave1 , M. Avenier32 , G. Avila10 , N. Awal84 , A.M. Badescu68 , K.B. Barber12 , J. B¨auml36 , C. Baus36 , J.J. Beatty86 , K.H. Becker35 , J.A. Bellido12 , C. Berat32 , M.E. Bertaina53 , X. Bertou1 , P.L. Biermann39 , P. Billoir31 , S.G. Blaess12 , M. Blanco31 , C. Bleve48
, H. Bl¨umer36, 37, M. Boh´aˇcov´a27 , D. Boncioli52 , C. Bonifazi23 , R. Bonino53 , N. Borodai62 , J. Brack78 , I. Brancus65 , A. Bridgeman37 , P. Brogueira64 , W.C. Brown79 , P. Buchholz42 , A. Bueno73 , S. Buitink58 , M. Buscemi44 , K.S. Caballero-Mora55e, B. Caccianiga43 , L. Caccianiga31 , M. Candusso45 , L. Caramete39 , R. Caruso46 , A. Castellina53 , G. Cataldi48 , L. Cazon64 , R. Cester47 , A.G. Chavez56 , A. Chiavassa53 , J.A. Chinellato18 , J. Chudoba27 , M. Cilmo44 , R.W. Clay12 , G. Cocciolo48 , R. Colalillo44 , A. Coleman87 , L. Collica43 , M.R. Coluccia48 , R. Concei¸c˜ao64 , F. Contreras9 , M.J. Cooper12 , A. Cordier30 , S. Coutu87 , C.E. Covault76 , J. Cronin88 , A. Curutiu39 , R. Dallier34, 33, B. Daniel18 , S. Dasso5, 3, K. Daumiller37 , B.R. Dawson12 , R.M. de Almeida24 , M. De Domenico46
, S.J. de Jong58, 60, J.R.T. de Mello Neto23
, I. De Mitri48 , J. de Oliveira24 , V. de Souza16 , L. del Peral72 , O. Deligny29 , H. Dembinski37 , N. Dhital83 , C. Di Giulio45 , A. Di Matteo49 , J.C. Diaz83 , M.L. D´ıaz Castro18 , F. Diogo64 , C. Dobrigkeit18 , W. Docters59 , J.C. D’Olivo57 , A. Dorofeev78 , Q. Dorosti Hasankiadeh37 , M.T. Dova4 , J. Ebr27 , R. Engel37 , M. Erdmann40 , M. Erfani42
, C.O. Escobar81, 18, J. Espadanal64
, A. Etchegoyen8, 11, P. Facal San Luis88
, H. Falcke58, 61, 60, K. Fang88 , G. Farrar84 , A.C. Fauth18 , N. Fazzini81 , A.P. Ferguson76 , M. Fernandes23 , B. Fick83 , J.M. Figueira8 , A. Filevich8 , A. Filipˇciˇc69, 70, B.D. Fox89 , O. Fratu68 , M.M. Freire6 , U. Fr¨ohlich42 , B. Fuchs36 , T. Fujii88 , R. Gaior31 , B. Garc´ıa7 , D. Garcia-Gamez30 , D. Garcia-Pinto71 , G. Garilli46 , A. Gascon Bravo73 , F. Gate34 , H. Gemmeke38 , P.L. Ghia31 , U. Giaccari23 , M. Giammarchi43 , M. Giller63 , C. Glaser40 , H. Glass81 , M. G´omez Berisso1 , P.F. G´omez Vitale10 , P. Gon¸calves64 , J.G. Gonzalez36 , N. Gonz´alez8 , B. Gookin78 , J. Gordon86 , A. Gorgi53 , P. Gorham89 , P. Gouffon17 , S. Grebe58, 60, N. Griffith86 , A.F. Grillo52 , T.D. Grubb12 , F. Guarino44 , G.P. Guedes19 , M.R. Hampel8 , P. Hansen4 , D. Harari1 , T.A. Harrison12 , S. Hartmann40 , J.L. Harton78 , A. Haungs37 , T. Hebbeker40 , D. Heck37 , P. Heimann42 , A.E. Herve37 , G.C. Hill12 , C. Hojvat81 , N. Hollon88 , E. Holt37 , P. Homola35 , J.R. H¨orandel58, 60, P. Horvath28 , M. Hrabovsk´y28, 27, D. Huber36 , T. Huege37 , A. Insolia46 , P.G. Isar66 , I. Jandt35 , S. Jansen58, 60, C. Jarne4 , M. Josebachuili8 , A. K¨a¨ap¨a35 , O. Kambeitz36 , K.H. Kampert35 , P. Kasper81 , I. Katkov36 , B. K´egl30 , B. Keilhauer37 , A. Keivani87 , E. Kemp18 , R.M. Kieckhafer83 , H.O. Klages37 , M. Kleifges38 , J. Kleinfeller9 , R. Krause40 , N. Krohm35 , O. Kr¨omer38 , D. Kruppke-Hansen35 , D. Kuempel40 , N. Kunka38 , D. LaHurd76 , L. Latronico53 , R. Lauer91 , M. Lauscher40 , P. Lautridou34 , S. Le Coz32 , M.S.A.B. Le˜ao14 , D. Lebrun32 , P. Lebrun81
, M.A. Leigui de Oliveira22 , A. Letessier-Selvon31 , I. Lhenry-Yvon29 , K. Link36 , R. L´opez54 , K. Louedec32 , J. Lozano Bahilo73 , L. Lu35, 75, A. Lucero8 , M. Ludwig36 , M. Malacari12 , S. Maldera53 , M. Mallamaci43 , J. Maller34 , D. Mandat27 , P. Mantsch81 , A.G. Mariazzi4 , V. Marin34 , I.C. Mari¸s73 , G. Marsella48 ,
D. Martello48 , L. Martin34, 33, H. Martinez55 , O. Mart´ınez Bravo54 , D. Martraire29 , J.J. Mas´ıas Meza3 , H.J. Mathes37 , S. Mathys35 , J. Matthews82 , J.A.J. Matthews91 , G. Matthiae45 , D. Maurel36 , D. Maurizio13 , E. Mayotte77 , P.O. Mazur81 , C. Medina77 , G. Medina-Tanco57 , R. Meissner40 , M. Melissas36 , D. Melo8 , A. Menshikov38 , S. Messina59 , R. Meyhandan89 , S. Mi´canovi´c25 , M.I. Micheletti6 , L. Middendorf40 , I.A. Minaya71 , L. Miramonti43 , B. Mitrica65 , L. Molina-Bueno73 , S. Mollerach1 , M. Monasor88 , D. Monnier Ragaigne30 , F. Montanet32 , C. Morello53 , M. Mostaf´a87 , C.A. Moura22
, M.A. Muller18, 21, G. M¨uller40
, S. M¨uller37 , M. M¨unchmeyer31 , R. Mussa47 , G. Navarra53‡, S. Navas73 , P. Necesal27 , L. Nellen57 , A. Nelles58, 60, J. Neuser35 , P.H. Nguyen12 , M. Niechciol42 , L. Niemietz35 , T. Niggemann40 , D. Nitz83 , D. Nosek26 , V. Novotny26 , L. Noˇzka28 , L. Ochilo42 , F. Oikonomou87 , A. Olinto88 , M. Oliveira64 , N. Pacheco72 , D. Pakk Selmi-Dei18 , M. Palatka27 , J. Pallotta2 , N. Palmieri36 , P. Papenbreer35 , G. Parente74 , A. Parra54 , T. Paul80, 85, M. Pech27 , J. P¸ekala62 , R. Pelayo54d, I.M. Pepe20 , L. Perrone48 , E. Petermann90 , C. Peters40 , S. Petrera49, 50, Y. Petrov78 , J. Phuntsok87 , R. Piegaia3 , T. Pierog37 , P. Pieroni3 , M. Pimenta64 , V. Pirronello46 , M. Platino8 , M. Plum40 , A. Porcelli37 , C. Porowski62 , R.R. Prado16 , P. Privitera88 , M. Prouza27 , V. Purrello1 , E.J. Quel2 , S. Querchfeld35 , S. Quinn76 , J. Rautenberg35 , O. Ravel34 , D. Ravignani8 , B. Revenu34 , J. Ridky27 , S. Riggi46 , M. Risse42 , P. Ristori2 , V. Rizi49 , W. Rodrigues de Carvalho74 , G. Rodriguez Fernandez45 , J. Rodriguez Rojo9 , M.D. Rodr´ıguez-Fr´ıas72 , D. Rogozin37 , G. Ros72 , J. Rosado71 , T. Rossler28 , M. Roth37 , E. Roulet1 , A.C. Rovero5 , S.J. Saffi12 , A. Saftoiu65 , F. Salamida29 , H. Salazar54 , A. Saleh70 , F. Salesa Greus87 , G. Salina45 , F. S´anchez8 , P. Sanchez-Lucas73 , C.E. Santo64 , E. Santos18 , E.M. Santos17 , F. Sarazin77 , B. Sarkar35 , R. Sarmento64 , R. Sato9 , N. Scharf40 , V. Scherini48 , H. Schieler37 , P. Schiffer41 , D. Schmidt37
, O. Scholten59f, H. Schoorlemmer89, 58, 60, P. Schov´anek27
, A. Schulz37 , J. Schulz58 , J. Schumacher40 , S.J. Sciutto4 , A. Segreto51 , M. Settimo31 , A. Shadkam82 , R.C. Shellard13 , I. Sidelnik1 , G. Sigl41 , O. Sima67 , A. ´Smia lkowski63 , R. ˇSm´ıda37 , G.R. Snow90 , P. Sommers87 , J. Sorokin12 , R. Squartini9 , Y.N. Srivastava85 , S. Staniˇc70 , J. Stapleton86 , J. Stasielak62 , M. Stephan40 , A. Stutz32 , F. Suarez8 , T. Suomij¨arvi29 , A.D. Supanitsky5 , M.S. Sutherland86 , J. Swain85 , Z. Szadkowski63 , M. Szuba37 , O.A. Taborda1 , A. Tapia8 , A. Tepe42 , V.M. Theodoro18
, C. Timmermans60, 58, C.J. Todero Peixoto15
, G. Toma65 , L. Tomankova37 , B. Tom´e64 , A. Tonachini47 , G. Torralba Elipe74 , D. Torres Machado23 , P. Travnicek27 , E. Trovato46 , R. Ulrich37 , M. Unger37, 84, M. Urban40 , J.F. Vald´es Galicia57 , I. Vali˜no74 , L. Valore44 , G. van Aar58 , P. van Bodegom12
, A.M. van den Berg59
, S. van Velzen58 , A. van Vliet41 , E. Varela54 , B. Vargas C´ardenas57 , G. Varner89 , J.R. V´azquez71 , R.A. V´azquez74 , D. Veberiˇc30 , V. Verzi45 , J. Vicha27 , M. Videla8 , L. Villase˜nor56 , B. Vlcek72 , S. Vorobiov70 , H. Wahlberg4 , O. Wainberg8, 11, D. Walz40 , A.A. Watson75 , M. Weber38 , K. Weidenhaupt40 , A. Weindl37 , F. Werner36 , A. Widom85 , L. Wiencke77
, B. Wilczy´nska62‡, H. Wilczy´nski62 , C. Williams88 , T. Winchen35 , D. Wittkowski35 , B. Wundheiler8 , S. Wykes58 , T. Yamamoto88a, T. Yapici83 , G. Yuan82 , A. Yushkov42 , B. Zamorano73 , E. Zas74 , D. Zavrtanik70, 69, M. Zavrtanik69, 70, A. Zepeda55b, J. Zhou88
, Y. Zhu38 , M. Zimbres Silva18 , M. Ziolkowski42 , F. Zuccarello46 1
Centro At´omico Bariloche and Instituto Balseiro (CNEA-UNCuyo-CONICET), San Carlos de Bariloche, Argentina
2
Centro de Investigaciones en L´aseres y Aplicaciones, CITEDEF and CONICET, Argentina 3
4
IFLP, Universidad Nacional de La Plata and CONICET, La Plata, Argentina 5
Instituto de Astronom´ıa y F´ısica del Espacio (IAFE, CONICET-UBA), Buenos Aires, Argentina 6
Instituto de F´ısica de Rosario (IFIR) - CONICET/U.N.R. and Facultad de Ciencias Bioqu´ımicas y Farmac´euticas U.N.R., Rosario, Argentina
7
Instituto de Tecnolog´ıas en Detecci´on y Astropart´ıculas (CNEA, CONICET, UNSAM), and National Technological University, Faculty Mendoza (CONICET/CNEA), Mendoza, Argentina 8
Instituto de Tecnolog´ıas en Detecci´on y Astropart´ıculas (CNEA, CONICET, UNSAM), Buenos Aires, Argentina
9
Observatorio Pierre Auger, Malarg¨ue, Argentina 10
Observatorio Pierre Auger and Comisi´on Nacional de Energ´ıa At´omica, Malarg¨ue, Argentina 11
Universidad Tecnol´ogica Nacional - Facultad Regional Buenos Aires, Buenos Aires, Argentina 12
University of Adelaide, Adelaide, S.A., Australia 13
Centro Brasileiro de Pesquisas Fisicas, Rio de Janeiro, RJ, Brazil 14
Faculdade Independente do Nordeste, Vit´oria da Conquista, Brazil 15
Universidade de S˜ao Paulo, Escola de Engenharia de Lorena, Lorena, SP, Brazil 16
Universidade de S˜ao Paulo, Instituto de F´ısica de S˜ao Carlos, S˜ao Carlos, SP, Brazil 17
Universidade de S˜ao Paulo, Instituto de F´ısica, S˜ao Paulo, SP, Brazil 18
Universidade Estadual de Campinas, IFGW, Campinas, SP, Brazil 19
Universidade Estadual de Feira de Santana, Brazil 20
Universidade Federal da Bahia, Salvador, BA, Brazil 21
Universidade Federal de Pelotas, Pelotas, RS, Brazil 22
Universidade Federal do ABC, Santo Andr´e, SP, Brazil 23
Universidade Federal do Rio de Janeiro, Instituto de F´ısica, Rio de Janeiro, RJ, Brazil 24
Universidade Federal Fluminense, EEIMVR, Volta Redonda, RJ, Brazil 25
Rudjer Boˇskovi´c Institute, 10000 Zagreb, Croatia 26
Charles University, Faculty of Mathematics and Physics, Institute of Particle and Nuclear Physics, Prague, Czech Republic
27
Institute of Physics of the Academy of Sciences of the Czech Republic, Prague, Czech Republic 28
Palacky University, RCPTM, Olomouc, Czech Republic 29
Institut de Physique Nucl´eaire d’Orsay (IPNO), Universit´e Paris 11, CNRS-IN2P3, France 30
Laboratoire de l’Acc´el´erateur Lin´eaire (LAL), Universit´e Paris 11, CNRS-IN2P3, France 31
Laboratoire de Physique Nucl´eaire et de Hautes Energies (LPNHE), Universit´es Paris 6 et Paris 7, CNRS-IN2P3, Paris, France
32
Laboratoire de Physique Subatomique et de Cosmologie (LPSC), Universit´e Grenoble-Alpes, CNRS/IN2P3, France
33
Station de Radioastronomie de Nan¸cay, Observatoire de Paris, CNRS/INSU, France 34
SUBATECH, ´Ecole des Mines de Nantes, CNRS-IN2P3, Universit´e de Nantes, France 35
Bergische Universit¨at Wuppertal, Wuppertal, Germany 36
Karlsruhe Institute of Technology - Campus South - Institut f¨ur Experimentelle Kernphysik (IEKP), Karlsruhe, Germany
37
Karlsruhe Institute of Technology - Campus North - Institut f¨ur Kernphysik, Karlsruhe, Germany
38
Karlsruhe Institute of Technology - Campus North - Institut f¨ur Prozessdatenverarbeitung und Elektronik, Karlsruhe, Germany
39
40
RWTH Aachen University, III. Physikalisches Institut A, Aachen, Germany 41
Universit¨at Hamburg, Hamburg, Germany 42
Universit¨at Siegen, Siegen, Germany 43
Universit`a di Milano and Sezione INFN, Milan, Italy 44
Universit`a di Napoli ”Federico II” and Sezione INFN, Napoli, Italy 45
Universit`a di Roma II ”Tor Vergata” and Sezione INFN, Roma, Italy 46
Universit`a di Catania and Sezione INFN, Catania, Italy 47
Universit`a di Torino and Sezione INFN, Torino, Italy 48
Dipartimento di Matematica e Fisica ”E. De Giorgi” dell’Universit`a del Salento and Sezione INFN, Lecce, Italy
49
Dipartimento di Scienze Fisiche e Chimiche dell’Universit`a dell’Aquila and INFN, Italy 50
Gran Sasso Science Institute (INFN), L’Aquila, Italy 51
Istituto di Astrofisica Spaziale e Fisica Cosmica di Palermo (INAF), Palermo, Italy 52
INFN, Laboratori Nazionali del Gran Sasso, Assergi (L’Aquila), Italy 53
Osservatorio Astrofisico di Torino (INAF), Universit`a di Torino and Sezione INFN, Torino, Italy
54
Benem´erita Universidad Aut´onoma de Puebla, Puebla, Mexico 55
Centro de Investigaci´on y de Estudios Avanzados del IPN (CINVESTAV), M´exico, Mexico 56
Universidad Michoacana de San Nicolas de Hidalgo, Morelia, Michoacan, Mexico 57
Universidad Nacional Autonoma de Mexico, Mexico, D.F., Mexico 58
IMAPP, Radboud University Nijmegen, Netherlands 59
KVI - Center for Advanced Radiation Technology, University of Groningen, Netherlands 60
Nikhef, Science Park, Amsterdam, Netherlands 61
ASTRON, Dwingeloo, Netherlands 62
Institute of Nuclear Physics PAN, Krakow, Poland 63
University of L´od´z, L´od´z, Poland 64
Laborat´orio de Instrumenta¸c˜ao e F´ısica Experimental de Part´ıculas - LIP and Instituto Superior T´ecnico - IST, Universidade de Lisboa - UL, Portugal
65
’Horia Hulubei’ National Institute for Physics and Nuclear Engineering, Bucharest- Magurele, Romania
66
Institute of Space Sciences, Bucharest, Romania 67
University of Bucharest, Physics Department, Romania 68
University Politehnica of Bucharest, Romania 69
Experimental Particle Physics Department, J. Stefan Institute, Ljubljana, Slovenia 70
Laboratory for Astroparticle Physics, University of Nova Gorica, Slovenia 71
Universidad Complutense de Madrid, Madrid, Spain 72
Universidad de Alcal´a, Alcal´a de Henares (Madrid), Spain 73
Universidad de Granada and C.A.F.P.E., Granada, Spain 74
Universidad de Santiago de Compostela, Spain 75
School of Physics and Astronomy, University of Leeds, United Kingdom 76
Case Western Reserve University, Cleveland, OH, USA 77
Colorado School of Mines, Golden, CO, USA 78
Colorado State University, Fort Collins, CO, USA 79
Colorado State University, Pueblo, CO, USA 80
York, USA 81
Fermilab, Batavia, IL, USA 82
Louisiana State University, Baton Rouge, LA, USA 83
Michigan Technological University, Houghton, MI, USA 84
New York University, New York, NY, USA 85
Northeastern University, Boston, MA, USA 86
Ohio State University, Columbus, OH, USA 87
Pennsylvania State University, University Park, PA, USA 88
University of Chicago, Enrico Fermi Institute, Chicago, IL, USA 89
University of Hawaii, Honolulu, HI, USA 90
University of Nebraska, Lincoln, NE, USA 91
University of New Mexico, Albuquerque, NM, USA (‡) Deceased
(a) Now at Konan University
(b) Also at the Universidad Autonoma de Chiapas on leave of absence from Cinvestav (d) Now at Unidad Profesional Interdisciplinaria de Ingenier´ıa y Tecnolog´ıas Avanzadas del IPN,
M´exico, D.F., M´exico
(e) Now at Universidad Aut´onoma de Chiapas, Tuxtla Guti´errez, Chiapas, M´exico (f) Also at Vrije Universiteit Brussels, Belgium
ABSTRACT
We analyze the distribution of arrival directions of ultra-high energy cosmic rays recorded at the Pierre Auger Observatory in 10 years of operation. The data set, about three times larger than that used in earlier studies, includes arrival directions with zenith angles up to 80◦, thus covering from −90◦ to +45◦ in declination. After updating the fraction of events correlating with the active galactic nuclei (AGNs) in the V´eron-Cetty and V´eron catalog, we subject the arrival directions of the data with energies in excess of 40 EeV to different tests for anisotropy. We search for localized excess fluxes and for self-clustering of event directions at angular scales up to 30◦ and for different threshold energies between 40 EeV and 80 EeV. We then look for correlations of cosmic rays with celestial structures both in the Galaxy (the Galactic Center and Galactic Plane) and in the local Universe (the Super-Galactic Plane). We also examine their correlation with different populations of nearby extragalactic objects: galaxies in the 2MRS catalog, AGNs detected by Swift-BAT, radio galaxies with jets and the Centaurus A galaxy. None of the tests shows a statistically significant evidence of anisotropy. The strongest departures from isotropy (post-trial probability ∼1.4%) are obtained for cosmic rays with E > 58 EeV in rather large windows around Swift AGNs closer than 130 Mpc and brighter than 1044erg/s (18◦ radius) and around the direction of Centaurus A (15◦ radius).
1. Introduction
The measurements of the energy spectrum of ultra-high energy cosmic rays (UHE-CRs), their mass composition and the celestial distribution of their arrival directions serve in a complementary way to understand their origin. The acceleration mechanism as well as the propagation in the Galactic and intergalactic media can be constrained by detailed studies of spectral features and of the evolution of the mass composition as a function of energy. In turn, and despite the fact that UHECRs are mostly charged particles, infor-mation on the sources might be contained in the distribution of their arrival directions, especially above a few tens of EeV where the magnetic deflections (at least of those cosmic rays with a small charge) may be of only a few degrees. A number of facts contribute to this expectation. Stringent limits to the flux of primary photons at such energies (Abraham et al. 2009) strongly constrain top-down models for the origin of UHECRs and hence favor astrophysical objects as accelerators. Also, at such energies the flux of cosmic rays is expected to be suppressed due to energy losses in their interactions with photons of the Cosmic Microwave Background (CMB) by the so-called GZK (Greisen-Zatsepin-Kuz’min) effect (Greisen 1966; Zatsepin & Kuzmin 1966). These interactions limit the distance from which a source can contribute to the flux at Earth. For instance, this dis-tance has to be less than ∼ 200 Mpc for protons or Fe nuclei with energies above 60 EeV, and even smaller for intermediate mass nuclei (Harari et al. 2006). Thus, the number of candidate sources which could contribute to the measured fluxes at the highest energies is significantly reduced. Finally, the arrival directions of UHECRs are not expected to be completely isotropized by magnetic fields due to their very high rigidity.
A suppression in the flux of UHECRs at energies above 40 EeV has been established experimentally beyond any doubt (Abbasi et al. 2008; Abraham et al. 2008b; Abu-Zayyad et al. 2013). The energy at which the spectrum steepens is in accordance with that expected from the GZK effect. However, this alone does not allow one to conclude whether the observed feature is due to propagation effects or to source properties, i.e., the maximum energy achievable in the acceleration process. Information on the nature of UHECRs is one of the keys in discriminating between the two scenarios. The measurement of the cos-mic ray composition has been addressed through the measurement of the depth of shower maximum, Xmax (Abraham et al. 2010a; Aab et al. 2014; Abbasi et al. 2010, 2014b). In-terpretations of Auger data through the most updated models of hadronic interactions (Abreu et al. 2013b; Aab et al. 2014) indicate that the fraction of heavy nuclei increases above the energy of the ankle (the spectral hardening taking place at E ≃ 5 EeV) and up to the highest energies. However, the small number of events does not allow one to probe the primary mass evolution in detail at energies in excess of 40 EeV, where there have been only 18 events available for the composition analysis.
distribu-tion of arrival direcdistribu-tions have been made with UHECR data. Using an early data set the Pierre Auger Collaboration reported evidence of anisotropy with a confidence level of 99% in the distribution of cosmic rays with energy above about 57 EeV (Abraham et al. 2007, 2008a). That analysis was based on the finding, through an a-priori test, of a correlation within a small angular separation (3.1◦) between the UHECR arrival directions and the locations of nearby active galaxies (within 75 Mpc) in the V´eron-Cetty and V´eron (VCV) catalog (Veron-Cetty & Veron 2006). With an enlarged data set the correlating fraction was found in later analyses to be lower (Abreu et al. 2010; Kampert et al. 2012), although still ∼3σ above expectations from an isotropic distribution. Other tests on the data, using a variety of astronomical catalogs, yielded some further hints but no significant evidence of anisotropy (Abreu et al. 2010). It is interesting to note that both the Pierre Auger and the Telescope Array Collaborations have reported, although with a limited significance, concentrations of very high energy events in regions of the sky of ∼20◦ radius, namely for 18◦ around the radio galaxy Centaurus A (Cen A) in the case of Auger (Abreu et al. 2010) and in a 20◦ radius window at declination δ = 43◦ in the case of the Telescope Array (Abbasi et al. 2014a). Note that the hot spot observed around Cen A is outside the field of view of the Telescope Array, while the one observed by the Telescope Array is only partially inside the field of view of the Auger Observatory when highly-inclined events are considered.
In the present situation where the origin of the suppression in the flux of the UHE-CRs has not yet been understood, their mass composition is not precisely known and the predictions of their deflections in magnetic fields are uncertain (also due to uncertain-ties in models of magnetic fields, see for example Farrar (2014) for a recent review), a large number of events is essential in looking for anisotropies in a sky map. Whatever the origin of the suppression in their flux and whatever their nature, UHECRs are still expected to come from sources relatively close to the Earth where the galaxies are dis-tributed non uniformly. Even if low-charge particles were to contribute only a fraction of the primary cosmic rays, anisotropic signals on small angular scales may show up as the number of events gathered increases. In turn, should the UHECRs be significantly deflected, either due to their large charge or due to the presence of strong intervening magnetic fields, directional excesses might still be found at larger angular scales. Searches for such anisotropies have been made so far with data sets including a few dozen cosmic rays (for instance in Abreu et al. (2010) we published the arrival directions and energies of 69 events above 55 EeV and zenith angle θ ≤ 60◦, corresponding to an exposure of 20,370 km2 sr yr). In this paper we present a study of the arrival directions of UHECRs detected by the Pierre Auger Observatory in more than 10 years of data taking, with an exposure of about 66,000 km2 sr yr. The data set, including more than 600 events above 40 EeV, is described in Section 2. By including for the first time cosmic rays with zenith angles up to 80◦, the field of view of the Auger Observatory has been extended to cover
from −90◦ to +45◦ in declination.
In the later sections we analyze the distribution of the arrival directions. In Section 3 we update the fraction of events correlating with AGNs in the VCV catalog. In spite of the large data set (three times larger than that used in Abreu et al. (2010)), this test does not substantiate the initial evidence of anisotropy at energies larger than 53 EeV1. We conse-quently explore in the later sections the set of arrival directions for cosmic rays observed with energies above 40 EeV. Since this energy corresponds to the onset of the suppression in the observed flux, we expect a limited number of contributing sources above such a threshold. Also, above this energy the angular deflections caused by intervening magnetic fields are expected to be of the order of a few degrees for protons, and Z times larger in the case of nuclei with atomic number Z. We perform various tests to search for anisotropies in the data set, exploring a wide range of angular windows between 1◦ and 30◦ and energy thresholds from 40 EeV up to 80 EeV. The angular range is motivated, at the lower end, by the angular resolution of the measurement of the arrival directions and, at the higher end, by the large deflections expected if cosmic rays are high-Z nuclei. Considering energy thresholds higher than 40 EeV may help because it may involve smaller deflections and smaller GZK horizons, with the upper value of 80 EeV still allowing to have a sizeable number of events (22) in the analysis. In Section 4 we study “intrinsic” anisotropies as can be revealed by the search for localized excesses of events over the exposed sky and by the analysis of the autocorrelation of arrival directions. In Section 5 we search for correlations with known astrophysical structures, such as the Galactic and Super-Galactic Planes and the Galactic Center. We study the cross-correlation with astrophysical objects that could be considered as plausible candidates for UHECR sources in Section 6. Specif-ically, we exploit flux-limited catalogs of galaxies (2MRS), of AGNs observed in X-rays (Swift BAT-70) and of radio galaxies with jets. For the last two samples, we perform an additional study, considering different thresholds in the AGN intrinsic luminosity. Finally, in Section 7 we focus on the distribution of events around the direction of Centaurus A. After summarizing the main results in Section 8 we report in the Appendix the list of arrival directions and energies of the 231 UHECRs with energies above 52 EeV detected by the Pierre Auger Observatory between 2004 January 1 and 2014 March 312.
1This threshold was 57 EeV in the original calibration used in Abraham et al. (2007, 2008a). It became
55 EeV with the updated reconstruction used in Abreu et al. (2010), corresponding to approximately 53 EeV in the new energy scale considered in the present work (see Section 2).
2. The Data Set
The Pierre Auger Observatory (Abraham et al. 2004) is located in Malarg¨ue, Ar-gentina, at latitude 35.2◦ S, longitude 69.5◦ W and an average altitude of 1400 m a.s.l. It comprises a surface detector (SD) made up of an array of water-Cherenkov stations overlooked by an air-fluorescence detector (FD) comprising a total of 27 telescopes at four sites on the perimeter of the array. The array consists of 1660 water-Cherenkov stations covering an area of about 3000 km2. The SD samples the particle components of extensive air showers (mainly muons, electrons, and photons) with a duty cycle of nearly 100%.
The data set analyzed here includes cosmic rays with energy above 40 EeV recorded by the SD from 2004 January 1 up to 2014 March 31. In earlier analyses of the arrival directions we have used events with zenith angles less than 60◦ (referred to as vertical). Here we include, for the first time, those with zenith angles from 60◦ up to 80◦ (dubbed in-clined). Selection, reconstruction and energy determination are different for the two event sets. The main characteristics of the data sets, including energy and angular resolution, are outlined below and details can be found in Ave M. et al. (2007); Aab et al. (2014).
Vertical events are accepted if at least four of the closest stations to the one with the highest signal are operational at the time of the event. We also require that the reconstructed shower core be contained within a triangle of operational stations, either equilateral or isosceles, of contiguous stations. This event selection, a less stringent one than that used in earlier works (where five operational neighboring stations were required), has been carefully studied using data. It ensures an accurate event reconstruction given the large multiplicity of triggered detectors (on average more than 14 stations are triggered in events with energy above 40 EeV). It also allows us to increase the number of vertical events by about 14% in the period considered. On the other hand, for inclined events we require that at least five active stations surround the station closest to the core position. Given the large footprint of inclined showers on the ground (the average station multiplicity is larger than 30), such a fiducial criterion guarantees adequate containment inside the array. The described selections lead to 454 vertical and 148 inclined events with E ≥ 40 EeV.
The trigger and selection efficiency is 100% for energies above 3 (4) EeV for verti-cal (inclined) showers. The exposure is consequently determined by purely geometriverti-cal considerations (Abraham et al. 2010b; Aab et al. 2013) in both cases and for the period considered here it amounts to 51,753 km2 sr yr and 14,699 km2 sr yr, for the vertical and inclined samples, respectively.
For both data sets the arrival directions of cosmic rays are determined from the relative arrival times of the shower front in the triggered stations. The angular resolution, defined as the radius around the true cosmic ray direction that would contain 68% of the recon-structed shower directions, is better than 0.9◦ for energies above 10 EeV (Bonifazi et al.
2009).
The ground parameters used to estimate the primary energy are different for the two data sets. The estimator for the primary energy of vertical showers is the reconstructed signal at 1000 m from the shower axis, denoted S(1000). The energy reconstruction of an inclined shower is based on the muon content, denoted N19, relative to a simulated proton shower with energy 1019 eV. In both cases, the energy estimators are calibrated using hybrid events (detected simultaneously by SD and FD) and using the quasi-calorimetric energy determination obtained with the air fluorescence detector (Aab et al. 2013, 2014). The statistical uncertainty in the energy determination is smaller than 12% for energies above 10 EeV (Aab et al. 2014; Abreu et al. 2011). The systematic uncertainty in the absolute energy scale, common to the two data sets, is 14%. The Pierre Auger Collabo-ration has updated the energy scale in Verzi et al. (2013) accounting for recent measure-ments of the fluorescence yield (Ave et al. 2013), a better estimate of the invisible energy (Tueros et al. 2013), a deeper understanding of the detector, and an improved event recon-struction. The energy threshold of 55 EeV used in our previous publication (Abreu et al. 2010) corresponds now to approximately 53 EeV with the new energy scale.
We note that the relative number of vertical and inclined events above 40 EeV, 454/148 ≃ 3.07 ± 0.29, is consistent in view of the Poissonian fluctuations with the corresponding ratio of exposures, 51, 753/14, 699 ≃ 3.52. On the other hand, the 14% dif-ference between these ratios could also result from a ∼4% mismatch between the vertical and inclined energy calibrations, which is compatible with the uncorrelated systematic uncertainties on the energy scale.
3. Note on the Anisotropy Test with the VCV Catalog
One of the anisotropy tests performed in our previous works was based on the V´eron-Cetty and V´eron catalog of active galactic nuclei (Veron-V´eron-Cetty & Veron 2006). In an initial study we considered vertical events with E ≥ 40 EeV collected from 2004 January 1 to 2006 May 26 (Period I). We performed an exploratory scan over the energy threshold of the events, their angular separation from AGNs and the maximum AGN redshift. We found that the most significant excess appeared in the correlation of events with energy above 57 EeV and lying within 3.1◦ of those AGNs closer than 75 Mpc. These parameters were then used for a search on independent data where it was found that 8 out of 13 events correlated, while 2.7 events (i.e., 21% of the total) were expected to correlate by chance for an isotropic distribution of arrival directions. This finding had a probability of 1.7×10⁻³ of happening by chance (Abraham et al. 2007, 2008a). Subsequent analyses with enlarged statistics yielded a correlation still above isotropic expectations but with a smaller strength and essentially dominated by the initial excess. The level of correlation
was (38+7−6)% in Abreu et al. (2010) and (33 ± 5)% in Kampert et al. (2012).
Here we update this analysis, for historical reasons, by using the vertical data set described in Section 2 and the VCV catalogue used in Abraham et al. (2007). Excluding Period I, there are 146 events above 53 EeV: 41 events correlate with VCV AGNs, with the angular and distance parameters fixed by the exploratory scan. The updated fraction of correlations is then (28.1+3.8
−3.6)%, which is 2 standard deviations above the isotropic expectation of 21%. On the other hand, note that since the VCV correlations involve many different regions of the sky (besides the fact that CRs with different energies have significant time delays), an explanation of the reduced correlation found after 2007 in terms of a transient nature of the signal would not be natural. Hence, the high level of correlation found initially was probably affected by a statistical fluctuation. We conclude that this particular test does not yield a significant indication of anisotropy with the present data set.
4. General Anisotropy Tests
4.1. Search for a Localized Excess Flux over the Exposed Sky
A direct analysis of cosmic ray arrival directions is the blind search for excesses of events over the visible sky. To this aim we sample the exposed sky using circular windows with radii varying from 1◦ up to 30◦, in 1◦ steps. The centers of the windows are taken on a 1◦×1◦ grid. The energy threshold of the events used to build the maps is varied from 40 EeV up to 80 EeV in steps of 1 EeV. To detect an excess we compare, for every window and energy threshold, the number of observed events, nobs, with that expected from an isotropic flux of cosmic rays, nexp. The expected number of events for an isotropic distribution is obtained, for each sky direction, by numerically integrating the geometric exposures in the corresponding windows3.
For each window we calculate the binomial probability p of observing by chance in an isotropic flux an equal to, or larger number of events than that found in the data. We find the minimum probability, p = 5.9×10⁻⁶, at an energy threshold of 54 EeV and in a 12◦-radius window centered at right ascension and declination (α, δ) = (198◦, −25◦), i.e., for Galactic longitude and latitude (ℓ, b) = (−51.1◦, 37.6◦), for which nobs/nexp= 14/3.23. The map of the Li-Ma (Li & Ma 1983) significances of the excesses of events with E ≥ 54 EeV in windows of 12◦ radius is shown in Figure 1. The highest significance region just discussed, having a Li-Ma significance of 4.3σ, is indicated with a black circle. It is close
3We use the total number of vertical and inclined events to estimate the relative exposures of the two
to the Super-Galactic Plane, indicated with a dashed line, and not far from the direction of Centaurus A, indicated with a white star. One should keep in mind that although the effects of a turbulent magnetic field would be just to spread a signal around the direction towards the source, a regular field coherent over large scales would give rise to a shift of the excess in a direction orthogonal to that of the magnetic field, being the size of both effects energy dependent.
Fig. 1.— Map in Galactic coordinates of the Li-Ma significances of overdensities in 12◦ -radius windows for the events with E ≥ 54 EeV. Also indicated are the Super-Galactic Plane (dashed line) and Centaurus A (white star).
To assess the significance of this excess we simulated 10,000 sets of isotropic arrival directions containing the same number of events as the data set. In doing so, we keep the original energies of the events and assign to them random arrival directions according to the geometric exposure, choosing randomly between vertical and inclined events according to their relative exposures. We apply to the simulated sets the same scans in angle and energy as those applied to the data. We find that values smaller than p = 5.9×10⁻⁶ are obtained in 69% of isotropic simulations and hence the excess found in the data turns out to be compatible with the maximum excesses expected in isotropic simulations. We note that in the region of the hot-spot reported by the Telescope Array Collaboration (Abbasi et al. 2014a), a 20◦ radius circular window centered at (α, δ) = (146.7◦, 43.2◦), which is partially outside our field of view, we expect to see 0.97 events with E > 53 EeV if the distribution were isotropic and 1 event is observed.
4.2. The Autocorrelation of Events
Another simple way to test the clustering of arrival directions is through an autocor-relation analysis, which is particularly useful when several sources lead to excesses around them on a similar angular scale. With this method one looks for excesses in the number of
pairs of events, i.e., excesses of “self-clustering,” namely, we count the number of pairs of events, Np(ψ, Eth), above a given energy threshold Eth that are within a certain angular distance ψ. We do this at different energy thresholds, from 40 EeV up to 80 EeV (in steps of 1 EeV) and we look at angular scales from 1◦ up to 30◦ (in steps of 0.25◦ up to 5◦, and of 1◦ for larger angles). To identify an excess we compare the observed number of pairs with that expected from an isotropic distribution having the same number of arrival directions above the corresponding energy threshold. For each energy threshold and angle we then calculate the fraction of isotropic simulations having an equal number to, or more pairs than the data, f (ψ, Eth).
Autocorrelation 0 5 10 15 20 25 30 Ψ [deg] 40 45 50 55 60 65 70 75 80 Eth [EeV] 0.01 0.1 1 f
+
Fig. 2.— Fraction f obtained in the autocorrelation of events versus ψ and Eth.
The result is shown in Figure 2 as a function of the angular distance and the energy threshold. The color code indicates the values obtained for f . The white cross corresponds to the parameter values leading to the minimum value of this fraction, fmin = 0.027, which happens for ψ = 1.5◦ and E
th = 42 EeV. For these parameters, 30 pairs are expected on average for isotropic simulations while 41 are observed in the data. We calculate the post-trial probability for this excess, P , as the fraction of isotropic simulations which under a similar scan over Eth and ψ lead to a value of fmin smaller than the one obtained with the data. The resulting value, P ≃ 70%, indicates that the autocorrelation is compatible with the expectations from an isotropic distribution of arrival directions.
-2 -1 0 1 2 0 10 20 30 40 50 60 70 80 90 Significance bG(max) [deg] E>40 EeV E>55 EeV E>70 EeV -2 -1 0 1 2 0 10 20 30 40 50 60 70 80 90 Significance bSG(max) [deg] E>40 EeV E>55 EeV E>70 EeV
Fig. 3.— The significance as a function of Galactic (left) or Super-Galactic (right) latitude band half width, for events with energies above 40, 55 or 70 EeV.
-2 -1 0 1 2 0 20 40 60 80 100 120 140 160 180 Significance angleGC [deg] E>40 EeV E>55 EeV E>70 EeV
Fig. 4.— Significance of overdensities in circular windows around the Galactic Center as a function of the angular radius of the window, for events with energies above 40, 55 or 70 EeV.
5. Search for Correlations with the Galaxy and with the Super-Galactic Plane
In the previous section we tested the intrinsic distribution of arrival directions of UHECRs, i.e., without formulating any hypothesis on the distribution of their sources. In the following we consider specific astrophysical structures and objects as candidate sources. In this section we search for correlations with the Galactic and the Super-Galactic Planes as well as with the Galactic Center. On the one hand, a Galactic origin of UHECRs might give rise to an excess of arrival directions near the plane of the Galaxy, especially if a low-Z primary component contributes to the CR flux. On the other hand, nearby galaxies (within 100 Mpc) show a clustering along the so-called Super-Galactic Plane, which contains several prominent (super) clusters such as Virgo, Centaurus, Norma, Pavo-Indus, Perseus-Pisces, Coma, etc., and hence extragalactic cosmic rays could be clustered near the Super-Galactic Plane.
We search for excesses of events as a function of Galactic (Super-Galactic) latitude, bG (bSG), considering different latitude bands, |b| < b(max), with b(max) indicating the half width of the band. To identify an excess we compare the number of observed events, nobs, to that expected from an isotropic distribution of arrival directions, nexp, obtained as the average over isotropic simulations of the number of events within the latitude band considered. The significance of an excess is taken as σ ≡ (nobs− nexp)/√nexp. The results are shown in Figure 3 as a function of b(max). We show the results for events with energies above three illustrative thresholds, 40 EeV, 55 EeV and 70 EeV, respectively. The left (right) panel shows the significance as a function of Galactic (Super-Galactic) latitude band half width. No significant excess is observed in any latitude band from either of the two planes, although a slight excess is apparent within ∼20◦ of the Super-Galactic Plane for the three energy bins considered.
The overdensities in circular windows around the Galactic Center are shown in Fig-ure 4 as a function of the angular radius. Again no significant excess results for any of the windows and energy thresholds considered.
6. Search for Cross-Correlations with Astrophysical Catalogs
In this section we search for correlations of the set of arrival directions with the celestial distribution of potential nearby cosmic ray sources. We choose approximately uniform and complete catalogs, namely the 2MRS catalog of galaxies (Huchra et al. 2012), the Swift-BAT (Baumgartner et al. 2013) X-ray catalog of AGNs4 and a catalog of radio galaxies with jets recently compiled in Van Velzen et al. (2012). The three samples are quite complementary in identifying possible cosmic ray sources. The normal galaxies that dominate the 2MRS catalog may trace the locations of gamma ray bursts and/or fast spinning newborn pulsars, whereas X-rays observed by Swift identify AGNs hosted mainly by spiral galaxies, and the radio emission catalog selects extended jets and radio lobes of AGNs hosted mainly by elliptical galaxies.
The 2MASS Redshift Survey (2MRS) (Huchra et al. 2012) maps the distribution of galaxies in the nearby universe. It covers 91% of the sky, except for Galactic latitudes |b| < 5◦ (and |b| < 8◦ for longitudes within 30◦ of the Galactic Center). In the region covered it is essentially complete (at 97.6%) for magnitudes brighter than Ks= 11.75. It contains 43,533 galaxies with measured redshift5: 37,209 of them are within 200 Mpc and
4The 2MRS and Swift catalogs have been updated after our earlier study of correlations in Abreu et al.
(2010); Kampert et al. (2012).
5We adopt hereafter a Hubble constant of H
0 = 70 km/s/Mpc and the effective distances considered
16,422 within 100 Mpc. About 90% of its objects have a redshift z < 0.05, which is the range of distances of interest for UHECR correlation studies due to the effects of the GZK horizon.
The Swift-BAT 70-month X-ray catalog (Baumgartner et al. 2013) includes sources detected in 70 months of observation of the BAT hard X-ray detector on the Swift gamma-ray burst observatory. It contains a total of 1210 objects: 705 of them are AGN-like (Seyfert I and II, other AGNs, blazars and QSOs) with measured redshift. The catalog is complete over 90% of the sky for fluxes > 13.4×10⁻¹² erg/(s cm2), measured in the X-ray band from 14 to 195 keV. We use this cut in flux hereafter to have a more uniform sample of nearby AGNs. 489 AGN-like objects survive the cut: 296 of them are within 200 Mpc and 160 are within 100 Mpc.
The third catalog we use is a compilation of radio galaxies produced in Van Velzen et al. (2012). This is a combination of catalogs of observations at 1.4 GHz (NRAO VLA Sky Survey (Condon et al. 1998)) and 843 MHz (Sydney University Molonglo Sky Survey (Mauch et al. 2003)), with redshifts of associated objects taken from 2MRS. A flux limit of 213 mJy (289 mJy) at 1.4 GHz (843 MHz) is imposed to the objects from each respective catalog, which would correspond to the flux of Cen A as seen from a distance of about 200 Mpc. We select from this catalog the radio galaxies having jets, which constitute a set of attractive candidates for UHECR sources. There are in total 407 such jetted radio galaxies: 205 are within 200 Mpc and 56 are within 100 Mpc (for this catalog we compute the distance using the redshift corrected for peculiar velocities that are also provided). We note that the majority of these radio galaxies are different from the Swift-BAT AGNs detected in X-rays. It is also important to keep in mind that although we analyze each cat-alog individually, it is possible that different types of sources (i.e., from different catcat-alogs) might be contributing to the overall UHECR fluxes.
Below we first study the cross-correlation with the three complete flux-limited catalogs (with the flux limits just described), including objects up to different maximum distances. This selection is based on the apparent luminosity, and is motivated by the fact that nearby sources may contribute significantly to the fluxes (in their corresponding electromagnetic band as well as in CRs) even if they are intrinsically fainter than far away sources. In the case of the AGNs in the Swift and radio-galaxy catalogs we also scan on the measured intrinsic luminosity of the objects. This is motivated by the fact that the maximum CR energy Emax achievable at the sources may be linked to the intrinsic electromagnetic bolometric luminosity L of the source. In particular one could expect that (Emax/Z)2∝ L if the energy density in the magnetic field is in equipartition with the energy in synchrotron emitting electrons in the acceleration region (see, e.g., Farrar & Gruzinov (2009)). Hence, it might happen that only sources intrinsically brighter than some given luminosity are able to accelerate CRs above the threshold energies considered in this paper. On the other
hand, for the radio galaxies the luminosity is also correlated with the Fanaroff-Riley class, with FRII galaxies being generally brighter than FRI ones.
6.1. Cross-Correlation with Flux-Limited Samples
The basis of the cross-correlation technique is a counting of the number of pairs between UHE events and objects in the chosen catalogs. In a similar way to the analyses described in previous sections, we scan over energy threshold (40 EeV ≤ Eth ≤ 80 EeV) and over the angular scale (1◦≤ ψ ≤ 30◦). We also consider different maximum distances to the objects, D, scanning on this from 10 Mpc up to 200 Mpc, in steps of 10 Mpc. To find excesses of pairs we compare their observed number with that resulting from isotropic simulations. For each considered distance D we first calculate the fraction of isotropic simulations having an equal number to or more pairs than the data, f (ψ, Eth), and then we look for its minimum, fmin. The post-trial probability, P , is calculated as the fraction of isotropic simulations which, under similar scans over Eth and ψ for each considered D, lead to a value of fmin smaller than the one obtained with the data.
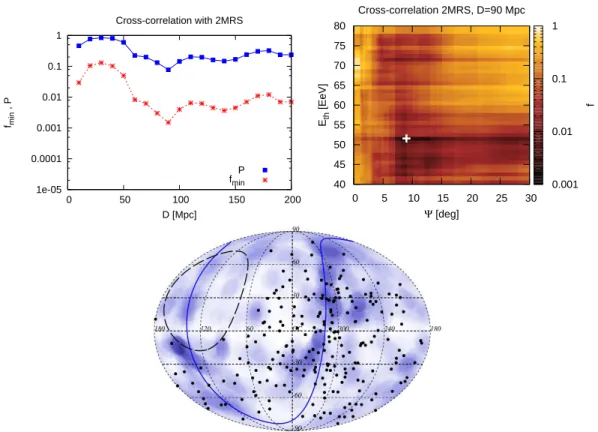
Figure 5 displays the results for the case of the 2MRS catalog. The top-left panel shows fmin(asterisks) and P (squares) obtained for each distance D. The minimum values are observed for D = 90 Mpc, for which fmin ≃ 1.5×10⁻³ and P ≃ 8%. The top-right panel in the figure shows the distribution of f (ψ, Eth) as a function of energy threshold and angle for the value D = 90 Mpc giving rise to the minimum probability. The local minimum (indicated with a cross) is observed for ψ = 9◦ and E
th = 52 EeV. For these values, 20,042 pairs are expected on average from isotropic realizations while 23,101 are observed in the data. Considering the penalization due to the scan in D performed, the probability P to obtain a value of P smaller than 8% from isotropic distributions for any value of D is P ≃ 24%. Finally, the bottom panel of the figure displays the map of the events with E ≥ 52 EeV (black dots). Also drawn is a blue fuzzy circle around each 2MRS galaxy closer than 90 Mpc. All of those circles have radius 9◦, which is the value for which the cross-correlation has maximum significance. Given the very large number of galaxies in 2MRS, essentially all events are within 9◦ of at least one galaxy. Events falling in regions of the plot with denser color will have more galaxies within 9◦ and hence will contribute more pairs to the cross-correlation at this angular scale.
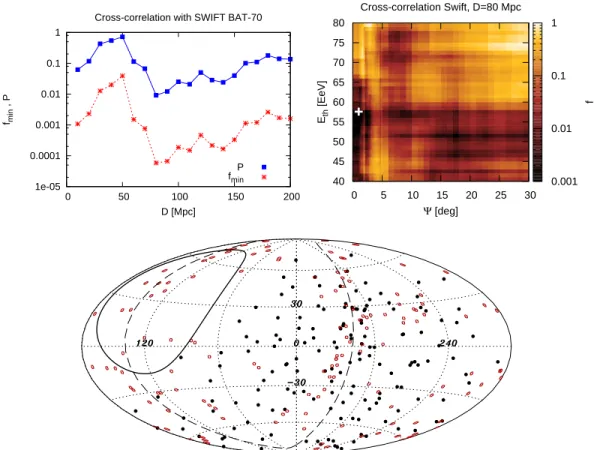
Similar plots to those presented above are included in Figure 6 for the case of the Swift-BAT catalog. As shown in the top-left panel of the figure, the minimum values are reached here for D = 80 Mpc, where fmin ≃ 6×10⁻⁵ and P ≃ 1%. Correspondingly, the top-right panel in the figure shows f (ψ, Eth) as a function of energy and angle at D = 80 Mpc. The local minimum (indicated with a cross) is at ψ = 1◦ and E
th= 58 EeV, where 9 pairs are observed and 1.6 are expected on average. After accounting for the
1e-05 0.0001 0.001 0.01 0.1 1 0 50 100 150 200 fmin , P D [Mpc] Cross-correlation with 2MRS P fmin Cross-correlation 2MRS, D=90 Mpc 0 5 10 15 20 25 30 Ψ [deg] 40 45 50 55 60 65 70 75 80 Eth [EeV] 0.001 0.01 0.1 1 f +
Fig. 5.— Cross-correlation of events with the galaxies in the 2MRS catalog. The top-left panel shows the values of fmin and P as a function of the maximum distance D to the galaxies considered. The top-right panel shows the results of the scan in ψ and Eth for the value D = 90 Mpc corresponding to the minimum values in the top-left plot. The bottom plot shows the sky distribution (in Galactic coordinates) of the events with E ≥ 52 EeV (black dots). Blue fuzzy circles of 9◦ radius are drawn around all of the 2MRS objects closer than 90 Mpc. The dashed line is the field-of-view limit for the Auger Observatory (for θ ≤ 80◦) and the blue solid line corresponds to the Super-Galactic Plane.
penalization due to the scan performed in D, the probability of obtaining a value of P smaller than 1% from isotropic distributions for any value of D is P ≃ 6%. Finally, we show the map of events and objects in the bottom panel. Given the minimum found, we include events with E ≥ 58 EeV and draw circles of 1◦ radius around the BAT AGNs closer than 80 Mpc.
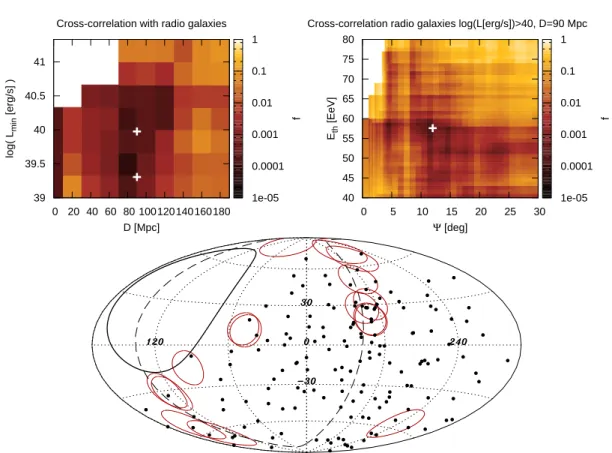
The results of the cross-correlation with jetted radio galaxies are shown in Figure 7. The minimum value fmin ≃ 2×10⁻⁴, with P ≃ 1.4%, is obtained for D = 10 Mpc (see top-left panel). The only object included in this catalog within such a distance is the Centaurus A galaxy. Since the correlation with Cen A is discussed separately in the next section, we consider here the second minimum, which is found for D = 90 Mpc. This
1e-05 0.0001 0.001 0.01 0.1 1 0 50 100 150 200 fmin , P D [Mpc]
Cross-correlation with SWIFT BAT-70
P fmin Cross-correlation Swift, D=80 Mpc 0 5 10 15 20 25 30 Ψ [deg] 40 45 50 55 60 65 70 75 80 Eth [EeV] 0.001 0.01 0.1 1 f +
Fig. 6.— Cross-correlation of events with the AGNs in the Swift-BAT catalog. The top-left panel shows the values of fmin and P as a function of the maximum distance D to the AGNs considered. The top-right panel shows the results of the scan in ψ and Eth for the value D = 80 Mpc corresponding to the minimum values in the top-left plot. The bottom plot shows the sky distribution (in Galactic coordinates) of the events with E ≥ 58 EeV (black dots). Red circles of 1◦radius are drawn around the BAT AGNs closer than 80 Mpc. minimum corresponds to fmin ≃ 4×10⁻⁴ and P ≃ 3.4%. The top-right panel in the figure thus shows the results of the scan in angle and energy for D = 90 Mpc. The minimum occurs for ψ = 4.75◦ and E
th = 72 EeV, where 13 pairs are observed in the data and 3.2 are expected on average. The chance probability for getting P ≤ 1.4% (corresponding to the absolute minimum found) for any value of D is P ≃ 8%. As was done for the other catalogs, the bottom panel displays the map of events and objects corresponding to the minimum found, i.e., E ≥ 72 EeV and D = 90 Mpc. Circles of radius 4.75◦ are drawn around every radio galaxy and the events are indicated with black dots.
While the cross-correlation analysis does not provide us with a significant indication of excesses of pairs with any of the catalogs considered, at any energy, distance and angle, we note that all of them yield minima for similar maximum distances to the objects (∼80
1e-05 0.0001 0.001 0.01 0.1 1 0 50 100 150 200 fmin , P D [Mpc]
Cross-correlation with radio galaxies with jets
P fmin
Cross-correlation radio galaxies, D=90 Mpc
0 5 10 15 20 25 30 Ψ [deg] 40 45 50 55 60 65 70 75 80 Eth [EeV] 0.001 0.01 0.1 1 f +
Fig. 7.— Cross-correlation of events with the AGNs in the catalog of radio galaxies with jets. The top-left panel shows the values of fmin and P as a function of the maximum distance D to the AGNs considered. The top-right panel shows the results of the scan in ψ and Eth for the value D = 90 Mpc corresponding to the (second) minimum in the top-left plot. The bottom plot shows the sky distribution (in Galactic coordinates) of the events with E ≥ 72 EeV (black dots). Red circles of 4.75◦ radius are drawn around the radio galaxies closer than 90 Mpc.
to 90 Mpc) although for different threshold energies and angular scales. The fact that the distances are similar for the three catalogs is actually expected given the existing correlations between catalogs, since AGNs are preferentially located in regions of high density of galaxies. On the other hand, the preference towards D ≃ 80 Mpc is mostly due to the fact that for this value the whole Centaurus Supercluster gets included and in this region there is an excess of high-energy events.
6.2. Cross-Correlation with Bright AGNs
We present here the results of a scan over the minimum source luminosities, consid-ering for the Swift AGNs the reported X-ray band luminosity LXand for the radio-galaxy sample the reported radio luminosity LR, computed per logarithmic energy bin at 1.1 GHz. For Swift we scan from LX= 1042 erg/s up to 1044 erg/s, while for the radio galaxies we scan from LR = 1039erg/s up to 1041erg/s, considering three logarithmic steps per decade, for a total of 7 luminosity values in each case. These luminosity values cover most of the range spanned by the actual luminosities of the AGNs that are present in the catalogs (just 10 AGNs from the Swift sample have LX< 1042 erg/s, while only 3 AGNs from the radio-galaxy sample have LR < 1039 erg/s). Given the additional scan performed in L, we do a slightly coarser scan in D, using 20 Mpc steps to cover from 10 Mpc up to 190 Mpc.
Cross-correlation with Swift AGN
0 20 40 60 80 100 120 140 160 180 D [Mpc] 42 42.5 43 43.5 44 log( L min [erg/s] ) 1e-05 0.0001 0.001 0.01 0.1 1 f +
Cross-correlation Swift log(L[erg/s])>44, D=130 Mpc
0 5 10 15 20 25 30 Ψ [deg] 40 45 50 55 60 65 70 75 80 Eth [EeV] 1e-05 0.0001 0.001 0.01 0.1 1 f +
Fig. 8.— Cross-correlation of events with the AGNs in the Swift catalog as a function of D and Lmin (top-left panel) and detail of the scan in Ψ and Eth for the minimum found (top-right panel). The bottom map (in Galactic coordinates) shows the events with E ≥ 58 EeV together with the Swift AGNs brighter than 1044 erg/s and closer than 130 Mpc, indicated with red circles of 18◦ radius.
resulting values of fmin as a function of the maximum AGN distance and the minimum adopted luminosity Lminin the respective bands (the white region in the top-left corner of the plot is due to the absence of nearby objects above those luminosity thresholds). The values of fmin are obtained after scanning on Ψ and Eth as in the previous subsection. The minimum value of fmin = 2×10⁻⁶ is obtained for D = 130 Mpc and L > 1044 erg/s. The top-right panel shows the details of the scan in Ψ and Eth for D = 130 Mpc and L > 1044 erg/s. The minimum corresponds to the values Ψ = 18◦ and Eth= 58 EeV. For these parameters there are 10 AGNs and 155 events, and 62 pairs are obtained between them while the isotropic expectation is 32.8. The probability to find values fmin< 2×10⁻⁶ in isotropic simulations after making the same scan on Ψ, Eth, Lmin and D is P ≃ 1.3%.
The bottom plot in the figure is the map of events with E ≥ 58 EeV (black dots) and the Swift AGN brighter than 1044 erg/s that are closer than 130 Mpc, represented in the map with red circles of 18◦ radius, which is the value of Ψ found at the min-imum. We see that the events that mostly contribute to the excess of pairs observed are those arriving from directions contained inside the circles centered on IC 4329A (at (ℓ, b) = (317.6◦, 30.9◦)), ESO 506-G027 (at (ℓ, b) = (299.6◦, 35.5◦)), AX J1737.4-2907 (at (ℓ, b) = (358.9◦, 1.4◦)), NGC 612 (at (ℓ, b) = (261.8◦, −77◦)) and NGC 1142 (at (ℓ, b) = (175.9◦, −49.9◦))6.
Figure 9 is similar but for the sample of radio galaxies. The scan in luminosity leads to two minima with very similar probabilities, both for D = 90 Mpc (see the top-left panel). The first one has fmin = 5.1×10⁻⁵ and corresponds to L > 1039.33 erg/s, Ψ = 4.75◦ and Eth = 72 EeV, the angle and energy being equal to the parameters already obtained in the previous subsection (Figure 7). The main difference is that 32 AGNs remain within 90 Mpc once the luminosity cut is imposed, compared to the original sample of 39 AGNs in the flux-limited sample, so that the expected number of pairs becomes 2.4 while 13 are actually observed. The second minimum has fmin = 5.6×10⁻⁵ and corresponds to L > 1040 erg/s. The top-right panel shows the scan in Ψ and E
th for this minimum, which leads to Ψ = 12◦ and E
th= 58 EeV. The bottom plot shows the map of the arrival directions of the events with E ≥ 58 EeV (black dots) and the radio galaxies within 90 Mpc, indicated with red circles of 12◦ radius. We see that most of the excess in the number of pairs arises from the events falling in the circles around the radio galaxies in the Centaurus region. The globally penalized probability of getting fmin < 5.1×10⁻⁵ after a similar scan with the radio galaxies turns out to be in this case P ≃ 11%.
6One of the objects in the sample of 10 AGNs is the BLLac Mrk 421, a powerful gamma-ray emitter
at (ℓ, b) = (179.9◦, 65◦), which has been proposed as a candidate source for the hot spot observed by the
Telescope Array (Fang et al. 2014). This object is in a low-exposure region near the border of the Auger field of view, and there are no events with E > 58 EeV within 18◦ of it.
Cross-correlation with radio galaxies 0 20 40 60 80 100 120 140 160 180 D [Mpc] 39 39.5 40 40.5 41 log( L min [erg/s] ) 1e-05 0.0001 0.001 0.01 0.1 1 f + +
Cross-correlation radio galaxies log(L[erg/s])>40, D=90 Mpc
0 5 10 15 20 25 30 Ψ [deg] 40 45 50 55 60 65 70 75 80 Eth [EeV] 1e-05 0.0001 0.001 0.01 0.1 1 f +
Fig. 9.— Cross-correlation of events with the radio galaxies as a function of D and Lmin (top-left panel) and detail of the scan in Ψ and Eth for the second minimum found (top-right panel). The bottom map (in Galactic coordinates) shows the events with E ≥ 58 EeV together with the radio galaxies brighter than 1040erg/s and closer than 90 Mpc, indicated with red circles of 12◦ radius (i.e., the parameters of the second minimum).
7. The Centaurus A Region
Centaurus A is the nearest radio-loud active galaxy, at a distance of less than 4 Mpc. It is thus an obvious candidate source of UHECRs in the southern sky (Romero et al. 1996). In addition, the nearby Centaurus cluster is a large concentration of galaxies lying in approximately the same direction and at a distance of ∼50 Mpc. The most significant localized excess of UHECR arrival directions reported earlier by the Pierre Auger Collaboration (Abreu et al. 2010) was very close to the direction of Cen A. In particular, we found 13 events with energy above 55 EeV in a circular window of radius 18◦ centered on Cen A, while 3.2 were expected in case of isotropy7. As shown in Section 4.1, 7We note however that the significance of the excess in this particular window of 18◦ and for the
the most significant excess observed in a blind search over the exposed sky with the present data set is also a region close to the direction of Cen A.
Centaurus A 0 5 10 15 20 25 30 Ψ [deg] 40 45 50 55 60 65 70 75 80 Eth [EeV] 0.001 0.01 0.1 1 f + 0 20 40 60 80 100 120 140 160 0 20 40 60 80 100 120 140 160 180 Number of events
Angular distance from Cen A [deg] E>58 EeV
68% isotropic 95% isotropic 99.7% isotropic data
Fig. 10.— Correlation of events with the Cen A radio galaxy as a function of the angular distance and the energy threshold, Eth (top-left panel). The top-right panel shows the cumulative number of events for the threshold Eth= 58 EeV, exploring the whole angular range. The bottom panel displays the map (in Galactic coordinates) of the region around Centaurus A, showing the arrival directions of the events with E ≥ 58 EeV (black dots) and a red circle of 15◦ radius around the direction of Cen A, indicated by a star.
In this section we search for cross-correlations of the arrival directions with the di-rection of Cen A, (ℓ, b) = (−50.5◦, 19.4◦). The search is performed by varying the energy threshold of events between 40 EeV and 80 EeV and by counting events in angular radii ranging from 1◦ to 30◦. To assess the significance of the observed number of events, we compare it to the one expected from isotropic simulations based on the same number of arrival directions as in the data. Figure 10 (top-left panel) shows the fraction f of those simulations that yield more than or an equal number of pairs to the data. The minimum
value of f is fmin = 2×10⁻⁴, corresponding to Eth = 58 EeV and ψ = 15◦. There are 14 events (out of a total of 155) observed while 4.5 are expected on average from isotropic distributions. The fraction of isotropic simulated data sets that yield a smaller value of fmin under a similar scan is P ≃ 1.4%. For completeness, we show in the top-right panel of the figure the number of events with energy above 58 EeV as a function of the angular distance from Cen A for the whole angular range, indicating also the 68, 95 and 99.7% ranges obtained with isotropic simulations. The bottom panel displays the map in Galac-tic coordinates of the Centaurus A region, showing the events with E ≥ 58 EeV (black dots) and a 15◦ radius circle around the direction of Cen A, indicated by a star.
8. Discussion
We have presented several tests to search for signals of anisotropies in the arrival directions of the highest-energy events detected by the Pierre Auger Observatory from 2004 January 1 up to 2014 March 31. The main results obtained are summarized below.
We first updated the fraction of events with energy above 53 EeV correlating with AGNs in the VCV catalog, obtaining a value of 28.1+3.8−3.6%, to be compared with 21% for the isotropic expectation. This test then does not yield significant evidence of anisotropies above this particular energy threshold. Consequently, in all other exploratory analyses performed we have considered the data set down to an energy of 40 EeV.
A thorough search for overdense circular regions all over the sky and for different threshold energies led to the largest deviation from isotropy in a 12◦ radius window cen-tered at (α, δ) = (198◦, −25◦) and for events with energies above 54 EeV, but more sig-nificant excesses are obtained in 69% of isotropic simulations under a similar scan. The autocorrelation of the events was also found to be compatible with the expectations from an isotropic distribution.
No significant excesses were found around the Galactic Center, the Galactic Plane, or the Super-Galactic Plane. This suggests that, if the deflections are not too large, at these energies the sources are unlikely to be Galactic and also that a non-negligible fraction of the flux arises from extragalactic sources that are not very close to the Super-Galactic Plane.
The high degree of isotropy observed in all these tests of the distribution of UHECRs is indeed quite remarkable, certainly challenging original expectations that assumed only few cosmic ray sources with a light composition at the highest energies. If the actual source distribution were anisotropic, these results could be understood for instance as due to the large deflections caused by the intervening magnetic fields if a large fraction of the CRs in this energy range were heavy, as is indeed suggested by mass-composition studies
(Abraham et al. 2010a; Aab et al. 2014). Alternatively, it could also be explained in a scenario in which the number of individual sources contributing to the CR fluxes is large. Indeed, the lack of autocorrelation has been used in Abreu et al. (2013a) to set lower bounds on the density of sources if the deflections involved are not large.
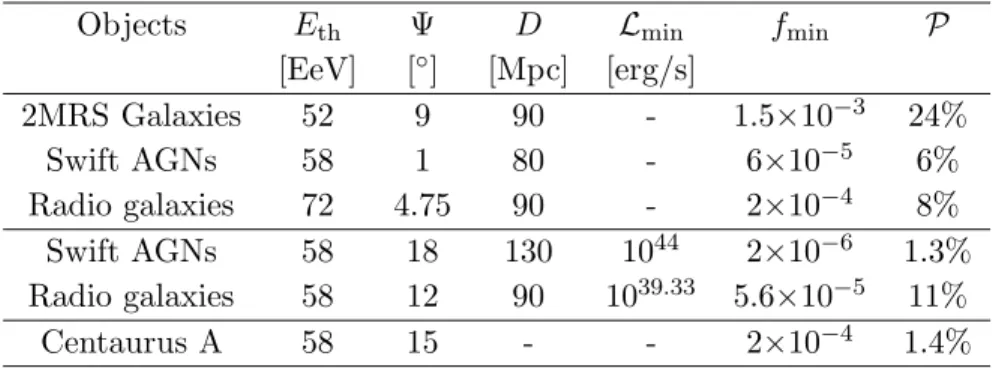
We have also studied the cross-correlation between events and nearby extragalactic objects in different flux-limited catalogs with the aim of identifying possible scenarios of UHECR sources. The parameters corresponding to the minima obtained when scanning in energy, distance and angular scale are listed in Table 1 (first three rows). The penalized probabilities that these minima are due to fluctuations of an isotropic background are of the order of a few percent. In all three cases the object distance corresponding to the minima is D ≃ 80 to 90 Mpc, although it happens for different angular scales and energy thresholds. When a further scan is performed on the minimum intrinsic AGN luminosity, additional minima appear (see rows 4 and 5 in Table 1). We note that the penalized probability is ∼1.3% for Swift AGNs within 130 Mpc and brighter than 1044 erg/s, corresponding to an excess of pairs for events above 58 EeV on angular scales of 18◦, while for the radio galaxies the penalized probability is ∼11%.
Objects Eth Ψ D Lmin fmin P
[EeV] [◦] [Mpc] [erg/s] 2MRS Galaxies 52 9 90 - 1.5×10⁻³ 24% Swift AGNs 58 1 80 - 6×10⁻⁵ 6% Radio galaxies 72 4.75 90 - 2×10⁻⁴ 8% Swift AGNs 58 18 130 1044 2×10⁻⁶ 1.3% Radio galaxies 58 12 90 1039.33 5.6×10⁻⁵ 11% Centaurus A 58 15 - - 2×10⁻⁴ 1.4%
Table 1: Summary of the parameters of the minima found in the cross-correlation analyses. Finally, considering circular windows around the direction of Cen A, the most sig-nificant indication of anisotropy appears for events with E ≥ 58 EeV and for an angular radius of 15◦. After penalizing for the scan on the angle and energy threshold this has a 1.4% probability of arising by chance from an isotropic distribution. Clearly the events contributing to the excess around the direction of Cen A also contribute to the signals found in the cross-correlation searches performed against the different catalogs, which in general have an excess of objects in directions close to that of Cen A.
Overall, none of the tests performed yields a statistically significant evidence of anisotropy in the distribution of UHECRs. It will be in any case interesting to follow with future data the evolution of the excesses found in the cross-correlation studies, par-ticularly from Cen A and from the bright AGNs. If the present level of correlations were maintained in independent data sets, the most efficient test for anisotropy would be the
one that led to the smallest value of fmin at present, i.e., that of the cross-correlation within 18◦ of the events with energy above 58 EeV and the Swift AGNs lying within 130 Mpc and brighter than 1044 erg/s.
Acknowledgments
The successful installation, commissioning, and operation of the Pierre Auger Obser-vatory would not have been possible without the strong commitment and effort from the technical and administrative staff in Malarg¨ue.
We are very grateful to the following agencies and organizations for financial support: Comisi´on Nacional de Energ´ıa At´omica, Fundaci´on Antorchas, Gobierno de la Provincia de Mendoza, Municipalidad de Malarg¨ue, NDM Holdings and Valle Las Le˜nas, in gratitude for their continuing cooperation over land access, Argentina; the Australian Research Council; Conselho Nacional de Desenvolvimento Cient´ıfico e Tecnol´ogico (CNPq), Financiadora de Estudos e Projetos (FINEP), Funda¸c˜ao de Amparo `a Pesquisa do Estado de Rio de Janeiro (FAPERJ), S˜ao Paulo Research Foundation (FAPESP) Grants No. 2010/07359-6 and No. 1999/05404-3, Minist´erio de Ciˆencia e Tecnologia (MCT), Brazil; Grant No. MSMT-CR LG13007, No. 7AMB14AR005, No. CZ.1.05/2.1.00/03.0058 and the Czech Sci-ence Foundation Grant No. 14-17501S, Czech Republic; Centre de Calcul IN2P3/CNRS, Centre National de la Recherche Scientifique (CNRS), Conseil R´egional Ile-de-France, D´epartement Physique Nucl´eaire et Corpusculaire (PNC-IN2P3/CNRS), D´epartement Sciences de l’Univers (SDU-INSU/CNRS), Institut Lagrange de Paris (ILP) Grant No. LABEX ANR-10-LABX-63, within the Investissements d’Avenir Programme Grant No. ANR-11-IDEX-0004-02, France; Bundesministerium f¨ur Bildung und Forschung (BMBF), Deutsche Forschungsgemeinschaft (DFG), Finanzministerium Baden-W¨urttemberg, Helmholtz-Gemeinschaft Deutscher Forschungszentren (HGF), Ministerium f¨ur Wissenschaft und Forschung, Nordrhein Westfalen, Ministerium f¨ur Wissenschaft, Forschung und Kunst, Baden-W¨urttemberg, Germany; Istituto Nazionale di Fisica Nucleare (INFN), Minis-tero dell’Istruzione, dell’Universit`a e della Ricerca (MIUR), Gran Sasso Center for As-troparticle Physics (CFA), CETEMPS Center of Excellence, Italy; Consejo Nacional de Ciencia y Tecnolog´ıa (CONACYT), Mexico; Ministerie van Onderwijs, Cultuur en Wetenschap, Nederlandse Organisatie voor Wetenschappelijk Onderzoek (NWO), Sticht-ing voor Fundamenteel Onderzoek der Materie (FOM), Netherlands; National Centre for Research and Development, Grants No. NET-ASPERA/01/11 and No. ERA-NET-ASPERA/02/11, National Science Centre, Grants No. 2013/08/M/ST9/00322, No. 2013/08/M/ST9/00728 and No. HARMONIA 5 - 2013/10/M/ST9/00062, Poland; Por-tuguese national funds and FEDER funds within Programa Operacional Factores de Com-petitividade through Funda¸c˜ao para a Ciˆencia e a Tecnologia (COMPETE), Portugal;
Ro-manian Authority for Scientific Research ANCS, CNDI-UEFISCDI partnership projects Grants No. 20/2012 and No. 194/2012, Grants No. 1/ASPERA2/2012 ERA-NET, No. PN-II-RU-PD-2011-3-0145-17 and No. PN-II-RU-PD-2011-3-0062, the Minister of Na-tional Education, Programme Space Technology and Advanced Research (STAR), Grant No. 83/2013, Romania; Slovenian Research Agency, Slovenia; Comunidad de Madrid, FEDER funds, Ministerio de Educaci´on y Ciencia, Xunta de Galicia, European Commu-nity 7th Framework Program, Grant No. FP7-PEOPLE-2012-IEF-328826, Spain; Science and Technology Facilities Council, United Kingdom; Department of Energy, Contracts No. DE-AC02-07CH11359, No. DE-FR02-04ER41300, No. DE-FG02-99ER41107 and No. DE-SC0011689, National Science Foundation, Grant No. 0450696, The Grainger Foun-dation, USA; NAFOSTED, Vietnam; Marie Curie-IRSES/EPLANET, European Particle Physics Latin American Network, European Union 7th Framework Program, Grant No. PIRSES-2009-GA-246806; and UNESCO.
REFERENCES
Aab, A., Abreu, P., Aglietta, M., et al. (The Pierre Auger Collaboration) 2013, ArXiv e-prints, arXiv:1307.5059
—. 2014, J. Cosmology Astropart. Phys., 8, 19
—. 2014, ArXiv e-prints, arXiv:1409.4809, Phys. Rev. D, in press —. 2014, ArXiv e-prints, arXiv:1409.5083, Phys. Rev. D, in press
Abbasi, R. U., Abu-Zayyad, T., Allen, M., et al. 2008, PhRvL, 100, 101101 Abbasi, R. U., Abu-Zayyad, T., Al-Seady, M., et al. 2010, PhRvL, 104, 161101
Abbasi, R. U., Abe, M., Abu-Zayyad, T., et al. 2014a, ArXiv e-prints, arXiv:1404.5890 —. 2014b, ArXiv e-prints, arXiv:1408.1726
Abraham, J., Aglietta, M., Aguirre, I. C., et al. (The Pierre Auger Collaboration) 2004, NIMPA, 523, 50
Abraham, J., Abreu, P., Aglietta, M., et al. (The Pierre Auger Collaboration) 2007, Science, 318, 938
—. 2008a, APh, 29, 188
—. 2008b, PhRvL, 101, 061101 —. 2009, APh, 31, 399