Epistemic uncertainty of the structural response of
reinforced concrete members under cyclic loading
due to different material modelling choices
Pereira, N. M., Romão, X and Delgado, R.
Faculty of Engineering of the University of Porto, Portugal
SUMMARY:
Performance-based earthquake engineering methods rely heavily on nonlinear dynamic analysis to determine structural performance. Given the significant number of existing structural and material modelling approaches, the epistemic uncertainty associated to such strategies requires adequate quantification. In this context, the proposed study addresses the quantification of the uncertainty associated to different modelling choices at the member section level. The study analyses the performance of 56 modelling combinations for the numerical simulation of moment-curvatures evolutions obtained from experimental tests on reinforced concrete columns. To determine the performance of the modelling approaches, the results are analysed for three behaviour ranges.
Keywords: Moment-curvature analysis, fibre modelling, epistemic uncertainty, reinforced concrete
1. INTRODUCTION
Performance-based earthquake engineering (PBEE) needs adequate methods of analysis to determine the structural behaviour and the definition of quantifiable targets to measure performance. Considering that performance targets can be established for demand levels ranging from linear elastic behaviour up to the development of structural collapse, nonlinear dynamic analysis is the logical choice to adequately quantify structural behaviour under earthquake loading. However, structural performance associated to a certain damage limit state is influenced by several sources of uncertainty that need to be considered by the PBEE framework. The earthquake record-to-record variability of structural demand and the uncertainty associated to the randomness of the material properties are some of the sources of uncertainty commonly addressed in past research. Given the number of available structural and material models, the epistemic uncertainty associated to different modelling strategies is another source of uncertainty that must also be analysed. As a first step towards a comprehensive analysis of the epistemic uncertainty associated to the numerical modelling of reinforced concrete (RC) members, the proposed study analysed the structural response variability at the member section level resulting from different modelling choices. The study analyses the performance of 56 fibre modelling combinations for the numerical simulation of moment-curvatures evolutions obtained from experimental tests on five RC columns. To determine the performance of the modelling approaches, the results are analysed for three behaviour ranges.
2. UNIAXIAL MATERIAL CONSTITUTIVE MODELS
The simulation of the flexural behaviour of RC sections using fibre models implies that sections must be divided into three zones, where each one is assigned to a different uniaxial material law. The first zone is the area bounded by the centreline of the transverse reinforcement which is made of concrete with a strength enhanced by the confinement effect. The second zone, which bounds the outside of the first zone, is made of unconfined concrete and will govern the development of spalling and the consequent degradation of strength and stiffness. The third zone models the longitudinal reinforcing steel (RS). The characteristics of the RS material law govern several aspects of the flexural behaviour of the section, especially for high levels of deformation. To observe the influence of the characteristics
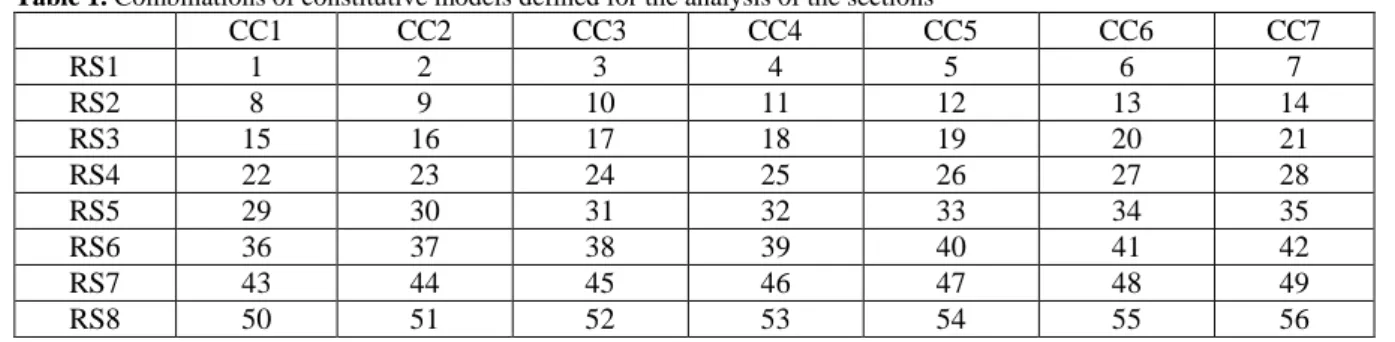
of the material models representing each zone, the presented study analysed the flexural behaviour of five RC sections under cyclic loading using 56 combinations of concrete (CC) and RS models. The 56 combinations involved seven CC models and eight RS models and are numbered according to Table 1. A brief description of the CC and RS selected material models is provided in the following.
Table 1. Combinations of constitutive models defined for the analysis of the sections
CC1 CC2 CC3 CC4 CC5 CC6 CC7 RS1 1 2 3 4 5 6 7 RS2 8 9 10 11 12 13 14 RS3 15 16 17 18 19 20 21 RS4 22 23 24 25 26 27 28 RS5 29 30 31 32 33 34 35 RS6 36 37 38 39 40 41 42 RS7 43 44 45 46 47 48 49 RS8 50 51 52 53 54 55 56
2.1. Selected constitutive models for the concrete
Several models were developed in the past to represent the behaviour of confined and unconfined concrete. In general, all models have a similar initial branch until the maximum strength is reached. The fundamental differences between most CC models are in the modelling of the concrete behaviour after the point of peak strength, namely regarding the slope of the degrading branch, the level of residual strength and corresponding strain, and the level of ultimate compressive strain. In the present study, seven models were selected from the OpenSees material library to represent both confined and unconfined concrete. For the confined concrete, four of the models were defined according to the Scott
et al. (1982) model with a residual strength of 20% of the peak compressive strength: the CC1 model
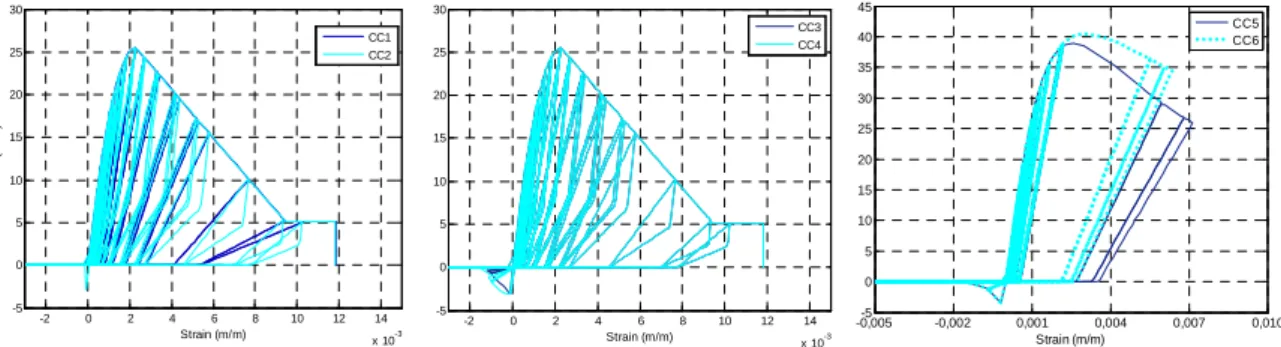
has no tensile strength; the CC2 model has a linear degradation of the tensile strength based on the linear softening defined by Yassin (1994) (in this case, it is considered that the tensile strength drops to zero after reaching its peak value); the CC3 model that tries to mimic a tension-stiffening mechanism using a linear degradation compatible with the strain limits defined by Kaklauskas and Ghaboussi (2001); the model CC4 uses an exponential tensile degradation after cracking, according to the parameters defined by Berry and Eberhard (2008). The remaining three models considered were based on the model by Popovics (1973). Model CC5 uses the Mander et al. (1988) proposal for the modelling of confined and unconfined concrete with the Karsan and Jirsa (1969) hysteric rules. Model CC6 considers the same behaviour envelope and hysteresis rules, but defines the reference points of the backbone curve using the EC8-3 (CEN, 2005) proposal. Finally, the CC7 model uses the Chang and Mander (1994) proposal simplified by Waugh (2007). Figure 1 represents the referred models under cyclic behaviour. With respect to the models for the unconfined concrete, the relations considered are those of models CC1 to CC7 with differences being on the level of the residual strength (which is now zero) and on the corresponding level of strain (which defines the onset of spalling) assumed equal to 0.005 (εspall), according to the ranges in Priestley et al. (2007) and Caltrans (2006). 2.2. Modelling strategy to represent the effects of spalling and crushing
The spalling and crushing phenomena are behaviour degradation mechanisms inherent to RC elements that imply a reduction of the section geometry and, consequently, of its stiffness and strength. To simulate these effects, the compressive behaviour of the materials was modified for strains higher than specific thresholds. For strains higher than such thresholds, the response of the concrete fibres is considered to have zero strength and slope (i.e. a null contribution to the strength of the section). To simulate the effect of spalling, a limiting strain εspall = 0.005 was considered for the unconfined
concrete. To simulate the onset of the confined concrete crushing, three alternatives were considered according to the selected concrete models. For models CC1 to CC4, this compressive strain limit was set by the maximum strain defined by Scott et al. (1982). In models CC5 and CC7 it was defined by the crushing strain limit given by Priestley et al. (2007), while in model CC6 it was set by the ultimate strain according to the proposal of Biskinis and Fardis (2009).
2.3. Selected constitutive models for the reinforcing steel
Four RS models were considered in the present study. Model RS1 is a simple bilinear model with non-zero post-yield hardening. Model RS2 is a variant of RS1 that includes isotropic hardening. Model RS3 is the Menogotto and Pinto (1973) model with isotropic hardening while RS4 is the same model with no cyclic hardening. Models RS5, RS6 and RS7 were considered according to three variants of the enhanced RS model by Kunnath et al. (2009). Model RS5 is the reference form of the model. The RS6 model includes strength degradation effects with the degradation parameters proposed by Berry and Oberhard (2008). The RS7 model is a variant of RS5 that considers the Dakhal and Maekawa (2002) steel buckling rules. Finally, the model RS8 represents the Dodd and Restrepo (1995) proposal.
-2 0 2 4 6 8 10 12 14 x 10-3 -5 0 5 10 15 20 25 30 Strain (m/m) S tr e s s ( M P a ) CC1 CC2 -2 0 2 4 6 8 10 12 x 1014-3 -5 0 5 10 15 20 25 30 Strain (m/m) CC3 CC4 -0,005 -0,002 0,001 0,004 0,007 0,010 -5 0 5 10 15 20 25 30 35 40 45 Strain (m/m) CC5 CC6
Figure 1. Confined concrete models: CC1 and CC2 (left), CC3 and CC4 (centre), CC5 and CC6 (right).
-0.03 -0.02 -0.01 0 0.01 0.02 0.03 0.04 -600 -400 -200 0 200 400 600 Strain (m/m) S tr e s s ( M P a ) RS1 RS2 -0.12 -0.1 -0.08 -0.06 -0.04 -0.02 0 0.02 0.04 -600 -400 -200 0 200 400 600 Strain (m/m) RS3 RS4 -0.04 -0.02 0 0.02 0.04 0.06 -600 -400 -200 0 200 400 600 Strain (m/m) S tr e s s ( M P a ) RS5 RS8
Figure 2. Reinforcing steel models: RS1 and RS2 (left), RS3 and RS4 (centre), RS5 and RS8 (right).
3. DESCRITION OF THE PROPOSED STUDY
The presented study addresses the moment-curvature analysis of five column sections corresponding to the experimental tests conducted by Rodrigues et al. (2010). The selected cases are those referenced as N01, N05, N06, N09 and N10 and correspond to experimental tests of RC columns subjected to uniaxial cyclic loading under constant axial loads. The numerical modelling of the cross sections and the material properties were defined according to the experimental values. Details of the test results, the test setup and the material properties can be found in Rodrigues et al. (2010). After obtaining the curvature histories from the experimental results, they were applied to the sections to determine the corresponding moments by equilibrium conditions. The calculations were performed using OpenSees. Figure 3 presents the layout of the considered cross sections and the corresponding level of normalized axial load involved in each test. Columns N01, N05 and N09 were tested along their strong direction, while columns N06 and N10 were tested along their weak direction.
To obtain an objective comparison between experimental and numerical results, the comparative analyses were performed for specific behaviour ranges separated by two limit states connected to the performance of RC members. These comparisons were carried out in terms of peak moments for specific levels of curvature and in terms of energy dissipation. The following three ranges of behaviour were considered: a first range representing the behaviour up to the onset of yielding (the yielding of the first bar in tension defines the first limit state DLS1); a second range representing the
behaviour between DLS1 and the onset of the spalling of the concrete cover, defined when the
outermost fibre of the unconfined concrete reaches εspall (the occurrence of spalling defines the second
limit state DLS2); a third range representing the behaviour after DLS2 and involves concrete crushing and the fracture of steel rebars.
φ φ φ φ φ φ φ φ φ φ φ ν=0.04 ν=0.12 ν=0.12 ν=0.08 ν=0.08
Figure 3. Geometry and reinforcement characteristics of the considered sections.
4. ANALYSIS OF THE RESULTS OBTAINED BY THE PROPOSED STUDY 4.1. Global comparison between the numerical and the experimental results
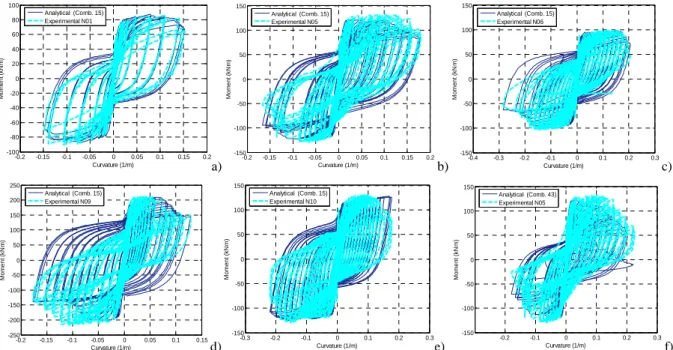
Before presenting the separate analysis for each of the referred behaviour ranges, an overview of the global responses was performed to obtain a general description of the type of differences that can be expected and to provide physical explanations for some of the numerical behaviours that were observed. To illustrate the global responses that were obtained, Figs. 4a to 4e present the experimental and the numerical moment-curvature evolutions obtained for the model combination 15 (see Table 1). This combination was selected since it provides a match between numerical and experimental results which is representative of the results obtained.
-0.2 -0.15 -0.1 -0.05 0 0.05 0.1 0.15 0.2 -100 -80 -60 -40 -20 0 20 40 60 80 100 Curvature (1/m) M o m e n t (k N m ) Analytical (Comb. 15) Experimental N01 a) -0.2 -0.15 -0.1 -0.05 0 0.05 0.1 0.15 0.2 -150 -100 -50 0 50 100 150 Curvature (1/m) Mo m e n t (k N m ) Analytical (Comb. 15) Experimental N05 b) -0.4 -0.3 -0.2 -0.1 0 0.1 0.2 0.3 -150 -100 -50 0 50 100 150 Curvature (1/m) M o m e n t (k N m ) Analytical (Comb. 15) Experimental N06 c) -0.2 -0.15 -0.1 -0.05 0 0.05 0.1 0.15 -250 -200 -150 -100 -50 0 50 100 150 200 250 Curvature (1/m) M o m e n t (k N m ) Analytical (Comb. 15) Experimental N09 d) -0.3 -0.2 -0.1 0 0.1 0.2 0.3 -150 -100 -50 0 50 100 150 Curvature (1/m) M o m e n t (k N m ) Analytical (Comb. 15) Experimental N10 e) -0.2 -0.1 0 0.1 0.2 0.3 -150 -100 -50 0 50 100 150 Curvature (1/m) M o m e n t (k N m ) Analytical (Comb. 43) Experimental N05 f) Figure 4. Comparison of numerical and experimental moment-curvature results: N01 (a), N05 (b) N06 (c), N09
(d) and N10 (e) for combination 15, and N05 for combination 43 (f).
The analysis of Fig. 4 indicates there is a fairly good agreement between the experimental and the numerical evolutions for the full range of the behaviour. An overall analysis of the evolutions from all the combinations shows similar results. In this context, it should be noted that, in general, strength degradation effects for higher deformation levels are well captured, a fact indicating that the modelling
strategy presented in Section 2.2 is efficient, particularly when the CC1-CC4 models are considered. Some differences were found between experimental and numerical results with respect to the initial stiffness and hysteresis loops for low levels of deformation, indicating differences in the dissipated energy in this range of behaviour. After yielding, the global hysteretic behaviour of the sections follows the hysteresis of the RS models and larger differences are observed in cases where the Bauschinger effect is not considered. For high levels of damage, larger differences begin to appear, both in the peak values and in the unloading/reloading stiffness. This issue was particularly significant in section N09 because of the asymmetry of the experimental degradation effects that induces larger differences for one of the bending signs. The global analysis of the results indicates that the more important differences occur for damage levels after spalling. In some of the model combinations, the numerical evolution overestimates the flexural strength because steel hardening effects govern the response path (see Fig. 4e). This situation is only reversed when the crushing of the concrete core fibres occurs and starts to degrade the flexural strength of the section. On the other hand, combinations involving RS models with no hardening and with additional strength degradation effects lead to post-spalling levels of flexural strength that underestimate the experimental strength (see Fig. 4f).
To obtain global parameters measuring the adequacy of the model combinations, the
numerical-to-experimental ratio of the peak moments (Mnum/Mexp) and the total energy dissipated in each cycle were
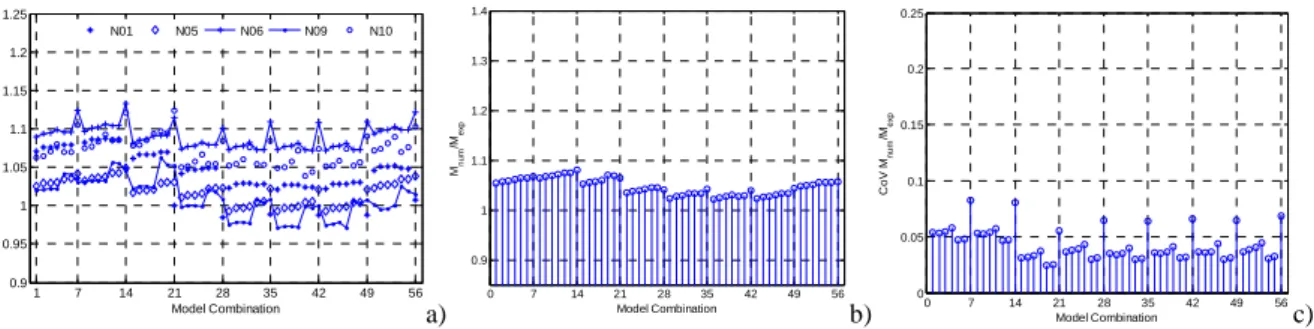
calculated for each modelling combination and for each section. Figure 6a presents the mean values of the Mnum/Mexp ratios for each section and each combination. The mean values represent the mean of
the Mnum/Mexp ratios obtained for all the cycles of the behaviour evolution curve (for each cycle, the
peak moments are those corresponding to the peak curvature values of each cycle of the numerical and experimental evolutions). In addition, Fig. 6b presents the coefficient of variation (CoV) of the ratios also obtained for all the cycles.
1 7 14 21 28 35 42 49 56 0.9 0.95 1 1.05 1.1 1.15 1.2 1.25 Model Combination Mn u m /M e xp N01 N05 N06 N09 N10 1 7 14 21 28 35 42 49 56 0.05 0.1 0.15 0.2 0.25 0.3 0.35 0.4 Model Combination C o V M n u m / M e xp N01 N05 N06 N09 N10
Figure 6. Statistics of the Mnum/Mexp ratio: (a) mean value and (b) CoV for each column and model combination. As can be observed in Fig. 6a, for a given column, the influence of the CC models follows a similar pattern when combined with each RS model. Globally, the mean value of the Mnum/Mexp ratio is
between 0.92 and 1.18, which implies a 26% variation between all the models and columns. The lower ratios are obtained when concrete models with no ductility in tension are used (CC1 and CC2) and the higher values when CC7 is used, irrespective of the RS model considered. With respect to the influence of the RS models, it is seen that combinations involving the bilinear models RS1 and RS2,
as well as the RS3 model, lead to higher Mnum/Mexp ratios. On average, the models RS5 to RS7 lead to
lower ratios than those obtained for the other models considered. The lower values were found for RS7 and are related to the inclusion of the buckling effect that reduces the strength for high levels of deformation. When analysing the CoV values presented in Fig. 6b, they are seen to range between 7% and 27%, with the larger values being observed for section N09 (16%-27%). The higher CoV values obtained for this section are related with the inability of the models to capture the asymmetric evolution of the experimental response.
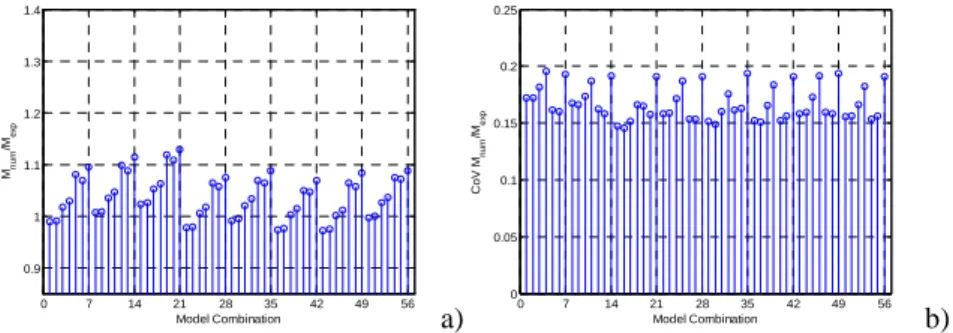
Figure 7 presents the statistical analysis of the Mnum/Mexp ratio evaluated for each modelling
combination considering all the peak values of all the columns. As can be observed from Fig. 7b, most of the CoV values are between 15% and 20%. Higher values were obtained when using concrete models CC4 and CC7, which represent the modelling options with larger softening in tension. The variability between all the RS models is low and no relevant differences can be identified. With respect to the mean of the Mnum/Mexp ratios, these have a lower variability than those of Fig. 6. The
mean values obtained range from 0.97 to 1.13. As can be observed in Fig.7a, when selecting a given concrete model, it can be seen that the variability resulting from the steel models is also low, especially between models RS4 to RS8 for which the differences are lower than 2% for the concrete
models CC1 and CC2. The larger values of the mean of the Mnum/Mexp ratio are generally found for the
models CC5 to CC7. These models have a similar ductility in compression, which is higher than that of models CC1 to CC4, a fact that explains the differences found. In terms of the concrete models based on Scott et al. (1982), those with no softening after the peak tensile strength or with no tensile strength at all (CC1 and CC2) provided a better agreement for all sections. To complement the
previous results, Fig. 8 presents the mean Mnum/Mexp ratio and the corresponding CoV for the results
obtained from all the combinations for each section. The analysis of the results of Fig. 8a, combined with those in Fig. 4, reveals that similar mean Mnum/Mexp ratios are found when considering all the
model combinations for each section and that, on average, the response variations due to the several model combinations is relatively low. Moreover, when analysing the corresponding variability (Fig. 8b), it can be seen that sections N05 (that presents numerical values in one bending sign which are lower than the experimental ones) and N09 (which exhibited an asymmetric experimental behaviour) are those presenting the higher CoV values. In opposition, section N01, which involves deformation levels with lower strength degradation, presents smaller CoVs since the differences between the modelling approaches are less significant for that range of behaviour. Finally, it is noted that when considering, for all the sections, all the peaks of the full range evolution curves, a mean Mnum/Mexp
ratio of 1.04 and a corresponding CoV of 0.17 were obtained.
0 7 14 21 28 35 42 49 56 0.9 1 1.1 1.2 1.3 1.4 Model Combination M n u m /M e xp a) 0 7 14 21 28 35 42 49 56 0 0.05 0.1 0.15 0.2 0.25 Model Combination C o V M n u m /M e xp b)
Figure 7. Statistics of the Mnum/Mexp ratio of all columns for each model combination: (a) mean and (b) CoV
N01 N05 N06 N09 N10 0.9 1 1.1 1.2 1.3 1.4 Mn u m /M e x p a) 0 N01 N05 N06 N09 N10 0.05 0.1 0.15 0.2 0.25 C o V M n u m /Me xp b)
Figure 8. Statistics of the Mnum/Mexp ratio of all model combinations for each column: (a) mean and (b) CoV With respect to the energy dissipation during cyclic loading, the analysis was performed in terms of cumulative energy dissipation and using the ratio between the numerical dissipated energy and the one
obtained from the experimental results (CEnum/CEexp ratio). The main focus of this part of the analysis
was on the quantification of the accuracy of the unloading/reloading paths of the numerical behaviour curves. It is considered that when the agreement between the numerical and the experimental energy dissipation is better, the accuracy of the numerical model in representing cyclic degradation and the unloading/reloading paths is higher. By analysing Fig. 9, it can be seen that the concrete models CC1 to CC4 generally lead to lower levels of energy dissipation when compared to models CC5 to CC7. The latter present higher energy dissipation when compared to the remaining concrete models by considering a higher concrete crushing strain and a lower slope of the post-peak curve to reflect the
influence of the large ultimate tensile strain of the reinforcing steel which was obtained from the material tests (Rodrigues et al., 2010). Therefore, the results obtained show the influence of these parameters since higher levels of energy dissipation energy were observed for moderate to high deformation levels. The differences reflecting the influence of the several RS models in terms of the
Mnum/Mexp ratios (Fig. 7) can be seen to increase when analysing the energy dissipation. The smaller
ratios, close to 1.05, were obtained when considering the RS5 to RS8 steel models, while the larger ones, of about 1.60, were found when using the RS2 steel model. Intermediate results were obtained with the RS4 model, a model that includes Bauschinger effects but has no cyclic hardening. The
models RS5 to RS8 resulted in smaller values of the mean CEnum/CEexp ratio that, when combined with
the CC5 or CC6 concrete models, lead to a mean CEnum/CEexp ratio of 1.16 and, when combined with
the models CC1 to CC4, lead to a value of 1.10. The presented global comparison provides a general overview of the overall differences found for the full range of the section behaviour evolutions due to the selected material models. Still, the behaviour averaging that is implied when considering the full range of the behaviour evolutions might be masking the fact that, for some behaviour ranges, a given combination could overestimate the response while underestimating it for another range. Therefore, to mitigate this effect, the analysis of the behaviour evolutions is presented separately in the following for the three ranges of behaviour previously referred. The comparisons were made by analysing the
Mnum/Mexp ratio and using the DLS1 and DLS2 thresholds to separate the behaviour ranges.
0 7 14 21 28 35 42 49 56 0 0.2 0.4 0.6 0.8 1 1.2 1.4 1.6 1.8 Model Combination C E n u m /C Ee xp a) 0 7 14 21 28 35 42 49 56 0 0.05 0.1 0.15 0.2 0.25 Model Combination C o V C En u m /C E exp b)
Figure 9. Statistics of the CEnum/CEexp ratio of all columns for each model combination: (a) mean and (b) CoV 4.2. Comparison of the numerical and experimental responses up to the onset of yielding
The first behaviour range considered goes up to the onset of the section yielding, which represents the DLS1 limit state and is defined herein as the yielding of the first bar of the section. After identifying the value of the yield curvature, and the corresponding moment, the peak moments of all the cycles up to the development of DLS1 were selected for comparison. The analysis of the stress-strain behaviour of the numerically modelled steel bars has shown that, for the considered yield strain, all the model combinations predicted the same yield curvature for a given section. However, the corresponding moments obtained numerically exhibited some differences with respect to the experimental one. The experimental yield moment was considered to be the moment from the experimental behaviour evolution which corresponds to an abscissa equal to the numerical yield curvature. Considering all the Mnum/Mexp ratios corresponding to the peak moments of the cycles up to the development of DLS1,
Fig. 10a presents the mean value of such ratios obtained for each combination of models and for each section. The variations of the Mnum/Mexp ratios were found to be between 0.75 and 1.53 (for N09).
Given the wide range of such results, it should be pointed out, as referred in Section 3.1, that differences in the hysteretic behaviour and in the energy dissipation were found for the elastic range, with the experimental reloading stiffness being significantly different from the (numerical) elastic stiffness. Still, the results also indicated that the type of RS model considered did not influence significantly the response in this range. On the other hand, the fact that a given concrete model
exhibits tensile strength appears to play a fundamental role. By analysing the mean of the Mnum/Mexp
ratios of all the sections for each modelling combination (Fig. 10b), it can be seen that the ratios are very sensitive to the modelling of the tensile behaviour of the concrete. The best results were found for the cases were no tensile strength or no tension ductility (where the tensile strength drops to zero after cracking) was modelled, with ratios of about 0.93 to 0.96. On the other hand, for the remaining
concrete models, the ratio vary from 1.19 (CC3) to 1.27 (CC7). Moreover, the variability of the mean
Mnum/Mexp ratio up to DLS1 is independent of the selected RS model. A global analysis of the results
obtained for all the columns and all the model combinations shows that the mean and the CoV of the
Mnum/Mexp ratios were found to be 1.15 and 0.20, respectively. On the other hand, when considering
only the model combinations involving the CC1 and CC2 models, the global Mnum/Mexp ratio found has
a mean of 0.94 and a CoV of 0.16.
1 7 14 21 28 35 42 49 56 0.7 0.8 0.9 1 1.1 1.2 1.3 1.4 1.5 1.6 Model Combination Mn u m /Me xp N01 N05 N06 N09 N10 a) 0 7 14 21 28 35 42 49 56 0.9 1 1.1 1.2 1.3 1.4 Model Combination Mn u m /M e xp b) 0 7 14 21 28 35 42 49 56 0 0.05 0.1 0.15 0.2 0.25 Model Combination Mn u m /M e xp c) Figure 10. Results for DLS1: Mnum/Mexp ratios by section for each model combination (a); mean (b) and CoV (c)
of the Mnum/Mexp ratios up to DLS1 for each model combination.
3.3. Comparison of the numerical and experimental responses up to the onset of the spalling The second behaviour range considered goes from the onset of the section yielding up to the onset of the spalling of the concrete cover, which represents the DLS2 limit state and is defined herein as the loss of strength, for the strain εspall, of the outermost fibre of the concrete cover. The first step towards the analysis of the spalling was to evaluate the curvature corresponding to the loss of strength of the outermost fibre of the cover concrete. With this threshold, the range of moments from DLS1 and the
curvature corresponding to the beginning of spalling were defined along with the Mnum/Mexp ratios of
the corresponding peak moments. Figure 11a presents the mean Mnum/Mexp ratio obtained for each
model combination and for each section. It can be seen that the higher ratios were found for section N06, ranging from 1.07 to 1.13, and that the lower ratios were obtained for section N09, ranging from 0.97 to 1.06. These lower values may, nevertheless, be understood in light of the asymmetry of the N09 global response which implies that, for one of the bending signs, lower values of the numerical response will occur when compared to the experimental ones. Figures 11b and 11c present the mean
and the CoV of the Mnum/Mexp ratios for each combination and for all the sections, corresponding to the
peak moments of the cycles within the current behaviour range.
1 7 14 21 28 35 42 49 56 0.9 0.95 1 1.05 1.1 1.15 1.2 1.25 Model Combination Mn u m /M e xp N01 N05 N06 N09 N10 a) 0 7 14 21 28 35 42 49 56 0.9 1 1.1 1.2 1.3 1.4 Model Combination Mn u m /M e xp b) 00 7 14 21 28 35 42 49 56 0.05 0.1 0.15 0.2 0.25 Model Combination C o V M n u m /M e xp c) Figure 11. Results for DLS2: Mnum/Mexp ratios by section for each model combination (a); mean (b) and CoV (c)
of the Mnum/Mexp ratios up to DLS2 for each model combination.
It can be seen that the large differences resulting from different modelling combinations are now significantly reduced. Therefore, the importance of the concrete tensile behaviour modelling which was observed up to DLS1 becomes unimportant in this range. As can be seen by the results, the
Mnum/Mexp ratios are similar for all the models considered, both in terms of the mean value and of the
CoV. The overall mean values vary from 1.02 to 1.08, with the higher value found for combinations with CC7. With respect to the influence of the steel models, the ratios obtained with RS5 to RS7 present lower values than those of the remaining models but differences between all the models are
very low. Considering all the data for the yielding to the spalling range and averaging over all the
sections and all the models, the Mnum/Mexp ratios have a mean value equal to 1.05 and a CoV of 0.13.
3.4. Comparison of the numerical and experimental responses after the spalling
The failure of the section after the spalling can occur due to several different mechanisms, and the agreement between the numerical and experimental responses will depend on the ability of the selected models to predict with sufficient accuracy the occurrence of such mechanisms. After the spalling, the section can present buckling of the reinforcement bars, crushing of the concrete core or loss of capacity due to the degradation of the reinforcing steel. Since assuming a specific order for the occurrence of these phenomena may lead to biased comparative results, the spalling of the concrete cover concrete (DLS2) was considered to be the onset of the section degradation, and the subsequent degradation mechanisms were all considered in a single behaviour range starting at DLS2 and going until the end of the recorded experimental results. Based on these considerations, the peak moments
occurring after DLS2 were obtained to define the corresponding Mnum/Mexp ratios. Figure 12 presents
the analysis of these ratios. According to Fig. 12a, which presents the mean Mnum/Mexp ratio obtained
for each model combination and for each section, there is a significant variability of the Mnum/Mexp
ratios for each combination and section which range between 0.82 and 1.23. Still, a specific trend with respect to the influence of the concrete models can be identified. This trend is more clear in Fig. 12b which presents the comparison of the mean values of the ratios obtained for each modelling combination. With respect to the influence of the concrete models, it is observed that the considered level of ultimate concrete strain influences the results obtained. Higher ratios were observed for models CC5 to CC7 when compared to those obtained for models CC1 to CC4. This fact indicates that the results obtained for the present range are sensitive to the definition of the ultimate strain of the concrete and to the consequent simulation of the concrete compressive failure. With respect to the influence of the steel model, it is observed that models including strength degradation effects induced ratios smaller than 1.0, with the lower values being obtained with models RS6 and RS7 (around 0.88). Finally, it is noted that when considering the results obtained for all the models and columns, the
Mnum/Mexp ratios were found to have a mean value of 0.97 and a CoV of 0.19.
1 7 14 21 28 35 42 49 56 0.8 0.85 0.9 0.95 1 1.05 1.1 1.15 1.2 1.25 1.3 Model Combination Mn u m /M e xp N01 N05 N06 N09 N10 a) 0 7 14 21 28 35 42 49 56 0.9 1 1.1 1.2 1.3 1.4 Model Combination Mn u m /M e xp b) 0 7 14 21 28 35 42 49 56 0 0.05 0.1 0.15 0.2 0.25 Model Combination C o V M n u m /M e xp c) Figure 12. Results for the post-DLS2 behaviour range: Mnum/Mexp ratios by section for each model combination
(a); mean (b) and CoV (c) of the Mnum/Mexp ratios for each model combination.
4. CONCLUSIONS
Since there are currently a number of structural and material models available for the numerical simulation of the behaviour of RC members under earthquake loading, the uncertainty associated to such different modelling strategies is a source of uncertainty that must be analysed. As a first step towards a comprehensive analysis of the epistemic uncertainty associated to the numerical modelling of RC members, a study analysing the structural response variability at the section level resulting from different modelling choices was proposed. The study analysed the performance of 56 fibre modelling combinations for the numerical simulation of moment-curvatures evolutions obtained from five experimental tests on RC columns. To determine the performance of the modelling approaches, the results are analysed for three behaviour ranges: up to the onset of yielding (DLS1), between yielding and up to spalling (DLS2), and after spalling. The performance of the modelling approaches was
analysed essentially in terms of the numerical-to-experimental ratio of the peak moments (Mnum/Mexp).
The analysis of the results indicated that modelling the elastic range of the behaviour up to DLS1 with a close match to the experimental data is difficult. The results indicated that the type of steel model considered did not influence significantly the response in this range, but considering (or not) the concrete tensile strength appears to play a fundamental role. With respect to the behaviour range between DLS1 and DLS2, the results indicated that, within this range, the differences between the several modelling combinations are now significantly reduced. Furthermore, the best average match between the numerical results and the experimental ones was obtained for this range. On the other hand, for the last behaviour range, the results obtained were seen to be sensitive to the adequate definition of the concrete ultimate strain and to the consequent simulation of the concrete compressive failure, as well as to the characteristics of the strength degradation effects of the selected steel model. Furthermore, it was seen that no single combination of numerical models is able to produce a best fit throughout the whole range of behaviour for the five sections modelled. Still, the RS6 steel model provides adequate results for the full range of behaviour. On the other hand, for the behaviour range up to DLS2, the concrete model CC2 is recommended, while for the simulation of larger deformation ranges, model CC6 is suggested instead.
ACKNOWLEDGEMENTS
Financial support of the Portuguese Foundation for Science and Technology, through the research grant PTDC/ECM/108098/2008 (Development and calibration of seismic safety assessment methodologies for existing buildings according to the Eurocode 8 - Part 3), is gratefully acknowledged.
REFERENCES
Berry, M., Eberhard, M. (2008) Performance modeling strategies for modern reinforced concrete bridge columns. PEER Report 2007/07, PEER, University of California.
Biskinis, D, Fardis M. (2009) Deformations of concrete members at yielding and ultimate under monotonic or cyclic loading (including repaired and retrofitted members). Technical Report. University of Patras. Caltrans (2006) Caltrans Seismic Design Criteria. Version 1.4. California Department of Transportation. CEN (2005) EN 1998 - Eurocode 8: design of structures for earthquake resistance – Part 3: Assessment and
retrofitting of buildings.
Dodd, L.L., Restrepo-Posada, J. (1995) Model for predicting cyclic behaviour of reinforcing steel. Journal of
Structural Engineering 121:3, 433-445.
Kaklauskas G., Ghaboussi J. (2001) Stress-strain relations for cracked tensile concrete from RC beam tests.
Journal of Structural Engineering 127:1, 64-73.
Karsan, I., Jirsa, J. (1969) Behavior of concrete under compressive loading. Journal of Structural Division
95:12, 2543-2563.
Kunnath, S., Heo, Y., Mohle, J. (2009) Nonlinear uniaxial material model for reinforcing steel bars. Journal of
Structural Engineering 135:4, 335-343.
Mander, J., Priestley, M.J.N., Park, R. (1988) Theoretical stress-strain model for confined concrete. Journal of
Structural Engineering 114:8, 1804-1825.
Menegotto, M., Pinto, P.E. (1973) Method of analysis for cyclically loaded r.c. plane frames including changes in geometry and non-elastic behavior of elements under combined normal force and bending. Symposium on Resistance and Ultimate Deformability of Structures Acted On by Well Defined Repeated Loads, IABS Reports Vol. 13. Lisbon.
Popovics, S. (1973). A numerical approach to the complete stress strain curve for concrete. Cement and
Concrete Research 3:5, 583-599.
Priestley, M.J.N., Calvi, G., Kowalsky, M. (2007). Displacement-based seismic design of structures. IUSS Press. Rodrigues, H., Arêde, A., Varum H., Costa A. (2010). Experimental study on the biaxial bending
cyclic behaviour of RC columns. 14th European Conference on Earthquake Engineering, Beijing, China. Scott, B., Park, R., Priestley, M.J.N. (1982) Stress-strain behavior of concrete confined by overlapping hoops at
low and high strain rates. Journal of American Concrete Institute 79:1, 13-27.
Waugh, J. (2007) Nonlinear analysis of T-shaped concrete walls subjected to multi-directional displacements. PhD dissertation. Iowa State University.
Yassin, M. (1994). Nonlinear analysis of prestressed concrete structures under monotonic and cycling loads. PhD dissertation, University of California.