UniversidadedeAveiro
2014 Departamento de Economia, Gestão e Engenharia Industrial
JOÃO PEDRO DOS
SANTOS SILVA
Decision-Making Process in Erasmus Student Mobility to
Portugal: Case Study
Processo de Tomada de Decisão na Mobilidade de
Estudantes Erasmus para Portugal: Caso de Estudo
UniversidadedeAveiro
2014 Departamento de Economia, Gestão e Engenharia Industrial
JOÃO PEDRO DOS
SANTOS SILVA
Decision-Making Process in Portuguese Erasmus Student
Mobility: Case Study
Processo de Tomada de Decisão na Mobilidade Portuguesa
de Estudantes Erasmus: Caso de Estudo
Dissertação apresentada à Universidade de Aveiro para cumprimento dos requisitos necessários à obtenção do grau de Mestre em Gestão, realizada sob a orientação científica do Mestre Victor Manuel Ferreira Moutinho, Assistente no Departamento de Economia, Gestão e Engenharia Industrial da Universidade de Aveiro e Coorientação científica do Doutor António Carrizo Moreira, Professor Auxiliar do Departamento de Economia, Gestão e Engenharia Industrial da Universidade de Aveiro.
o júri / the panel
presidente / president Prof.º Doutor Daniel Ferreira Polónia
Professor Auxiliar Convidado, Universidade de Aveiro
vogais / examiners committee Prof.ª Doutora Zélia Maria de Jesus Breda Professora Auxiliar, Universidade de Aveiro
Prof.º Mestre Victor Manuel Ferreira Moutinho Assistente, Universidade de Aveiro
acknowledgments While this work has my name on it, it would not have been possible without the help of my professors, family and friends, that have been there as fundamental supporters and to whom I express my sincere gratitude.
In an academic side:
to my advisor Professor Victor Moutinho for all the help and insights given when needed, for his availability and effort, for his valuable opinions;
to my co-advisor Professor António Carrizo for his final remarks and suggestions;
to all Portuguese higher education institutions and Erasmus mobility for studies students that accepted to take part in this work;
to my professors I had during my life that showed me there is a lot more to discover than staying inside four walls;
In a more social and private side:
nothing would have been even possible without my parents to whom I owe everything, for being an example to be followed and for providing everything I needed;
to Lucas Prates for being there whenever I needed the most, for supporting by giving me strength and encouragement, and for not giving up on me – even though I so many times deserved;
To Filipa Mendonça for being the sister I never had;
to Jessica Asami and Guilherme Limberger for cheering me up with their always excellent humour;
to all the exchange students I had the pleasure to meet for ‘feeding’ this ever-growing desire to explore the unknown;
to Erasmus Student Network Aveiro for the trust given while I was a volunteer, for letting me improve myself and for being a place where I could meet so many people that today are so close to me.
palavras-chave EMS, tourism-first, education-first, estudantes internacionais, Erasmus, mobilidade, Modelo Push-Pull, motivações para viajar
resumo Com a evolução das atuais economias do conhecimento, o mundo do trabalho torna-se mais competitivo. Como forma de ganhar competências que tragam benefícios para as suas carreiras, os estudantes universitários aproveitam as diversas oportunidades existentes e vão estudar no estrangeiro. Este estudo desenvolve e testa empiricamente um modelo estrutural que examina os antecedentes que influenciam a tomada de decisão de um aluno Erasmus em mobilidade de estudos (EMS) em Aveiro, Coimbra e Porto (2014-2015). A análise de fiabilidade, a análise fatorial exploratória e as regressões lineares foram utilizadas para avaliar o modelo. Com base num questionário com uma amostra de 872 respostas válidas, este estudo demonstrou que os estudantes EMS são também influenciados por fatores turísticos, dando assim seguimento ao trabalho que recentemente tem vindo a ser abordado por outros autores. As conclusões e sugestões podem ser utilizadas pelas Instituições de Ensino Superior como meio de atrair mais estudantes EMS.
Keyworkds EMS, tourism-first, education-first, international students, Erasmus, mobility, Push-Pull Model, travel motivations
abstract With the evolution of nowadays knowledge-based economies, the labour class becomes more competitive. As a way of getting skills that bring benefits to their careers, university students take advantage of the many opportunities available and go abroad to study. This study develops and empirically tests a structural model that examines the antecedents that influence the decision-making process of an Erasmus student under mobility for studies (EMS) in Aveiro, Coimbra and Porto (2014-2015). Reliability analysis, exploratory factor analysis and linear regressions were used to evaluate the model. Based on a survey with a sample of 872 valid responses, this study has demonstrated that EMS students are also influenced by touristic factors, which gives support to what has recently been approached by other authors. Conclusions and suggestions can be applied by other organizations, mainly Higher Education Institutions in order to attract more EMS students.
i
Contents
Page
LIST OF CHARTS ... III LIST OF FIGURES ... V LIST OF TABLES ... VII LIST OF ACRONYMS ... IX
INTRODUCTION ... 1
CONTEXT ... 5
2.1 The Erasmus Programme: An Overview ... 5
2.2 EMS in Portugal ... 7
LITERATURE REVIEW ... 9
3.1 Push-Pull Model ... 9
3.2 Personal Reasons ... 10
3.3 Home Country Effect ... 11
3.4 Host Country Effect ... 12
3.5 Host Institution Effect ... 13
3.6 Travel Motivations ... 14
PROPOSED STRUCTURAL MODEL ... 17
4.1 Hypothesis and Structural Model ... 17
4.2 Measures and Questionnaire ... 19
DATA AND RESULTS ... 23
5.1 Sample ... 23
5.1.1 Demographics ... 24
5.2 Methodology... 27
5.3 Results ... 28
5.3.1 Reliability and Scales Consistency ... 28
5.3.2 Exploratory Factor Analysis ... 30
5.3.3 Tests of Hypothesis ... 38 5.3.3.1 Multi-collinearity Analysis ... 38 5.3.3.2 Model A ... 41 5.3.3.3 Model B ... 43 5.3.3.4 Model A+B ... 46 CONCLUSIONS ... 51 6.1 Discussion ... 51
6.2 Final Remarks and Implications ... 53
6.3 Limitations and Future Research ... 54
REFERENCES ... 55
iii
List of Charts
Page Chart 1 – Evolution in the number of students enrolled outside their country of citizenship, by region of
destination (2000 to 2012) ... 2
Chart 2 – Percentage of all foreign students enrolled at a HEI (2000-12)... 2
Chart 3 – Number of participants under the Erasmus Programme ... 6
Chart 4 – Evolution of participants in Portugal under the Lifelong Learning Programme (2007-2013) ... 8
v
List of Figures
Page
Figure 1 – Student decision-making framework according to Mazzarol and Soutar (2002) ... 10
Figure 2 – Theoretical framework proposed by Cubillo et al. (2006) ... 10
Figure 3 – Proposed structural model ... 18
vii
List of Tables
Page
Table 1 – Used items per construct ... 19
Table 2 – Sample demographics’ gender, age and level of studies ... 24
Table 3 – Sample’s demographics’ country of citizenship ... 25
Table 4 – Sample demographics’ host HI ... 25
Table 5 – Sample demographics’ mobility period ... 26
Table 6 – Sample demographics’ Host country and HI choices ... 26
Table 7 – Sample demographics’ flow of decision ... 27
Table 8 – Reference values for Cronbach’s Alpha ... 27
Table 9 – Keyser-Meyer-Olkin (KMO) reference values ... 28
Table 10 – Reliability Analysis results ... 29
Table 11 – Exploratory Factor Analysis: Personal Reasons ... 31
Table 12 – Host Country Effect ... 32
Table 13 – Host Institution Effect ... 33
Table 14 – Home Country Effect ... 34
Table 15 – Travel Motivations (Push) ... 35
Table 16 – Travel Motivations (Pull) ... 36
Table 17 – Pearson and Variance Inflation Factor Coefficients (VIF) ... 40
Table 18 – Regression analysis: Model A ... 42
Table 19 – Hypothesis results overview: Model A ... 43
Table 20 – Regression coefficients: Model A ... 43
Table 21 – Regression analysis: Model B ... 45
Table 22 – Hypothesis results overview: Model B ... 46
Table 23 – Regression coefficients: Model B ... 46
Table 24 – Regression analysis: Model A+B ... 48
Table 25 – Hypothesis results overview: Model A+B ... 49
ix
List of Acronyms
EFA Exploratory Factor Analysis EMS Erasmus Mobility for Studies HEI Higher Education Institution ISM International Student Mobility SMP Erasmus Student Mobility Placement
1
I
NTRODUCTION
hile societies are advancing to a state of knowledge-based economies, governments and institutions are increasingly joining efforts onto looking for new ways to attract and retain highly skilled workforce into their economies. A way to do it is by increasing the number of international students coming to study at their institutions, contributing to the economy and hopefully staying to work after – it is, therefore, important to study this segment and to understand which factors have impact on their decision-making process, so the countries and institutions can use them as their benefit.
Humans are mobile: throughout the ages they travelled to all corners of the Earth and whether as workers, students, tourists or pilgrims, technology has provided the tools to make it quick, safe and cheap, making the planet their global village (McLuhan, 1962). This phenomenon brought many changes as nowadays knowledge-based society’s economies are getting more and more interconnected and companies are looking for highly skilled people that can keep up with today’s demands (such as adapting to the uncertainties of an unpredictable global economy), governments are setting several initiatives to foster the number of students that go to study abroad in order to gain cultural knowledge, learn new languages and business method, and thus improving “their prospects in globalised sectors of the labour market” (European Commission, 2009b; OECD, 2004, 2014b, p. 342; OECD & World Bank, 2007; Parey & Waldinger, 2010; Teichler, 2011).
.In Europe, the European Commission took joint efforts to reform its own education system – the Bologna process launched in 1999 aimed to establish the European Area of Higher Education, while promoting “mobility by overcoming obstacles to the effective exercise of free movement” (European Ministers of Education, 1999, p. 3). The increment of intra-European Union mobility boosts competitiveness, attracting more international students and helping to meet the goal of turning Europe into a leading knowledge-based society (A. R. Cardoso, Portela, Sá, & Alexandre, 2006).1
1 International students differ from foreign students: the first term is applied when a student crosses borders with the sole purpose of studying, whereas a foreign student refers to a student who enrols abroad at an Higher Education Institution (HEI) without having the citizenship of that country, and who has not “necessarily crossed a border to study” (these students may be long-term residents, for example). These two terms were part of a convention adopted in 2006 between OECD and UNESCO Institute for Statistics in order to have a comparative dataset in the future (OECD, 2014b, p. 352). However, other organisations might use other definitions and criteria when setting their data, making the comparison between studies somewhat problematic, which can lead to inaccurate conclusions (Clark, 2009).
2
According to OECD’s report ‘Education at a Glance’ (2014b), the number of students enrolled outside their country of citizenship has currently be growing at 7%/year, having more than quintupled since 1975: from 0.8 million in 1975 to over 4.5 million in 2012 (pp. 343-344)(see Chart 1), mainly as the result of the promotion of the “academic, cultural, social and political ties among countries, particularly as the European Union was taking shape, to a substantial increase in global access to tertiary education, and to reduced transportation costs” (p. 344).
Comparing the European market share as destination for foreign students since 2000 to 2012, the eight top countries went down from 33.33% to 33.09%, mainly due to the decrease registered in Germany (-2.61%); the United Kingdom, however, registered an increment of 1.88%, topping 12.56% in 2012 (see Chart 2).
It is also important to pay attention to some of the factors that are taken into consideration when choosing a country of destination. Neighbouring countries have usually a significant share – as an example, of the foreign students in Portugal in 2012, 9% were from Spain (this factor can reveal several advantages on a student’s
Chart 1 – Evolution in the number of students enrolled outside their country of citizenship, by region of destination (2000 to 2012)
(Source: OECD, 2014b, pp. 342, Chart C4.1)
Chart 2 – Percentage of all foreign students enrolled at a HEI (2000-12)
(Source: OECD, 2014b, p. 346) 0.00 1.00 2.00 3.00 4.00 5.00 2000 2001 2002 2003 2004 2005 2006 2007 2008 2009 2010 2011 2012 M illions
Worldwide OECD G20 countries Europe North America Oceania
0.00 2.00 4.00 6.00 8.00 10.00 12.00 14.00 United
Kingdom¹ Germany France Spain Italy Austria Netherlands Belgium
M ar ket Sha re ( % )
Chapter 1 – Introduction 3
perspective, like cost, quality and enrolment). Having a common language is also an important factor: the percentage of foreign students from countries with common official language was 55% in Portugal in 2012, of which 18.1% were from Brazil (OECD, 2014b, pp. 351; 359-360). This kind of information is relevant when trying to understand what makes a student choose a university over other in order to create an effective marketing plan (Cubillo, Sánchez, & Cerviño, 2006; Soutar & Turner, 2002).
In 2012 the twenty largest world economies (G20) attracted 75% of foreign students worldwide: the European Union member countries alone accounted for 48% of the global share, being therefore a top destination to study abroad (OECD, 2014a, p. 7). United Kingdom is the European country with most foreign students (12.56%), followed by Germany (6.35%) and France (5.99%). Spain, Italy, Austria, The Netherlands and Belgium have a small share each (2.16%; 1.72%; 1.69%; 1.38%; 1.23%, respectively)(OECD, 2014b, p. 345).
This global increment of International students brings several advantages to the host economies, making it a very important segment economically within the travel market, significantly contributing to the economy of the host country as for they usually stay way more time than a typical holiday tourist (Llewellyn-Smith & McCabe, 2008; Mazzarol, 1998; Ritchie, 2003; Shanka, Ali-Knight, & Pope, 2002; Weaver, 2008). It is, thus, understandable that national and local entities try to attract as many student as possible – HEI in particular have been during the last decades increasingly applying marketing concepts and theories as a result of governments’ intervention in the higher education, which has been going from a state of control to a state of supervision, applying at the same time marketization policies (Hemsley-Brown & Oplatka, 2006; Judson & Taylor, 2014; Williams, 1995). This strategy is “aimed at strengthening student choice and liberalising markets in order to improve the quality and variety of the services offered” (Jongbloed, 2003, p. 13).
NOTE: Portugal, in particular, has recently published a report about the country’s strategy for the internationalization of the Portuguese higher education: one of the goals is to double the number of international students in Portugal by 2020. Having in consideration Portugal received 31000 students in 2013, it would mean to attract 62000 students in 2020 (MEC, 2014, p. 48 – table 2). It proposes several guidelines to achieve this goal, such has by creating a common brand to be used to promote the internationalization of the Portuguese higher education, participating in education fairs, of by offering a wider range of courses taught in English, among several others (MEC, 2014).
It is then of the utmost importance to study the international student community, specifically which main factors influence their decision-making process so marketing plans can be adapted correctly (Cubillo et al., 2006; Soutar & Turner, 2002). Although several studies have been carried out on this topic, only a few authors studied the Erasmus mobility for studies or applied tourism factors to the decision-making process in general – this
4
detail is important to determining if Erasmus Mobility for Studies (EMS) are influenced by tourism factors as suggested by González, Mesanza and Mariel (2011).
Therefore, the following study has two major objectives:
1. Develop and empirically test a model examining the main factors that influences the decision-making process of an EMS;
2. Explore, in particular, the influence of travel motivations in the EMS programme.
This study is designed as follows: first chapter will introduce the topic in a global panorama; second chapter will give some insights about the EMS in general terms and then focusing in Portugal; third chapter presents the literature review about which factors influence the decision-making process of an EMS student and related relationships; proposed hypothesis and structural model is presented on the fourth chapter; fifth chapter contains the methodology description and results; and finally findings are discussed from the point of view of theoretical & managerial implications and future research is presented on the sixth chapter.
5
C
ONTEXT
nowing that the international student mobility has been growing, a focus is given to a specific project: the Erasmus Programme. Also registering new participation records every year, the now Erasmus+ Programme is one of the flagship projects of the European Union, empowering the participants by developing a set of skills and by broadening their horizons of what “united in diversity” really means. Portugal is a small player within the Erasmus Programme, receiving 4.1% of the total EMS students in 2012-13, but has been increasing its share as a result of the internationalization efforts done by HI and the Portuguese government.
2.1 T
HEE
RASMUSP
ROGRAMME:
A
NO
VERVIEWThe increasingly knowledge-based European society demands particular skills and competences among the labour market, such as flexibility, mobility and a broader mind-set. The European Union has added an extra effort on its educational agenda by including this portfolio in several initiatives in order to achieve the goals proposed, including recently in the European Union 2020 strategy2. It is thus “a societal imperative to expand opportunities to higher education as broadly as possible” (European Commission/EACEA/Eurydice, 2014, p. 15).
A new focus on the mobility among HEI came to light during the 1980 and 1990: on 15 June 1987, after a six years pilot programme, the European Commission approved its new flagship project – the European Community
Action Scheme for the Mobility of University Students, widely known as the Erasmus Programme – strongly
supporting the mobility amongst European students, and considered the most successful student exchange scheme in the world (European Commission, 2014a; EYP, 2013).
Taking advantage of the tremendous efforts put in action towards the European education, the Erasmus Programme expanded to several countries – by 2013 (its last year) 33 countries were part of the programme: 27 European Union members and Croatia, Iceland, Liechtenstein, Norway, Switzerland and Turkey.
Aiming to fight against youth unemployment by developing a wide range of skills and competences needed by the employers (such as mobility and bilingualism), the programme empowered three million students and staff so far, from 1987 to 2013 – starting with 3244 students in 1987-88, it increased enormously during the first
2 “In 2020, at least 20% of those graduating in the European Higher Education Area should have had a study or training period abroad” (European Commission, 2009a)
6
years, reaching the first millionth in 2002/2003, the second in 2008/2009 and the third in 2012/2013 – the goal was to reach three millionth by 2014, but the year-by-year increase of 6% made it possible to reach it one year before the deadline (European Commission, 2014a)(Chart 3). The programme’s success also lead to a cultural phenomenon and fostered the European Identity (ESN AISBL, 2013; Mitchell, 2012).
Chart 3 – Number of participants under the Erasmus Programme
(Source: European Commission, 2014a, p. 31)
The Erasmus as of today was made of many successions of programmes, namely Erasmus (1987-89), Erasmus (1990-94), Socrates I (1995-99), Socrates II (2000-06), Lifelong Learning Programme (2007-13), and the newly implemented Erasmus+ (2014-20): although widely recognised for having a notorious success, the Erasmus Programme was replaced by a new scheme for education, training, youth and sports: Erasmus+. Planned according to the goals planned to be achieved by the UE’s growth strategy (Europe 2020), Erasmus+ brings together seven existing programmes (including Comenius, Erasmus Mundus and Leonardo da Vinci (European Commission, 2014b)) and plans to provide grants to over four million students and staff within the next seven years (2014-2020), having its budget increased by 40%, topping 14.7 billion euros (European Commission, 2014c; European Parliament & Council of Europe, 2013).
Looking at the data published by the European Commission regarding the Erasmus Programme (2007-13), over one million students (1116354) went abroad to study at another HEI. The main sending and hosting countries were Spain, France and Germany: these three countries alone sent 42.76% and received 38.96% of a total of 903832 students under mobility for studies from 2007 to 2012 (European Commission, 2012, pp. 36, Chart 18, p. 40, 2013, pp. 21, Chart 18-19, 2014a, pp. 8-9) 3244 9914 19456 27906 36314 51694 62362 73407 84642 79874 85999 97601 100666 111092 115432 123957 135586 144037 154421 159324 182697 198523 213266 231408 252408 268143 0 50000 100000 150000 200000 250000 300000 350000 1987-88 1988 -89 1989-90 1990-91 1991-92 1992-93 1993-94 1994-95 1995-96 1996-97 1997-98 1998-99 1999-00 2000-01 2001-02 2002-03 2003-04 2004-05 2005-06 2006-07 2007-08 2008 -09 2009-10 2010-11 2011-12 2012-13
Chapter 2 – Context 7
Taking into analysis the last academic year for which statistics are available (2012-13), six in ten students under mobility for studies were female (60.6%) and 22.6 years old. The more than two hundred thousand students received on average 253 euros as European Union monthly grant in order to cover part of their living expenses (an increase by 9.5% on the previous year). The students were mainly undergoing a Bachelor’s (70%) or Master’s (28%) degree and spent 6.2 months abroad, on average. As for the two biggest share of courses, 41% were from social sciences, business and law, followed by students of humanities (21.9%). The total number of students was increased by 3.8% on the previous year (European Commission, 2014a, pp. 8-9).
From 2007-08 to 2011-12, Turkey registered the highest increment on incoming students under the programme, doubling from 1,799 students to 4,557 students in 2012-13 (+104.98%). The second country was Latvia which increased their students by 81.38% to 727, followed closely in third place by Cyprus which recorded an increment of 79.94%, ending up with 463 students under the mobility for studies3 (European Commission, 2012, pp. 41, Chart 21, 2013, pp. 22, Chart 21).
Although those countries had the highest increment on the incoming number of students, they represented, on average, only 2.12% of the total 904102 students (2007-2012). Analysing the top three receiver countries – Spain, France and Germany – Germany registered the highest increment (18.34%), followed by France (17.21%) and on third place Spain (12.58%). It is also important to notice that even though Spain, France and Germany held, on average, a 39.03% share of the total, these countries lost 2.99%, meaning that even though more students chose these countries, even more students chose other countries. Germany was the only of these three countries to have a positive increment during the four years of this analysis (2011-12: +0.33%)(European Commission, 2013, pp. 21, Chart 18; 21).
During the academic year 2012-13, 212,522 students went abroad to study through the Erasmus Programme to one of the 33 participating countries, whereas Europe received over 2.1 million foreigner students in 2012: in 2000-01 there were 111 thousand Erasmus students and 935 thousand foreigner students (2000), and in 2005-06 over 154 thousand Erasmus students participated in the programme, and Europe received 1,388 million foreigner students (European Commission, 2013, pp. 21, Chart 18, 2014a, p. 8; OECD, 2014b, pp. 342, Chart C4.1).
2.2 EMS
INP
ORTUGALDuring the last Erasmus Programme (Lifelong Learning Programme, 2007-13), the number of EMS students in Portugal (incoming) increased by 65.48%, from 5,267 students in 2007-08 to 8,716 students in 2012-13, dispersed by 85 Portuguese higher institutions (ANPROALV, 2014; MEC, 2014, p. 80)(Chart 4).
3 Switzerland and Croatia registered a higher increment (25860% and 2527.27%, respectively), but both countries joined the Erasmus Programme in 2010-11 onwards.
8
Chart 4 – Evolution of participants in Portugal under the Lifelong Learning Programme (2007-2013)
(Source: MEC, 2014, p. 80, Table 7)
Among the top universities, the Portuguese HEI which received more EMS student was the new University of Lisbon with 1469 students, almost the double than the University of Porto (814 EMS students); third place went to University of Coimbra, with 775 students, and the University of Aveiro ranked 9th, with 238 EMS students (ANPROALV, 2014)4. Geographically, and for this study, 16 HI in Porto received EMS students in 2012-13 (1,688 students; 59.12%), 2 HI in Coimbra (929 students; 32.54%) and the University of Aveiro received 238 students (8.34%).
Spain was the country that sent in more EMS students (26.8%), followed by Italy (13.3%) and Poland (12.4%); the high percentage of Spain when compared to the other countries follows the same pattern when analysing the ISM (9% comes from Spain), and can be explained by the “cost, quality and enrolment advantages” (OECD, 2014b, p. 351). It is also important to note that Portugal attracted 61.71% more EMS students than it sent abroad: 8716 incoming vs 5390 outgoing, in 2012-13 (MEC, 2014, p. 78, Table 7-8).
Comparing the Portuguese incoming share on the Lifelong Learning Programme (2007-13), Portugal received only 3.75% of the total EMS during that period (check Chart 5 for yearly Portuguese market share).
Chart 5 – Portugal’s incoming market share on the Lifelong Learning Programme (2007-2013)
(Source: European Commission, 2013, p. 21, Chart 18; MEC, 2014, p. 80, Table 7)
4 The ranking given by ANPROALV (2014) presents ‘Universidade Técnica de Lisboa’ (Technical University of Lisbon) and ‘Universidade de Lisboa’ (University of Lisbon) as two independent HI. However, and even though both institutions were merged in 2012, becoming the ‘Universidade de Lisboa’ (University of Lisbon), only one year later (2013-14) they were formally working as one entity. It is also important to note that even though ‘Universidade Católica Portuguesa’ ranks 6th place on the original ranking, that HI is composed by four major regional centres: Lisbon (headquarters); Braga, Beiras, and Porto – in total it received 369 EMS students in 2012-13, but the regional centre of Porto received 81 students only.
8.83% 15.42% 14.57% 4.70% 9.83% 4000 5000 6000 7000 8000 9000 2007-08 2008-09 2009-10 2010-11 2011-12 2012-13 3.24% 3.41% 3.72% 3.98% 3.88% 4.10% 3.00% 3.50% 4.00% 4.50% 2007-08 2008-09 2009-10 2010-11 2011-12 2012-13
9
L
ITERATURE
R
EVIEW
The present chapter deeply explores the existing literature available about how the decision-making process of an international student is made. Having a Push-Pull model as basis, the review explores the three stages in order to formulate hypothesis.
3.1 P
USH-P
ULLM
ODELDuring the last decades several studies regarding the international student mobility have been published: some analyse the motivation of the international students (Mazzarol & Soutar, 2002; Park, 2009) and some others use statistical data and mathematical flow analyses (González et al., 2011; McMahon, 1992).
While studying the flow of students from 18 developing nations (to the USA), McMahon (1992) tested a Push-Pull model which has been used by several other researches until nowadays to study de decision-making process of an international student when choosing a hosting HEI (Cubillo et al., 2006; González et al., 2011; Maringe & Cartes, 2007; Mazzarol & Soutar, 2002). According to the author, there are factors that push and pull a student to go study abroad: factors such as (low) level of economic wealth or the (lack) availability of educational opportunities in the home country may “push” the student to study abroad, whereas (the existence of) scholarships given by host country or the (larger) size of its economy may “pull” more students to study there.
Another important addition to this model was given by Mazzarol and Soutar (2002) – according to them a student goes through three different stages when selecting a study destination. First, push factors within the home country make the student go study abroad, such as “overseas course better than local” or “course not available at home”. Second, he is pulled by other factors to choose a host country, e.g. “host qualifications recognised” and “knowledge of host country”. Last stage is when the student is influenced by pull factors to select a HEI, like if the “institution has a reputation for quality and is willing to recognise the student’s previous qualifications” (p. 85; 88)(Figure 1). The decisions will follow those three stages in that exact order (p. 84).
10
Figure 1 – Student decision-making framework according to Mazzarol and Soutar (2002)
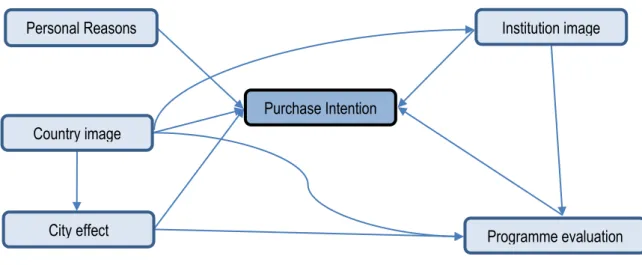
Cubillo et al. (2006) explored the existing literature regarding what influences the decision-making process of international students and presented a hypothetical model made of four factors subdivided in 19 variables to ultimately analyse the purchase intention5 (Figure 2).
Figure 2 – Theoretical framework proposed by Cubillo et al. (2006)
3.2 P
ERSONALR
EASONSAccording to Mazzarol (1998) the “decision to study overseas is one of the most significant and expensive initiatives they (students and family) will have ever undertaken” (p. 165), and thus can be categorized as a high-involvement purchase as the students carefully choose their hosting HEI (Binsardi & Ekwulugo, 2003; Mittal, 1989; Mullins & Walker, 2012). Binsardi and Ekwulugo (2003) also point out that “students are not buying degrees; they are buying the benefits that a degree can provide in terms of employment, status, lifestyle, etc” (p. 319).
The European Commission recently issued the report ‘Erasmus Impact Study’ (2014d), which surveyed over 78 thousand individuals (students, staff, HEI and employers) to analyse the effects of mobility on the
5 In this case “purchase intention” is defined “as the intention of the student regarding the destination country as provider of education service” (Cubillo et al., 2006, p. 104).
Personal Reasons City effect Country image effect Institution image Programme evaluation Purchase Intention
1st • Decides to study abroad (push factors)
2nd • Decides which country to go abroad to (pull factors)
Chapter 3 – Literature Review 11
employability and competences of students and internationalizations of HEI. Amongst other conclusions, it showed both employability and competences of students are benefited from studying abroad; the risk of unemployment 12 months after finishing studies is 50% lower to former Erasmus students than non-mobiles students, and 23% lower after 5 years (p. 113;116). Also 42% of the Erasmus respondents “increased their advantage over non-mobile students on memo©6 factors though study abroad” and 52% of them “improved their skills through stay abroad” (p. 84). In the employers perspective, 64% considered important to have an experience abroad (p. 16).
Several other studies and reports show that studying abroad boosts career prospects and improves students’ skills when compared to those students that did not go abroad, reason why it is common to have the opportunity to enhance future career prospects listed as an important factor that leads a student to go abroad (ESN AISBL, 2013; European Commission, 2014d; Hussin, Soon, & Sidin, 2000; Shaftel, Shaftel, & Ahluwalia, 2007; Soutar & Turner, 2002; Sweeney, 2012).
As higher education is considered a service that requires a high-involvement by the buyer (student)(Mazzarol, 1998), it is common for the student to ask for advice and guidance. Therefore, an important factor that influences the decision-making process are the recommendations given by family members, friends and counsellors/agents during the three stages (Bourke, 2000; González et al., 2011; Maringe & Cartes, 2007; Mazzarol & Soutar, 2002).
The above theoretical review allows to set three hypothesis:
H1: Personal Reasons have a positive impact on Home Country Effect; H2: Personal Reasons have a positive impact on Host Country Effect; H3: Personal Reasons have a positive impact on Host Institution Effect.
3.3 H
OMEC
OUNTRYE
FFECTAccording to McMahon (1992), home country factors will ‘push’ the students who seek an international education to go abroad and, according to Mazzarol and Soutar (2002), these factors are the first to influence the decision-making process of those students (p. 83)(Figure 1). These factors are usually connected to the political or economic situation of the home country (Maringe & Cartes, 2007).
One of the factors revised by some authors is the difficulty to gain entry to a specific course or university within the home country (Maringe & Cartes, 2007; Mazzarol, Kemp, & Lawson, 1996; Mazzarol & Soutar, 2002; McMahon, 1992; Yang, 2007). A close example are the several Portuguese students that go to Spain every
6 Memo© stands for “Monitoring Exchange Mobility Outcomes” – it is a tool developed by CHE Consult made of six ‘memo© factors’ that measure and analyse the benefits of studying abroad.
12
year to study medicine (either because their marks are not high enough to be accepted or there are not enough places available at the Portuguese universities)(Agência Lusa, 2012). Intention to migrate and being able to attend a better courses abroad are also important factors among the international students (Mazzarol & Soutar, 2002; Yang, 2007).
Stagnation or decline of their home country economy can also lead students choose to go abroad (Maringe & Cartes, 2007; Mazzarol & Soutar, 2002; McMahon, 1992), same for political instability (Maringe & Cartes, 2007).
3.4 H
OSTC
OUNTRYE
FFECTHost country has an important role on the decision-making process of a student when going abroad. According to McMahon (1992) factors related to host country will attract the student (pull factors), making him prefer a specific country over others. It is also the 2nd stage on the decision-making process on Mazzarol and Soutar’s model (2002), after the student had been ‘pushed’ to go abroad (1st stage; home country push factors) and before being ‘pulled’ to choose a specific HEI (3rd stage; HEI pull factors)(Figure 1).
Several studies have showed that the country’s image is a major pull factor (Binsardi & Ekwulugo, 2003; Bourke, 2000; Mazzarol & Hosie, 1996; McMahon, 1992), increasing the competition among host nations in order to attract more international students (Bourke, 2000, p. 110).
Mazzarol and Soutar (2002) surveyed 1606 students (53% of them were international students) from 1996 to 2000 in Taiwan, India, China and Indonesia in an attempt to identify the different reasons why students selected a specific host country. It considered the “awareness and reputation of the host country (…) to be critical” on the decision-making process (Mazzarol & Soutar, 2002, p. 90). Among the factors listed, social links such as siblings or friends studying/living there, high overall reputation for quality education and a high international profile are presented.
Another factor to have in consideration is the city image that acts as a pull factor (Cubillo et al., 2006; Llewellyn-Smith & McCabe, 2008; Price, Matzdorf, Llewellyn-Smith, & Agahi, 2003). According to Cubillo et al. (2006) the host city influences the student when choosing the host country since it “represents the environment in which the service will be produced and consumed” (p. 109). Choosing a city with an “affordable cost of living” seems to be important for most international students (p. 603), and even though EMS generally receive a grant to help on the extra costs arising from studying abroad (European Commission, 2014a, p. 8), 26% of the non-mobile students surveyed by The Erasmus Impact Study stated that they did not take part of the Erasmus Programme due to the Erasmus grant being insufficient (2014d, p. 76).
Chapter 3 – Literature Review 13
3.5 H
OSTI
NSTITUTIONE
FFECTHost institution effect is the third and last stage of the decision-making process of a student who goes abroad, being composed by several ‘pull’ factors that make a particular HEI more attractive than the rest (Mazzarol & Soutar, 2002, p. 83)(Figure 1).
Until the 80’s higher education was rated as a product, where students were the product itself and the employers were the customers (Kotler & Fox, 1995; Levitt, 1980). However, later studies in the field defined higher education as a pure service since educational services cannot be separated from the person delivering it and the costumer (student) that takes part in the process (inseparability), one cannot keep it (perishable), cannot be perceived, felt or tested in advance (intangible) and each and every service given is unique (heterogeneity)(Mazzarol, 1998; Nicholls, Harris, Morgan, Clarke, & Sims, 1995; Patterson, Romm, & Hill, 1998; Shank, Walker, & Hayes, 1996), and thus service marketing models have been successfully applied (DeShields Jr, Kara, & Kaynak, 2005; Hemsley-Brown & Oplatka, 2006; Nicolescu, 2009; Temple & Shattock, 2007). The internationalization and globalization phenomenon has led the HEIs to promote themselves in order to create a strong positive image in the minds of the future students, helping to attract more students (Altbach & Knight, 2011; Miaoulis, 2003; OECD, 2014b; Ritchie, 2003; UNESCO, 2009). A way to create an influential institution image is to form positive opinions, impressions and ideas in the prospective students (Kotler & Fox, 1995) – that image will come from an evaluation of the service that will have indirect elements as starting points (as it is a service), such as the HEI reputation, staff expertise and campus environment (Maringe & Cartes, 2007; Mazzarol & Soutar, 2002; Soutar & Turner, 2002; Wilkins, Balakrishnan, & Huisman, 2012).
During the last decade the HEI core values, such as public interest and political democracy, have been replaced for some policies that are closely related to the private sector (productivity, profit, and so forth)(S. Cardoso, Carvalho, & Santiago, 2011; Nicolescu, 2009), which led several HEI explore the phenomenon of branding in order to be more attractive to students and academic staff (Chapleo, 2004; Hemsley-Brown & Oplatka, 2006; Wæraas & Solbakk, 2009). Marketization policies are aimed to give students more freedom of choice and to liberalise markets, which are set to improve the quality and offer a higher variety of services (Jongbloed, 2003). Universities have been increasingly paying attention to international ranking, such has Times Higher Education7, Leiden Ranking8 and the Academic Ranking of World Universities9, taking advantage of the prestige it can give and using it to promote themselves (Clarke, 2007; González et al., 2011; Marginson & Wender, 2007). Rankings
7 http://www.timeshighereducation.co.uk/ 8 http://www.leidenranking.com/
14
play also an important role on the attractiveness of the HEI (Cubillo et al., 2006; González et al., 2011; Yang, 2007): as Ellen Hazelkorn (2011) puts down, HEI “use rankings to guide restructuring of higher education because societies which are attractive to investment in research and innovation and highly skilled mobile talent will be more successful globally” (p. 37).
Several other studies show that HEI staff expertise, international strategic alliances and facilities are also an important source to attract international students (Beneke, 2011; Bourke, 2000; Ford, Joseph, & Joseph, 1999; Hussin et al., 2000; Mazzarol, 1998; Mazzarol & Soutar, 2002).
3.6 T
RAVELM
OTIVATIONSAmong the literature reviewed there is only one study having a ‘travel motivations’ (or similar) factor on its own (Jianvittayakit, 2010), even though the majority of the rest of the studies included variables dispersed in different factors that could be put together and form one factor only, making it possible to study the impact of the leisure factor on the decision-making process of an international student. It is also important to notice that there is only one study regarding the decision-making process of the EMS students (González et al., 2011)
This factor is very important to further analyse one of the findings of a research conducted by Gonzaléz et al. (2011): EMS seems “to be biased towards the Mediterranean countries” – countries which climate is warner than the rest of the European countries and, therefore, allowing several leisure activities to be done (p. 427). Thus, the authors leave the question to the reader: are public funds being used to finance leisure activities instead of an academic programme (p. 427)? This questions leads to another important question: are EMS students “tourist first” or “education first”?
This question leads to the educational tourism field: educational tourism is a new form of tourism that started being discussed by several academics during the 90s, most notably by Gibson (1998), Holdnak and Holland (1996) and Kalinowski and Weiler (1992); another important contribution was also given by Brent Ritche and his book Managing Educational Tourism (2003), where he examines educational tourism from many different perspectives that had been, until then, studied individually. Brent Ritchie defines ‘educational tourism’ as a “tourist activity undertaken by those who are undertaking an overnight vacation and those who are undertaking an excursion for whom education and learning is a primary or secondary part of their trip” (p. 18). The author conceptualized educational tourism into three major segments listed as a continuum – at one side: Tourism (tourism is the only motivation factor: e.g. go to the beach to relax); in the middle: Educational Tourism (tourism and education are the two main factors present; e.g. visit a museum while at a foreign city); and at the other side: Education (education is the only factor; e.g. ‘active’ field trip)(2003, p. 13, Figure 1.2). Educational Tourism could also be divided by two other segments: ‘Tourism First’ (type of tourism where tourism experiences are the primary aspect, and education is secondary) and ‘Education First’ (opposite to ‘tourism first’, having
Chapter 3 – Literature Review 15
educational aspects as main factors and tourism is a small part of the experience)(p. 12) – university students undergoing an exchange programme are perceived as “education first” educational tourism experiences (p. 12). Several other studies pointed educational push/pull factors as the main factors, such as future career prospects (European Commission, 2014d; Shaftel et al., 2007; Soutar & Turner, 2002), academic reputation (Cubillo et al., 2006; González et al., 2011; Yang, 2007) or HEI staff expertise (Jianvittayakit, 2010; Li & Bray, 2007; Padlee, Kamaruddin, & Baharum, 2010).
However, a few other studies focused a little bit more on the importance of climate and touristic factors on the decision-making process of an international student, such as Gonzaléz (2011), Jianvittayakit and Dimanche (2010) and Llewellyn-Smith and McCabe (2008).
Bourke (2000) surveyed 225 international students studying in Ireland, of which 73% agreed that to “experience new cultures” was one of the reasons they went to study abroad. Also according to The Erasmus Impact Study report (European Commission, 2014d), around 92% of EMS students considered that the opportunity to meet new people was a very important reason that led them to participate in Erasmus, same for the 92% and 94% who considered the opportunity to learn/improve a new language and to live abroad very important (respectively); around 41% answered that they were also influenced by the idea of having a ‘relaxed’ year abroad (leaving more time for leisure activities)(European Commission, 2014d, p. 74 - Figure 3-2).
In their study, Jianvittayakit and Dimanche (2010) concluded that travel motivation factors are more important during the 2nd stage (when choosing the host country), whereas the academic motivation factors are taken into account when choosing the institution, considering travel motivation factors as the primary motivation factors, leaving academic motivation factors as secondary. Another important approach was given by Llewellyn-Smith and McCabe (2008), stating that international students should be classified as “tourism first” educational tourists, “with travel being their primary motivation and the educational component being secondary importance”, after surveying a sample of students that had studied abroad at an Australian university (p. 604). In both works travel motivation factors had a great importance on all three stages of the decision-making process.
Three different hypotheses are to be studied further later; H4:
o a) Travel Motivation Push has a positive impact on Home Country Effect; o b) Travel Motivation Pull has a positive impact on Home Country Effect; H5:
o a) Travel Motivation Push has a positive impact on Host Country Effect; o b) Travel Motivation Pull has a positive impact on Host Country Effect;
16
H6:
o a) Travel Motivation Push has a positive impact on Host Institution Effect. o b) Travel Motivation Pull has a positive impact on Host Institution Effect.
17
P
ROPOSED
S
TRUCTURAL
M
ODEL
he fourth chapter lists all items and hypothesis to be considered on this study and presents the proposed structural model (dimensions) to be tested, including causal relationships between its constructs and respective hypothesis.
4.1 H
YPOTHESIS ANDS
TRUCTURALM
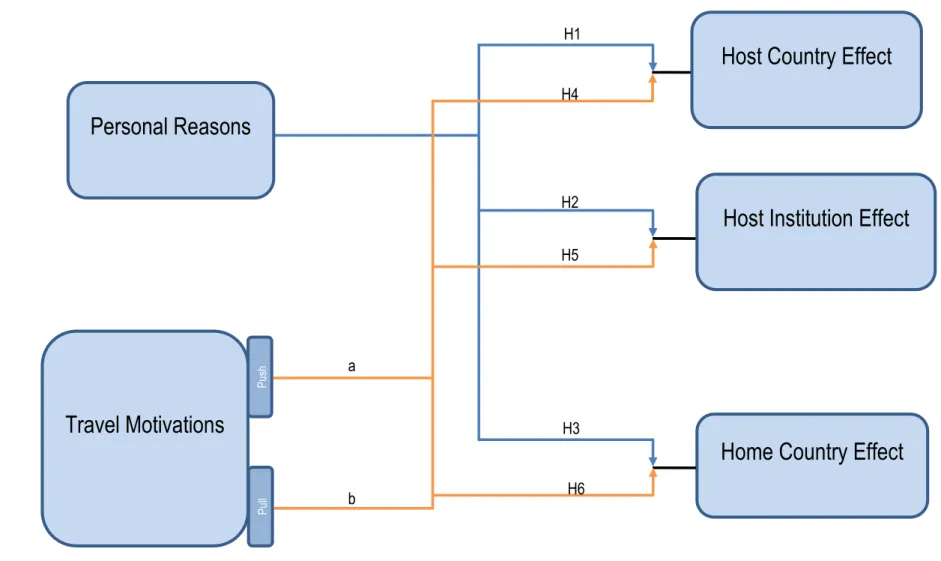
ODELNine hypothesis were formulated based on literature review under Chapter 3, and the proposed model is presented at Figure 3, including all hypothesis – the expected causal directions are indicated by the arrows. Hypothesis are listed as bellow:
H1: Personal Reasons has a positive impact on Home Country Effect; H2: Personal Reasons has a positive impact on Host Country Effect; H3: Personal Reasons has a positive impact on Host Institution Effect; H4:
o a) Travel Motivation Push has a positive impact on Home Country Effect; o b) Travel Motivation Pull has a positive impact on Home Country Effect; H5:
o a) Travel Motivation Push has a positive impact on Host Country Effect; o b) Travel Motivation Pull has a positive impact on Host Country Effect; H6:
o a) Travel Motivation Push has a positive impact on Host Institution Effect. o b) Travel Motivation Pull has a positive impact on Host Institution Effect.
18
H1
Home Country Effect
Pu sh Pu ll H4 H2 H5 H3 H6 b
Personal Reasons
Travel Motivations
Host Country Effect
Host Institution Effect
a Figure 3 – Proposed structural model
Chapter 4 – Proposed Structural Model 19
4.2 M
EASURES ANDQ
UESTIONNAIREThe data present on this study was collected using a closed question questionnaire based on constructs presented at previous studies carried out on this field of studies.
Two categorical Likert-type scales were used to measure the constructs: a five-point Likert scale was applied on all but Travel Motivations construct, which used a seven-point Likert-type scale – this decision was made to give the respondents a wider scope of options to choose from on one of the key constructs on this study (Travel
Motivations). It is also noteworthy to point out that Travel Motivations was the construct with more variables to
be analysed (27), and thus a seven-point Likert scale provided a better data basis to be studied later on, since it would be possible to maintain a higher level of reliability: several studies have shown that a seven-point scale is more sensitive when compared to a five-scale (Diefenbach & Weinstein, 1993; Finstad, 2010), giving a “higher degree of detail and precision” (Cohen, Manion, & Morrison, 2007, p. 327). The five-point likert scale has been used by several authors in their studies about this subject (Llewellyn-Smith & McCabe, 2008; Mazzarol et al., 1996; Park, 2009), and the same applies to the seven-point scale (Mazzarol, 1998; Mazzarol & Soutar, 2002; Wilkins et al., 2012). The level of agreement scale anchors ranged from 1 – strongly disagree to 5 – strongly
agree (5-point Likert scale)/7 – strongly agree (7-point liker scale), as recommended by Vagias (2006).
The items used on this study came from two different sources mainly: Personal Reasons, Host Country Effect and Host Institution Effect were adapted from Cubillo et al. (2006); whereas Travel Motivations, they key construct to be studied, was adapted from Llewellyn-Smith and McCabe (2008). Home Country Effect items were taken from two different authors: two items from Mazzarol and Soutar (2002) and the remaining two from were originated on Maringe and Cartes’s study (2007): these four items were all considered important to the study. All original measures were in English, and thus no translation was needed, only small changes to adapt to the Portuguese scenario (since none of the studies were about Portugal).
The initial questionnaire was submitted by a sample of 15 EMS students (total) randomly chosen from ESN Aveiro, Coimbra and Porto databases, attending HEI in Aveiro, Coimbra or Porto, respectively. The feedback helped to correct and improve readability and clarity of the scales. Table 1 lists the items used per construct.
Table 1 – Used items per construct
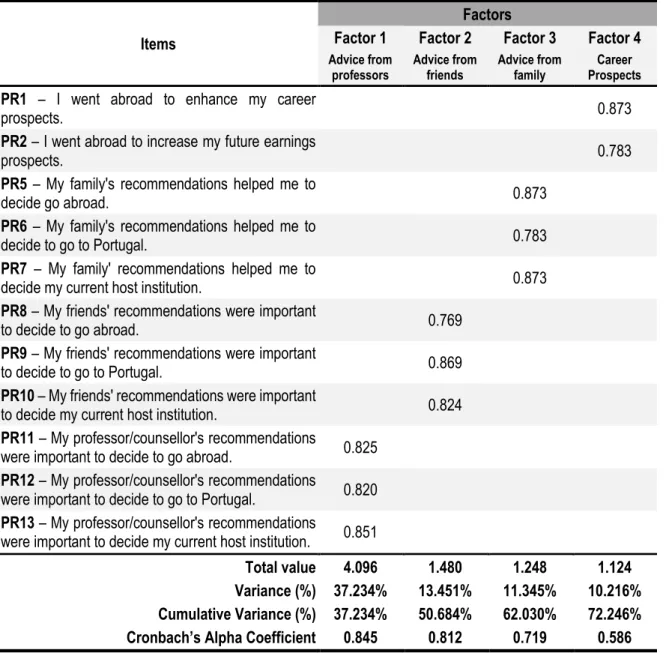
Construct Item
Personal Reasons:
I went abroad to…
PR1 ...enhance my future career prospects.
PR2 ...increase my future earnings prospects.
PR3 ...make international contacts.
20
Construct Item
My family's recommendations helped me to decide...
PR5 ...to go abroad.
PR6 ...to go to Portugal.
PR7 ...my current host institution.
My friends' recommendations were important to decide...
PR8 ...to go abroad.
PR9 ...to go to Portugal.
PR10 ...my current host institution.
My professor/counsellor's recommendations were important to decide...
PR11 ...to go abroad.
PR12 ...to go to Portugal.
PR13 ...my current host institution.
Host Country Effect:
I chose Portugal for its...
HostCE1 ...social reputation. HostCE2 ...academic reputation. HostCE3 ...development level.
HostCE4 ...opportunity of working during the course. HostCE5 ...linguistic proximity or distance. HostCE6 ...social facilities.
HostCE7 ...international environment. HostCE8 ...university environment.
Host Institution Effect:
I chose my current host institution because of its...
HIE1 ...institution prestige. HIE2 ...ranking position. HIE3 ...brand reputation. HIE4 ...academic reputation. HIE5 ...researcher reputation. HIE6 ...quality reputation. HIE7 ...expertise of teaching staff.
HIE8 ...professional experience of teaching staff. HIE9 ...campus atmosphere.
HIE10 ...social life at university. HIE11 ...safety and security. HIE12 ...library facilities. HIE13 ...availability of computers. HIE14 ...availability of quiet areas. HIE15 ...availability of areas for self-study. HIE16 ...sport facilities.
Chapter 4 – Proposed Structural Model 21
Construct Item
Home Country Effect:
I went abroad because...
HomeCE1 ...overseas course is better than local. HomeCE2 ...I have the intention to migrate in a near future. HomeCE3 ...of the unstable political situation.
HomeCE4 ...of the unstable economic situation.
Travel Motivations (Push):
My decision-making process was influenced by...
TMPush1 ...the desire to travel.
TMPush2 ...the opportunity for fun and excitement.
TMPush3 ...the social experience of living in a different country. TMPush4 ...the opportunity to meet new people and making friends. TMPush5 ...the opportunity to be challenged in a new environment. TMPush6 ...freedom and adventure.
TMPush7 ...the opportunity to learn about and experience Portuguese culture. TMPush8 ...opportunity to interact with local residents.
TMPush9 ...the opportunity to be independent and live away from home.
TMPush10 ...opportunity to go somewhere different to other respondents from my home university.
Travel Motivations (Pull)
My decision-making process was influenced by...
TMPull1 ...opportunity to enjoy Portugal’s sea, sun and surf. TMPull2 ...the tourist and cultural attractions in Portugal. TMPull3 ...Portugal’s scenery and diverse natural environment. TMPull4 ...Portugal being friendly and welcoming.
TMPull5 ...Portugal’s warm and sunny climate. TMPull6 ...Portugal being exotic and intriguing. TMPull7 ...Portugal’s unique wildlife.
TMPull8 ...Portugal being far away from home.
TMPull9 ...the idea that Portuguese people like to go out and have fun. TMPull10 ...outdoor recreation and sporting activities available in Portugal. TMPull11 ...cost of travel to and within Portugal.
TMPull12 ...Portuguese culture being similar to my own culture. TMPull13 ...quality and availability of transport in Portugal. TMPull14 ...affordable cost of living in the host city.
TMPull15 ...the host city as a gateway to other destinations in Portugal. TMPull16 ...the host city itself.
23
D
ATA AND
R
ESULTS
he questionnaire based on the literature reviewed, composed by 5 dimensions, was submitted to collect the data needed to further analyse. This chapter describes the findings of the study’s empirical research: firstly by analysing sample characteristics and then moving on to used methodology and at the end a description of the obtained results.
5.1 S
AMPLEThe latest data available from the European Commission regarding the Erasmus Programme, complemented with the information published by the Portuguese National Agency for the Management of the Lifelong Learning Programme10 regarding EMS in Portugal (ANPROALV, 2014), is from 2012-13 only, and therefore the current Portuguese EMS population is unknown. In order to calculate a representative sample for an unknown population (normally distributed), Cochran (1963, p. 75) proposes the following equation:
𝑛0=𝑍2𝑝𝑞 𝑒2
𝑛0= 𝑠𝑎𝑚𝑝𝑙𝑒 𝑠𝑖𝑧𝑒 𝑍2= 𝑎𝑏𝑠𝑐𝑖𝑠𝑠𝑎 𝑜𝑓 𝑡ℎ𝑒 𝑛𝑜𝑟𝑚𝑎𝑙 𝑐𝑢𝑟𝑣𝑒 𝑡ℎ𝑎𝑡 𝑐𝑢𝑡𝑠 𝑜𝑓𝑓 𝑎𝑛 𝑎𝑟𝑒𝑎 𝛼 𝑎𝑡 𝑡ℎ𝑒 𝑡𝑎𝑖𝑙𝑠 𝑞 = 𝑖𝑠 𝑞 − 1 𝑝 = 𝑒𝑠𝑡𝑖𝑚𝑎𝑡𝑒𝑑 𝑝𝑟𝑜𝑝𝑜𝑟𝑡𝑖𝑜𝑛 𝑜𝑓 𝑡ℎ𝑒 𝑎𝑡𝑟𝑖𝑏𝑢𝑡𝑒 𝑡ℎ𝑎𝑡 𝑖𝑠 𝑝𝑟𝑒𝑠𝑒𝑛𝑡𝑒𝑑 𝑎𝑡 𝑡ℎ𝑒 𝑝𝑜𝑝𝑢𝑙𝑎𝑡𝑖𝑜𝑛
𝑒 = 𝑑𝑒𝑠𝑖𝑟𝑒𝑑 𝑙𝑒𝑣𝑒𝑙 𝑜𝑓 𝑝𝑟𝑒𝑐𝑖𝑠𝑖𝑜𝑛
The confidence level required will be 95%, and thus 𝑍 = 1.96 (1 − 𝛼); precision ±5% (𝑒 = 0.5); and 𝑝 = 0.5 (maximum variation); Applying the formula:
𝑛 =𝑍2𝑝𝑞 𝑒2 =
(1.96)2(. 5)(.5)
(.05)2 ≅ 384 (𝑟𝑜𝑢𝑛𝑑𝑒𝑑 𝑢𝑝) And hence, the number of samples needed is 384.
The target population was the EMS students 2014-15 from three geographical areas to be surveyed – Aveiro, Coimbra and Porto – which in 2012-13 received 2855 EMS students – 16 HI from Porto attracted 1688 students
10 Agência Nacional para a Gestão do Programa Aprendizagem ao Longo da Vida (ANPROALV): http://www.proalv.pt/
24
(59.12%), followed by 2 HI in Coimbra with 929 students (32.54%) and the University of Aveiro received 238 EMS students (8.34%). These 2855 EMS students, represented 32.76% of the Portuguese share in 2012-13. The data was collected during the last two weeks of October 2014 and using an online questionnaire whose link was sent via email by 12 HI and using Facebook groups managed by Erasmus Student Network (Aveiro, Coimbra and Porto).
As no current number of EMS students is known at the moment (2014-15), nor from 2013-14, a comparison to 2012-13 data is done11. The 12 HI that agreed to resend the questionnaire to their EMS students represented 82.77% of the EMS students that carried their studies in the 19 HI in 2012-13. The final data set had 872 valid responses, which would have represented 30.54% of the EMS share in Aveiro, Coimbra and Porto in 2012-13, and was higher than the minimum valid responses needed (384).
Porto recorded 392 answers, what would have represented 23.22% of the total EMS students in mobility in that region in 2012-13 numbers; with 332 submissions, would have been 35.74% in Coimbra; and by submitting 148 questionnaires, they would have represented 62.18% in Aveiro.
5.1.1 D
EMOGRAPHICSNine measures were used to further know the respondents. Gender, age, country of citizenship, host HI, current level of study, period of mobility (whether 1 or 2 semesters, or if stills unknown), whether if Portugal or their host HI were their 1st option to go abroad, if there were other countries and/or HI besides Portugal or their current hosting HI, and a question to know their flow of decision during their decision-making process.
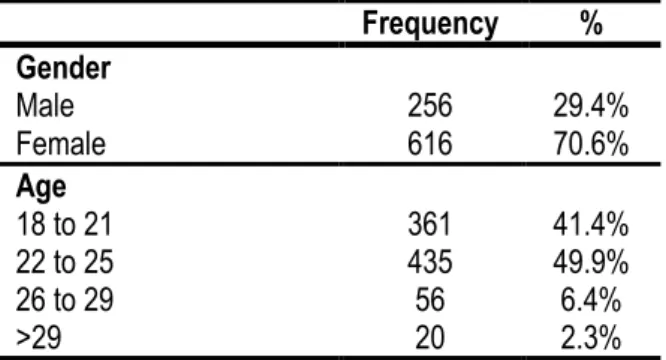
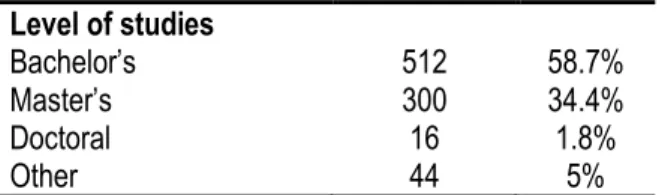
The majority of the respondents were female (70.6%) and being 22 to 25 years old (49.9%); 58.7% were undergoing a Bachelor’s Degree – this uneven distribution is in line with European Union’s report 2012-13 (60.9%, 22.5 years old, 67%, respectively)(European Commission, 2014a)(Table 2).
Table 2 – Sample demographics’ gender, age and level of studies
Frequency % Gender Male 256 29.4% Female 616 70.6% Age 18 to 21 361 41.4% 22 to 25 435 49.9% 26 to 29 56 6.4% >29 20 2.3%
11 This comparison should be taken with caution as the only available EMS data regarding all Portuguese HI published is from 2012-13, and therefore the comparison between different periods of time might not be accurate since the performance of each HI over time is not known.
Chapter 5 – Data and Results 25 Level of studies Bachelor’s 512 58.7% Master’s 300 34.4% Doctoral 16 1.8% Other 44 5%
As foreseeable, 91% of the respondents were from one of the 28 European member states – even though non-European Union citizens could apply to study under Erasmus in Europe, Erasmus+ Programme is set to give even more support to those students, expanding its boundaries (Table 3).
Spanish students alone accounted for 15.4% of the total answers, phenomenon that was also observed on the latest OECD report (2014b, p. 360 - table C4.5).
Citizens from the Eastern European countries represented a big share of the respondents (32.8%), which can be justified by a growing economy seeking for highly skilled workforce (Labaye et al., 2013).
Table 3 – Sample’s demographics’ country of citizenship
Frequency % Country of citizenship European Union (28) 792 91% Spain 134 15.4% Eastern countries12 286 32.8% Non-European Union (28) 80 9.2%
The University of Coimbra, Porto and Aveiro were the Portuguese host HI from where more respondents were studying (32.8%, 27.6%, 17%, respectively; 77.4% in total), which was not a surprise since these three HI accounted for 63.99% of the Portuguese EMS market share in 2012-13 (Table 4).
Table 4 – Sample demographics’ host HI
Geographic area HI Frequency %
Aveiro University of Aveiro 148 16.97%
Coimbra University of Coimbra 286 32.8%
Polytechnic Institute of Coimbra 46 5.3%
Total: 332 38.07%
Porto University of Porto 241 27.6%
Catholic University of Portugal (Porto) 36 4.1%
ESAD 24 2.8%
Polytechnic Institute of Porto 24 2.8%
ESAP 16 1.8%
Others (11) 51 5.85%
Total: 392 44.95%
26
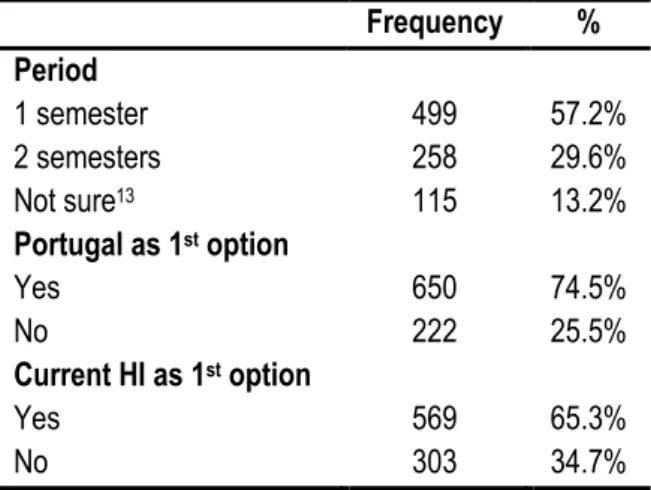
Regarding respondents’ mobility information, 57.2% answered they were going to stay for one semester only, which was also observed in 2012-13 (European Commission, 2014a). 74.5% chose Portugal as their first choice, dropping to 65.3% when choosing their host HI as first option in their preferences (Table 5).
Table 5 – Sample demographics’ mobility period
Frequency % Period 1 semester 499 57.2% 2 semesters 258 29.6% Not sure13 115 13.2% Portugal as 1st option Yes 650 74.5% No 222 25.5% Current HI as 1st option Yes 569 65.3% No 303 34.7%
As the Erasmus+ Programme is well-known, it is normal for an university to have several agreements to send/receive students: 3,267 HI institutions sent students under the Erasmus Programme in 2012-13, number that had been increasing so far (European Commission, 2014a, p. 8), hence 65.3% of the respondents had other countries to choose from and three out of five had other HI to go to when making the selection (60.3%)(Table 6).
Table 6 – Sample demographics’ Host country and HI choices
Frequency % Other than Portugal
Yes 650 74.5%
No 222 25.5%
Other than current host HI
Yes 569 65.3%
No 303 34.7%
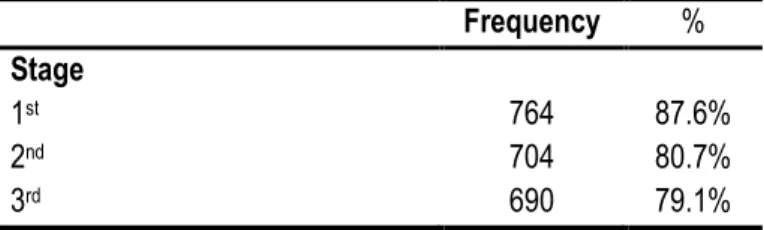
Lastly, and in order to check if an EMS behaved like an ordinary international student, deciding first to go abroad, then to which country to go and finally the host HI, just like defended in the three-stages push-pull model proposed by Mazzarol and Soutar (2002), respondents confirmed the theory: 87.6% first chose to go abroad, then 80.7% chose the host country, and finally 79,1% chose their host HI (Table 7).
13 A student can start by going abroad for one semester and ask for an extension during that period, to a total of twelve months per cycle of studies – the respondents whose answer was ‘not sure’ represent those students that might/are asking for an extension.
Chapter 5 – Data and Results 27
Table 7 – Sample demographics’ flow of decision
Frequency % Stage 1st 764 87.6% 2nd 704 80.7% 3rd 690 79.1%
5.2 M
ETHODOLOGYAll data was inserted and analysed using a statistical software (IMB SPSS Statistics 21) in order to ensure consistency and validity of the proposed structural model.
Firstly a reliability analysis was carried out to check scales’ consistency and validity; then an exploratory factor analysis (EFA) was made in order to identify data’s main relationships and convert them into factors; and finally linear regressions are applied to test the hypothesis.
Skewness and kurtosis allow to understand if the data is set as a normal distribution (kurtosis) by analysing its symmetry (skewness). Curran et al. (1996) recommend skewness and kurtosis absolute values to be below 2.0 and 7.0, respectively, in order to have a population and distribution considered normal.
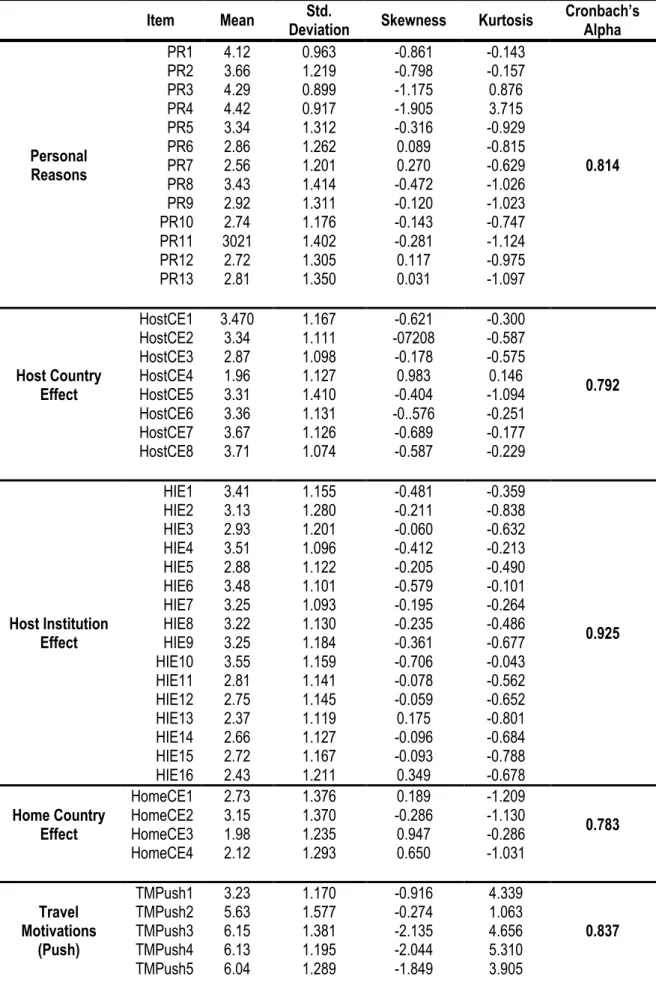
Cronbach’s Alpha was used to assure scales’ internal consistency and reliability of a group of variables (items), expressing the expected correlation between the used scale and other hypothetical scales from the same universe with the same amount of items to measure the same characteristics. Values should spawn from 0 to 1, according to a consistency scale by Pestana and Gageiro (2005)(Table 8).
Table 8 – Reference values for Cronbach’s Alpha
Scale consistency Alpha Values
Very Good > 0.9
Good 0.8 – 0.9
Reasonable 0.7 – 0.8
Weak 0.6 – 0.7
Unacceptable < 0.6
Source: Pestana and Gageiro (2005)
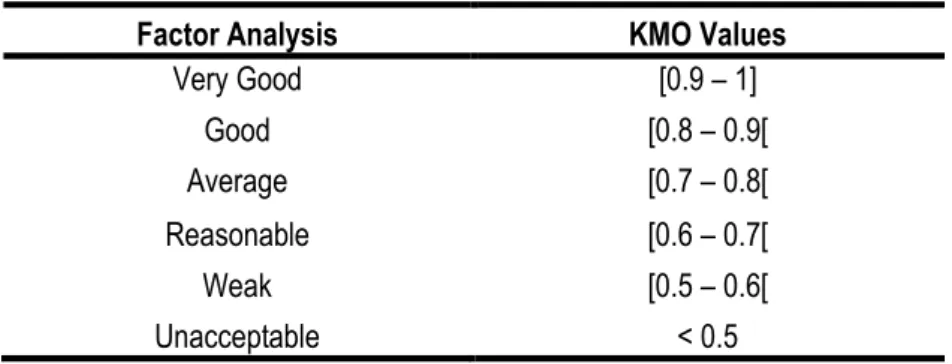
After this reliability analysis has been done, an EFA was conducted. In general there is no consensus among the literature about the minimum data characteristics needed to do an EFA, although several recommendations are available, usually in terms of sample size and subjects-to-variable ratio (STV) – the data set available on this study fulfils the most common recommendations (N = 872, STV = 13:1)(Costello & Osborne, 2005; MacCallum, Widaman, Zhang, & Hong, 1999). Possible underlying factors are identified by examining the