UNIVERSIDADE DE LISBOA
FACULDADE DE CIÊNCIAS
DEPARTAMENTO DE BIOLOGIA ANIMAL
Residency and behavioural patterns of coastal
bottlenose dolphins (Tursiops truncatus) in the
Arrábida and Tróia shores (Portugal)
FRANCISCO OLIVEIRA MARTINS MARQUES MARTINHO
DISSERTAÇÃO
MESTRADO EM BIOLOGIA DA CONSERVAÇÃO
2012
UNIVERSIDADE DE LISBOA
FACULDADE DE CIÊNCIAS
DEPARTAMENTO DE BIOLOGIA ANIMAL
Residency and behavioural patterns of coastal
bottlenose dolphins (Tursiops truncatus) in the
Arrábida and Tróia shores (Portugal)
FRANCISCO OLIVEIRA MARTINS MARQUES MARTINHO
DISSERTAÇÃO
MESTRADO EM BIOLOGIA DA CONSERVAÇÃO
Orientadores:
Doutora Cristina Brito
(Centro de História Além Mar, Universidade Nova de Lisboa)
Professor Doutor Carlos Assis
(
Universidade de Lisboa, Faculdade de Ciências, Departamento de Biologia Animal e
Centro de Oceanografia
)The research included in Chapter 2 and Appendix IV has been presented in the following congress:
Martinho, F., Vieira, N., Carvalho, I. & Brito, I. (2012, March) Photo-id of coastal bottlenose dolphins off Sesimbra (Portugal): New methodological approaches and first results. Proceedings of the 26th Annual Conference ECS, Galway, Ireland.
The research included in Chapter 2 has been presented in the following congress:
Martinho, F., Vieira, N., Carvalho, I. & Brito, I. (2012, April) Patterns of behaviour and residency of coastal common bottlenose dolphins off the Arrábida shores: A first approach. Proceedings of the 9th Annual Congress on Ethology, Lisbon, Portugal.
i
Acknowledgements
It all begun a long time ago, all my parents fault that gave illustrated encyclopaedias to the little me that could not read. The animal kingdom encyclopaedia had an entire volume about dolphins and whales and it was love at first sight! Not much needed to be told, my primary education teacher was the first to teach me the word biologist, my parents fed my hunger for cetacean books andcable TV just make things even worse. If this was not enough my secondary school biology teacher took the class dolphin watching in Sado Estuary and in that summer my parents took me for whale watching in Azores. That was the non-return point, after it I got my first of many cetacean courses in Escola de Mar with my actual supervisor, Cristina Brito and all the girls of the team. In the next year she started to invite me to the research surveys on the Arrábida’s coast, which extended for the last 5 years and many more to come. At that time was when I first meet the dolphins of this study, SBTT041 and SBTT046 were my first ‘resident’ bottlenose dolphins of the Arrábida’s group and we would be meeting some more times in the following years in the presence of more and more frequent individuals.This master thesis could not be done without the help of the persons that I will thank:
Dr. Cristina Brito and Prof. Dr. Carlos Assis for being my thesis supervisors.
Troia Natura, Reseva Natural do Estuário do Sado, Associação para as Ciências do Mar and Escola de Mar for the funding support, allowing the execution of the necessary surveys.
Escola de Mar Team, Cristina Picanço, Inês Carvalho, Nazaré Rocha, Tiago Marques for all the support before and during the thesis writing. Also Herbert Maia, Nina Vieira and Andreia Sousa for the help on the surveys and for collecting data when I wasn’t present.
My parents Isabel Martins and António Martinho which besides all support begun and with the help of my family fed this cetacean interest and provided most of my experiences at sea.
A special thanks to the bottlenose dolphins that besides all their sneakiness and boat avoidance made this study possible and with interesting results, specially for kept appearing in the Arrábida’s shores.
A special thanks to Andreia Pereira, for the constant support, suggestions and for not leaving me fighting alone with the words and phrases, during the writing. Also for choosing to do her 3rd thesis proposal (and final) at my side.
ii
Abstract
In 2011, preliminary data indicated that some coastal individuals were seen more than once over the years, which suggested some level of residency. Considering these aspects, as well as the proximity to the resident protected population of the Sado estuary, we aimed to characterize the coastal bottlenose dolphin population, in terms of their effective level of residency, population size, social structure and behavioural patterns, using two distinct time separated datasets, from 1998-2001 and 2007-2011. Regarding Sado Estuary’s resident population and the resent studies on coastal groups in the adjacent area, a second aimed consisted in the assessment of the occurrence of interactions between both populations and its nature. An additional bibliographic review was undertaken to assess past interactions between the two populations. Using SOCPROG 2.4 it was estimated that in both datasets the dolphin population had a size around 100 individuals occurring in the Arrábida’s coast, showing some level of residency. The social analysis showed that individuals from the earlier dataset formed a very cohesive group, while the present dataset showed to be constituted by two cohesive main groups with low interaction between each other. A revision on Sado Estuary’s past studies showed 6 mixed encounters in the 90s and a recent one in 2010. Additionally, from the analysis of all available catalogues of past studies a total of 119 individuals was counted, from which 41 were non-resident and probably belonging to the coastal population. In the end, there are indications that the coastal population is subdivided in a resident group with few individuals, transient groups that may be seasonal and non-resident groups which occur occasionally. The results of this thesis bring new perspectives in terms of conservation not only of the Sado’s population but also regarding to the bottlenose dolphins’ coastal populations in the entire region.
iii
Resumo
Em 2009, o ICNB aprovou o Plano de Acção para a Conservação e Monitoramento da População roazes do Estuário do Sado, para o qual foram definidas diversas ações prioritárias para a população do Sado. Uma dessas ações consiste em compreender as relações entre as populações residentes e adjacentes de golfinhos-roaz para a construção de acções de gestão adequadas. O objetivo deste estudo consiste em caracterizar os golfinhos-roazes costeiros da zona adjacente do estuário do sado em termos do seu tamanho da população, padrão de residência, estrutura social e padrões comportamentais utilizando dois datasets distintos temporalmente. Foi ainda analisado o modo como a população costeira interage com a população do Estuário do Sado, fazendo uma exaustiva revisão bibliográfica.
Um total de 84 saídas de Mar (388 horas) foram realizadas por Gaspar (2003) entre 1998 e 2001 (dataset 1), e 102 saídas (277 horas) entre 2007 e 2011 (dataset 2). Destes, resultaram 20 avistamentos de roazes para o dataset 1 e 24 para o dataset 2. No entanto, apenas 15 avistamentos do dataset 1 e 12 do dataset 2 apresentaram fotografias para foto-identificação, os quais totalizaram a amostra utilizada para as estimativas. Em 2000 não foram registados avistamentos de roazes apesar do esforço significativo, e no restante período de amostragem não ocorreram flutuações relevantes. Os datasets não demonstraram diferenças estatisticamente significativas no número de saídas de mar a um nível sazonal. A análise efetuada através do programa SOCPROG 2.4 permitiu estimar o tamanho da população, padrão de residência e as associações entre indivíduos. Relativamente ao tamanho da população, para cada um dos dois datasets, a estimativa consistiu em 100 indivíduos. Este resultado indica que é uma população de pequenas dimensões, representando apenas 35% da média das outras populações costeiras. O padrão de residência mais ajustado foi o de população fechada, o qual para os roazes do dataset 1 estimou um grupo de 15 indivíduos residentes, enquanto que para o dataset 2 a estimativa rondou os 28 indivíduos residentes. Os resultados dos modelos para ambos os dataset podem resultar da reduzida dimensão da amostra e poderão vir a ser alterados com mais dados a ser adquiridos de futuro. As associações entre indivíduos demonstraram ser preferenciais e de longo termo. Os níveis de associação dos roazes para o dataset 1, caracterizados como ‘companheiros constantes’, foram os valores mais elevados que qualquer outro grupo de roazes estudados. Na costa da Arrábida parecem existir, pelo menos, três grupos de roazes costeiros: o grupo encontrado para o dataset 1 e dois grupos que pouco interagem do dataset 2. A análise comportamental indicou que o tamanho de grupos é em média de 15 animais, enquadrando esta população
iv entre as populações de roazes que ocorrem em estuários e baías e população maiores que ocorrem em costas e mar aberto.
Para o dataset 2 não foram registados encontros mistos entre as duas populações. Na pesquisa bibliográfica foram encontrados 7 avistamentos mistos, 6 dos quais foram na década de 90 e o mais recente em 2010. Através da análise de foto-identificação dos avistamentos mistos dos datasets foi possível confirmar que pertenciam às populações de roazes costeiros da época respectiva. Nas últimas 2 décadas foram ainda avistados 4 animais costeiros dentro do estuário não acompanhados pelos roazes residentes e 2 carcaças de indivíduos costeiros no interior do estuário. Na análise bibliográfica verificou-se que, de todos os indivíduos catalogados na zona do Estuário do Sado, 41 indivíduos eram costeiros, 26 assume-se que emigraram ou morreram, 7 foram confirmados como mortos, 11 foram crias que provavelmente morreram e actualmente existem 27. Recorrendo a esta informação e intercalando com a informação dos animais presentes ao longo dos anos, detectaram-se eventos relevantes de emigração/mortalidade não confirmada nos anos de 1986, 1990, 1992, 1998, 2004 e 2006 que corresponderam ao decréscimo de indivíduos adultos e juvenis (idade superior a 8 anos). Os resultados demonstram que é imperativo que em estudos futuros se aumente o esforço de amostragem e se alargue a área amostrada. No sentido de aumentar a quantidade de dados passíveis de serem analisados, a colaboração das entidades presentes no local, como outras equipas de investigação e empresas de observação de golfinhos, seria uma mais-valia para o esforço de investigação e conservação desta espécie em Portugal.
Palavras-chave: golfinho-roaz, Arrábida, Estuário do Sado, foto-identificação, população
v
Contents
Acknowledgements ...i Abstract ... ii Resumo ... iii General Introduction ... 1The bottlenose dolphin ... 2
Bottlenose occurrence in Portuguese continental waters ... 3
Conservation status ... 4
Photo Identification ... 4
Objectives ... 5
References ... 6
Residency, behavioural patterns and social structure of coastal bottlenose dolphins (Tursiops truncatus) in the Arrábida and Tróia Shores (Portugal) ... 11
Introduction ... 12
Methods ... 14
Results ... 20
Discussion... 35
References ... 40
First sympatric evidences of coastal and resident bottlenose dolphins (Tursiops truncatus) in Portugal (Sado Estuary and adjacent coastal waters) based on their behavioural ecology .... 47
Introduction ... 48 Methods ... 49 Results ... 51 Discussion... 55 References ... 57 Final Considerations ... 61 Further studies ... 62 Appendices ... 64 Appendix I. ... 64 Appendix II. ... 66 Appendix III. ... 68 Appendix IV.. ... 71
1
2
General Introduction
The bottlenose dolphin
The common bottlenose dolphin, Tursiops truncatus (Montagu, 1821), hereby bottlenose dolphins, is a cosmopolitan species found throughout the world’s tropical and temperate Seas and Oceans.
Tursiops is a polytypic genus (Hershkovitz, 1966). There are a lot of different morphotypes that differ in coloration pattern, body measures, cranial structure, prey consumed, parasite loads and genetics (Walter, 1981; Cockcroft & Ross, 1990) that inhabit all Oceans of the world. As social mammals, bottlenose dolphins are organized in pods or groups and may form populations of two distinct ecotypes on the basis of their gross morphology, haematology, cranial morphology, and parasite faunas: the offshore-pelagic and inshore-coastal forms (Hersh & Duffield, 1990; Ross & Cockcroft 1990; Van Waerebeek et al. 1990; Mead & Potter, 1995). Some of these coastal ecotypes form resident populations in fjords, shallow environments inside estuaries, sheltered bays and inlets (Martin et al. 1990, Williams et al. 1993; Lusseau et al. 2003).
Bottlenose dolphins show daily patterns in their behaviour, such as foraging and feeding, socialising or moving from area to area in relation to environmental cues, such as the tides (Irvine et al. 1981), the time of day (Saayman et al. 1973), and the depth (Wiley et al. 1994). The social structure of bottlenose dolphins is characterized by dynamic units varying from stable and resident groups to groups continually changing in size and membership, with input and output of individuals over time, and a fluid association between these two kinds of structure (fusion-fission) (Ballance, 1990). Little is known about the ranging patterns of pelagic bottlenose dolphins, but coastal dolphins exhibit a full spectrum of movements, including Seasonal migrations, year-round home ranges, periodic residency, and a combination of occasional long-range movements and repeated residency (Wells & Scott, 1999).
As a relatively accessible coastal species, bottlenose dolphins have been studied in detail in various locations around the world. A common finding in previous studies of bottlenose dolphin populations has shown the species to have a fluid and dynamic social structure (Wursig & Wursig, 1979; Ballance, 1990; Smolker et al. 1992, Williams et al. 1993; Wilson et al. 1997). Bottlenose dolphins tend to exhibit varying degrees of residence in particular regions, ranging from small localized in-shore populations, apparently resident to specific embayments, to larger numbers of migratory coastal dolphins which appear to move latitudinally on a Seasonal basis.
3 Long-term studies of bottlenose dolphins resident in Sarasota Bay, Florida (Wells et al. 1987) and Shark Bay (Smolker et al. 1992) have shown that the strongest associations (long-term and high coefficient of association) exist between females and their dependent calves, and in alliances between pairs of sexually reproductive males (Scott et al. 1990, Wells, 1991). Outside of these stronger bonds, members of bottlenose dolphin populations form temporary associations within groups with no apparent long-term pattern of allegiance. In contrast to the highly complex and stable structure of bottlenose dolphin populations in Sarasota and Shark Bay, work in the Moray Firth and the Shannon estuary in Ireland, has shown the only strong bonds that occur are between mother and calf, with little evidence for male alliances among resident dolphins (Wilson et al. 1999; Ingram, 2000).
Within the coastal areas of Great Britain and Ireland, there exists at present three distinct seasonally ‘resident’ populations; one in the Moray Firth, northeast Scotland; one in the Shannon Estuary in Ireland and one in Cardigan Bay, west Wales (Lewis & Evans, 1993; Ingram, 2000). The Moray Firth population is considered to be an isolated or ‘closed population’ (Wilson et al. 1997); that is, births, deaths, immigration and emigration are negligible. In the Shannon estuary and Cardigan Bay the situation is less clear. In Cardigan Bay Grellier et al. (1995) and Evans et al. (2000) believe the population to be ‘open’ i.e. one that changes in size and composition from births, deaths, immigration and emigration over time. It is thought that only a proportion of the bottlenose dolphins are resident throughout the year (Arnold et al. 1997; Lewis & Evans, 1993), and that the population is comprised of both resident and transient individuals (Grellier et al. 1995).
Bottlenose occurrence in Portuguese continental waters
The presence of coastal bottlenose dolphins along the Portuguese coast is already documented (Teixeira, 1979; Sequeira, 1988). However in the following years very few investigations on the subject were conducted towards coastal populations of bottlenose dolphins. In Portugal all research had been directed to the small resident population in the Sado, which was first described in 1863 by Bocage (dos Santos & Lacerda, 1987). It has been the primary focus of cetaceans’ study in Portugal mainland, given that this unique dolphin population is considered one of the smallest populations of the world. With some references along the 20th century, it was only from the 1980’s onwards that this population has been constantly monitored and later surveys indicated a clear residency pattern (Teixeira & Duguy, 1981; dos Santos, 1985; dos Santos & Lacerda, 1987). A continuous approach along the years enabled an estimate for the size of the population and has confirmed the decrease of the
4 ‘Sado’s dolphins’. Firstly, in 1982, estimated as forty animals (dos Santos & Lacerda, 1987), seven years later as thirty (Gaspar, 1994), later as 26 in Augusto (2007). Presently the population is thought to have 26 individuals (roazesdosado.icnb.pt/). The small effective, population aging, the intrinsic characteristics of their own species and degradation of habitat (extrinsic factors to the population) seem to threaten this unique population.
Conservation status
Dolphins and other marine mammals are important species for conservation due to their charismatic features, and to their impact in marine and coastal habitats (most of them as top predators) which contributes to the conservation of entire ecosystems. With its flagship species status, many other marine species can benefit from their protection. Many populations inhabit coastal waters where they are subject to human activities, and as with many other species of small cetacean, there is a demand for the development and implementation of conservation management and monitoring programs. Also the differentiation between coastal and offshore ecotypes is well documented, the distinctions among inshore, and between inshore and coastal areas, are less studied. Furthermore, bottlenose dolphin populations have seen their numbers decreasing in Europe in the last years, as their coastal habits make them susceptible to anthropogenic pressures.
Bottlenose dolphins are listed in Annex II of the European Union’s Habitats Directive; EU governments are required to consider the areas where this species occurs for the establishment of Special Areas of Conservation (SACs) (Wilson et al. 1997). On IUCN red list, Bottlenose dolphin was classified as Data Deficient until 2008, when its status was changed to Least Concern, however, the global population trend is unknown, but in some areas like the Adriatic Sea’s population had decreased.
Photo Identification
Bottlenose dolphins, as well as other dolphin species can be individually identified using photo-identification of their dorsal fins (Würsig & Jefferson 1990), because each individual has a distinct and unique contour. During inter and intra-specific interactions or contact with environmental and anthropogenic factors the thin posterior edge of the dolphin’s dorsal fin may become irregular, resulting in recognisable patterns of notches and scars. Bigg (1982) confirmed the permanency of notches in orcas for at least 7 years (Bigg et al. 1982). Photographs of dorsal fins provide researchers with a non-invasive method of identifying and
5 monitoring individuals over time as there is no need for mark or capture the animals. Related mark-recapture methods have become well established for delphinids and other cetaceans (Würsig & Jefferson, 1990). The validity of this method was confirmed by studies that combined this process with various independent techniques for marking (tagging) and recapture (Irvine et al. 1982; Scott et al. 1990).
Objectives
In 2009 recognizing the uniqueness of the Sado population, the Portuguese Institute for Nature and Biodiversity Conservation (ICNB), approved, through Article nº 21997/2009 de 2 de Outubro, the Action Plan for the Conservation and Monitoring of the Bottlenose dolphins Population of Sado Estuary. The ICNB Action Plan defined several priorities actions for the conservation of the Sado population. One of these priorities actions is to understand the relationships between the resident and adjacent populations for appropriate management actions.
The main goal of this work is to better understand the dynamics and possible relationships between the Sado population and the adjacent populations of coastal bottlenose dolphins in the coastal water of Arrábida and Tróia, using two datasets and combining information from different sources.
Data is lacking from the coastal population of bottlenose dolphins as well as the information between sympatry in the two groups. Considering this and the conservation status for the species, four general goals were aimed:
To estimate the population size of adjacent (coastal) bottlenose dolphins that occurs in the area;
To study the residency and behavioural patterns of adjacent (coastal) bottlenose dolphins in the region;
To analyze the social structure of the adjacent (coastal) bottlenose dolphins;
To analyze the interactions between the resident and adjacent (coastal) bottlenose dolphins using several different sources.
The three first objectives are presented and discussed in the chapter two, while the third chapter considers the last objectives. Besides these aspects, a new methodological approach used in the data analysis was conceived during this study (see Appendix IV).
6
References
Arnold, H., Bartels, B., Wilson, B., Thompson, P. (1997) The Bottlenose Dolphins of Cardigan Bay: Selected Biographies of Individual Bottlenose Dolphins Recorded in Cardigan Bay, Wales. Report to Countryside Council for Wales; CCW Science Report No 209.
Ballance, L.T. (1990) Residence patterns, group organization, and surfacing associations of bottlenose dolphins in Kino Bay, Gulf of California, Mexico. In: S. Leatherwood & R. R. Reeves (Eds.), The bottlenose dolphin (pp. 295-308) Academic Press, San Diego,CA.
Bigg, M.A (1982) An assessment of killer whale (Orcinus orca) stocks off Vancouver Island, British Columbia. Report International Whaling Commission, 32: 655-666.
Cockcroft, G. & Ross, G. J. B. (1990) Food and feeding of the Indian Ocean bottlenose dolphin off southern Natal, South Africa. In S. Leatherwood & R. R. Reeves (Eds.), The bottlenose dolphin (pp. 295-308) Academic Press, San Diego,CA.
Connor, R. C.; Smolker, R. A. & Richards, A. F. (1992) Two levels of alliance formations among male bottlenose dolphins (Tursiops sp.) Proceedings of the Natural Academy of Sciences USA, 89: 987-990.
dos Santos, M. E. (1985) Estudo preliminar da população sedentária de roazes, Tursiops truncatus (Montagu, 1821) (Cetácea, Delphinidae) no estuário do rio Sado (Unpublished bachelor dissertation), Faculdade de Ciências da Universidade de Lisboa.
dos Santos, M.E., Lacerda, M. (1987) Preliminary observations of the bottlenose dolphin (Tursiops truncatus) in the Sado estuary (Portugal) Aquatic Mammals, 13: 65–80.
Evans, P.G.H., Baines, M.E., & Shepherd, B. (2000) Bottlenose dolphin prey and habitat sampling trials. Report to the Countryside Council for Wales. Sea Watch Foundation, Oxford.
Gaspar, R. (1994) Estudo dos movimentos, da sociabilidade e dos padrões de frequentação dos roazes Tursiops truncatus na região do estuário do Sado, utilizando foto-identificação. (Unpublished bachelor dissertation) Faculdade de Ciências da Universidade de Lisboa.
7 Grellier, K., Arnold, H., Thompson, P.M., Wilson, B., & Curran, S., (1995) Management recommendations for the Cardigan Bay bottlenose dolphin population. Contract Science Report No. 134, Countryside Council for Wales, Bangor.
Hersh, S. L. & Duffield, D. A. (1990) Distinction between northwest Atlantic offshore and coastal bottlenose dolphins based on hemoglobin profile and morphometry. In S. Leatherwood & R.R. Reeves (Eds.), The Bottlenose Dolphin (pp. 129-139) London: Academic Press.
Hershkovitz, P. (1966) A catalogue of living whales. Bulletin United States National Museum, 246: 1-259.
Ingram, S.N. (2000) The ecology and conservation of bottlenose dolphins in the Shannon estuary, Ireland. (Unpublished doctoral dissertation) University College Cork, Ireland.
Irvine, A. B., Scott, M. D., Wells, R. S., & Kaufmann, J. H. (1981) Movements and activities of the Atlantic bottlenose dolphin, Tursiops truncatus, near Sarasota, Florida. Fisheries Bulletin, 79: 671 – 688.
Lewis, E.J., Evans, P.G.H. (1993) Comparative ecology of bottle-nosed dolphins (Tursiops truncatus) in Cardigan Bay and the Moray Firth. In P.G.H. Evans, (Eds.) European Research on Cetaceans 7 (pp. 57-62) European Cetacean Society, Cambridge.
Lusseau, D. (2003) The emergent properties of a dolphin social network. The Royal Society. (London)
Mead, J.G. & Potter, C.W. (1995) Recognizing two populations of the bottlenose dolphin (Tursiops truncatus) off the Atlantic coast of North America: morphological and ecological considerations. IBI Reports, 5: 31-44.
Saayman, G. S., Tayler, C. K. (1973) Social organisation of inshore dolphins (Tursiops aduncus and Sousa) in the Indian Ocean. Journal of Mammalogy,54: 993 –996.
Scott, M. D., & Chivers, S. J. (1990) Distribution and herd structure of bottlenose dolphins in the Eastern Tropical Pacific Ocean. In: S. Leatherwood & R.R. Reeves (Eds.), The Bottlenose Dolphin (pp. 387-402) San Diego: Academic Press.
8 Sequeira, M.L. (1988) Mamíferos marinhos da costa portuguesa. Relatório de Estágio da Licenciatura em Recursos Faunísticos e Ambiente. (Unpublished bachelor dissertation) Faculty of Sciences of the University of Lisbon, Lisbon.
Smolker, R. A.; Richards, A. F.; Connor, R. C. & Pepper, J. W. (1992) Sex differences in patterns of association among Indian Ocean bottlenose dolphins. Behavior, 123: 38-69.
Teixeira, A. M. & Duguy, R. (1981) Observations de Delphinidés dans les eaux cotières Portuguaise. Relatórios de Actividades do Aquário Vasco da Gama: 9.
Teixeira, A.M. (1979) Marine mammals of the Portuguese coast. Sonderdruck aus Z.f. Säugetierkunde 44: 221–238.
Van Waerebeek, K.; Reyes, J. C.; Read, A. J. & McKinnon, J. S. (1990) Preliminary observations of bottlenose dolphins from the Pacific coast of South America. In S. Leatherwood & R.R. Reeves (Eds.), The Bottlenose Dolphin (pp. 143-154) London: Academic Press.
Walter, D. G. (1981) Some historical aspects of Taiwanese gillnetting off northern Australia. Pages 5-23 In: C. J Grant & D G. Walter (Eds.), Northern Pelagic Fish Seminar (pp. 5-23) Darwin. Northern Territory: 20-21.
Wells, R. S. (1991) The role of long-term study in understanding the social structure of a bottlenose dolphin community. In: K.S. Norris (Ed.), Whales, dolphins, and porpoises (pp. 199-225) Berkeley: University of California Press.
Wells, R. S., & Scott, M. D. (1999) Bottlenose dolphin Tursiops truncatus (Montagu, 1821) In S. H. Ridgway & R. Harrison (Eds.), Handbook of marine mammals (pp. 137-182) Academic Press, San Diego, CA.
Wells, R. S., Scott, M. D., & Irvine, A. B. (1987) The social structure of free-ranging bottlenose dolphins. In: H. H. Genoways (Ed.), Current Mammalogy (Vol. 1, pp. 247-305) New York: Plenum Press.
Wiley, D.N., Wenzel, F.W.,Young, S.B. (1994) Extralimital residency of the bottlenose dolphin in the western North Atlantic. Marine Mammal Science, 10: 223-226.
9 Williams, J.A., Dawson, S.M. & Slooten, E. (1993) The abundance and distribution of bottlenose dolphins (Tursiops truncatus) in Doubtful Sound, New Zealand. Canadian Journal of Zoology. 71: 2080-2088.
Wilson B., Hammon, PS., & Thompson, P.M. (1999) Estimating size and assessing trends in a coastal bottlenose dolphin population. Ecological Applications, 9: 288-300.
Wilson, B., Thompson, P.M., & Hammond, P.S. (1997) Habitat use by bottlenose dolphins: seasonal distribution and stratified movement patterns in the Moray Firth, Scotland. Journal of Applied Ecology, 34: 1365-1374.
Würsig, B. & Würsig, M. (1979) Behavior and ecology of the bottlenose dolphin (Tursiops truncatus) in the south Atlantic. Fishery Bulletin, 77: 399 – 412.
Würsig, B., & Jefferson, T. A. (1990) Methods of photo-identification for small cetaceans. In P. S. Hammond, S. A. Mizroch, & G. P. Donovan (Eds.), Individual recognition of cetaceans: Use of photo-identification and other techniques to estimate population parameters (pp. 43-52) Cambridge, MA: International Whaling Commission.
11
12
Residency, behavioural patterns and social structure of coastal
bottlenose dolphins (Tursiops truncatus) in the Arrábida and Tróia
Shores (Portugal)
AbstractRecent studies indicate that coastal bottlenose dolphins occurring in the Arrábida’s coast are not part of the Sado estuary resident population. Moreover, in 2011, preliminary data indicated that some coastal individuals were seen more than once over the years, which suggested some level of residency. Considering these aspects, as well as the proximity (and possible interactions) to the resident protected population of the Sado estuary, we aimed to characterize the coastal bottlenose dolphin population, in terms of their effective level of residency, population size, social structure and behavioural patterns, using two distinct time separated datasets, one from 1998-2001 (dataset 1) and a second from 2007-2011 (dataset 2). The photo-identification analysis showed two different groups, for each dataset. Using SOCPROG 2.4 it was estimated that in both datasets the dolphin population had a size of about 100 individuals occurring in the Arrábida’s coast, showing some level of residency. The social analysis showed that individuals from the earlier dataset formed a very cohesive group, while the present dataset showed to be constituted by two cohesive main groups with low interaction between each order. Further research effort is needed in order to repeatedly photograph all animals in the study area in order to assess the Seasonality of the transient groups (semi-resident) and have more support for the year-round residency of the resident group.
Keywords: bottlenose dolphin, Arrábida, SOCPROG, photo-identification, behaviour Introduction
Bottlenose dolphins (Tursiops truncatus) are one of the best known and widespread of the small cetaceans, occurring throughout the world’s tropical and temperate Seas and Oceans (Leatherwood & Reeves, 1982).
Studies in coastal areas suggested that a given population may segregate into communities (Chilvers & Corkeron, 2002; Rossbach & Herzing, 1999; Urian et al. 2009; Wells et al. 1987). Often forming discrete resident assemblages, termed communities, within which each individual will associate with most others (Wells et al. 1987; Williams et al. 1993; Wilson et al. 1997; Bearzi et al. 1997; Ingram, 2000). Community size appears variable, ranging from
13 just a few individuals, to a hundred or more and these units could be geographically isolated (Wells & Scott, 1990; Williams et al. 1993; Wilson et al. 1999). Bottlenose dolphins, live in fission–fusion societies, a constantly changing form of social organization in which large groups undergo fission into smaller units and small units fuse into larger units (Lee 1986; Symington 1990; Mann and Smuts 1999). Being apparently widespread, these communities are perhaps an integral part of bottlenose dolphin social organization and are, therefore, important in both ecological studies and conservation of coastal dolphin populations (Grellier & Wilson, 2003).
Wells et al, (1987) suggests that habitats protected from open Oceans, such as bays and estuaries, may attract small populations with site fidelity and limited movement patterns. Generally, bottlenose dolphins tend to form resident or semi-resident populations across their distribution range. For instance, bottlenose dolphins are year round residents in the Moray Firth and Sarasota Bay (Scott et al. 1990; Wilson et al. 1997), while dolphins identified in Bahia Kino (Gulf of California, Mexico) and in the Shannon Estuary (Ireland) are not year round residents (Ballance, 1992; Ingram & Rogan, 2002).
In Portugal, bottlenose dolphins are described along the coastline, both with resident and transient populations. The occurrence of bottlenose dolphins in the Arrábida’s shores (Portugal, central west coast) has been recorded as long as fishermen use those waters, and individuals of this species were target of captures during the 20th century (Brito et al. 2009). Adjacent to this area, a well known resident bottlenose dolphin population is established, in the Sado’s estuary, which has been the target of several studies (Teixeira & Duguy, 1981; dos Santos, 1985; dos Santos & Lacerda, 1987) and many conservation efforts (Augusto, 2011).
Recent studies indicate that coastal bottlenose dolphins are not part of the Sado estuary resident population (Gaspar, 2003). Moreover, in 2011, preliminary data indicated that some coastal individuals were seen more than once over the years, which suggested some level of residency (Dorribo et al. 2011). Considering these aspects, as well as the proximity (and possible interactions) to the resident protected population of the Sado estuary, the ICNB Action Plan prioritised actions to understand the relationships between the resident and adjacent populations and we firstly aimed to characterize the coastal bottlenose dolphin population, in terms of their effective level of residency population size, social structure and behavioural patterns, using two distinct time separated datasets.
14
Methods
Study area
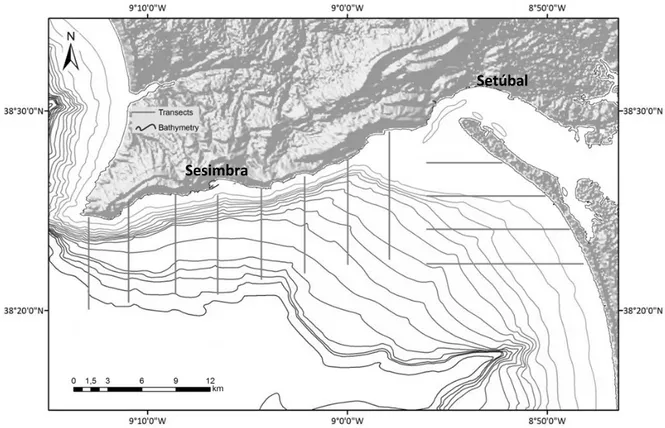
The study area is located in the west Portuguese coast between the Cape Espichel and the Troia Peninsula, along the coast of Arrábida (Fig. 1). This South facing coast provides a sheltered area from predominant northern winds and swells. The Sea bottom in this area is characterized by the conversion of two submarine canyons from two major estuaries, Tejo (Lisboa) and Sado (Setúbal) (Brito et al. 2009) and by the relatively steep Seabed, with depth ranging from 50 m to more than 100 m (Gaspar, 2003). This area is located near the northern limit of the main north-east Atlantic upwelling events and during the summer near shore water temperature is frequently lower than in offshore waters (Henriques et al. 1999) as result of an upwelling event. Also an important marine protected area the ‘Marine Park Professor Luiz Saldanha’ is included in the study area, covering 52 km2 of Arrábida’s coast where restrictions were imposed to fisheries and other recreational activities since 1998.
Figure 1. Arrábida and Troia’s shores, showing the linear transects executed for this study.
Field data collection
Boat-based surveys were conducted between 2007 and 2011and followed two different approaches. Non systematic surveys were undertaken during all study period in order to
Sesimbra
15 increase the encounters with groups of bottlenose dolphins and to guarantee the collection of sufficient photo-id and behavioural data. Systematic surveys were also conducted between 2010 and 2011 and were composed of 12 pre-defined linear transects 6 nautical miles long, separated by 2 nautical miles, covering a 336 km2 area (Fig. 1). Several boats were used for the surveys, ranging from 5.2 m to 7 m, but most surveys were conducted onboard rigid-hulled inflatable boats with outboard motors. Surveys were weather dependent and were only conducted under a Beaufort Sea-state inferior to 4. During the surveys at least one observer was stationed at each side of the boat scanning an area ahead the vessel to approximately 90º from its bow. When a dolphin was sighted, species identification was recorded, as well as time, geographic coordinates, distance to the group, angle, size of the group, predominant behaviour (travelling, feeding, socialising and social-Feeding) (Table 1), Sea state, bathymetry in the position of the sighting and Sea surface temperature, photographs of dorsal fins for posterior identification. The digital cameras used for the photo-identification were reflex cameras with telephoto lens (70-300 and 70-200). Also group photographs and short videos were recorded for behaviour analysis.
Table 1. Definitions of behavioural states for bottlenose dolphin used during the study period following
Shane et al. (1990) and Bearzi et al. (1997).
Behavioural state Description
Travelling General dislocation of the whole group in the same direction at
constant speed, diving for short time periods
Feeding Characterized by erratic dislocation and long dives.
Social Surface activities like jumps (leaps and bows), slicing, as well as
chasings and belly up positions.
Social-Feeding Presence of subgroups presenting the behaviours described above,
associated with long dives.
Resting Moving slowly or drifting in constant direction.
Archived data collection
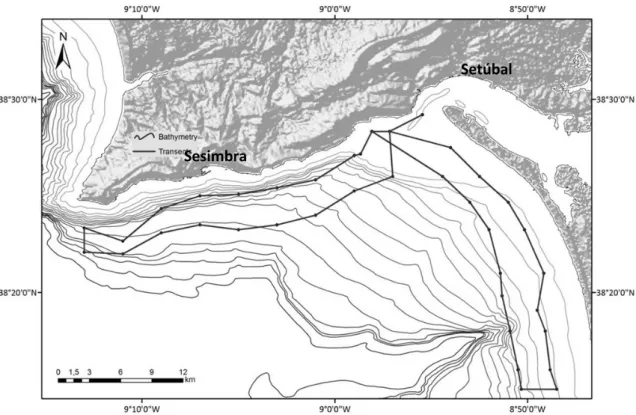
Due to insufficient data for the population analysis, an earlier dataset was incorporated in this study. This inclusion also aimed the accompaniment of the population’s evolution through time, expecting the observation of common individuals in both studies. The
16 information was collected by Gaspar (2003), between 1998 and 2001, following two predefined routes along the Arrábida shore between 1.5 and 3 nautical miles from the coastline, which fits in the same study area. The routes were along the coast line of Arrábida and Tróia, following predefined observation points and covering an area of 285 km2 (Fig. 2). In this study, photographs were taken using motor-driven 35 mm auto and manual focus cameras, with lenses ranging from 50 mm to 600 mm, using Kodak and Fuji colour films. Photographs obtained by this method were digitised with a CanoScan FS4000US.
In both studies the data collected in the field were stored in field sheets and photographs and were analysed similarly.
Figure 2. Arrábida and Troia’s shores, showing the predefined transects executed by Gaspar (2003).
Data Analysis
After each boat trip, all digital photographs obtained in the field surveys, as well as the photographic films from Gaspar (2003), were analyzed and identified. Afterwards, all possible individuals were photo-identified through the permanent marks in dorsal fins, following Würsig & Würsig (1977), Wells & Scott (1990) and Würsig & Jefferson (1990). All recognizable individuals were identified using the tag feature of Windows Live Photo Gallery 2011, which allowed a more efficient and detailed identification of all dorsal fins in the photographs, dispatching posterior individual analysis. A new methodological approach was used in
Setúbal
17 situations of harsher fin identification (see Appendix IV). Calves were not given an identification code, but were tagged as “calves”, which contributed for the identification of adult females by close association to calves (Mann et al. 2000). Photographs with identified individuals were classified in terms of quality according to 5 star categories: 1) bad photograph: blurry and small dorsal fins; 2) poor photograph: slightly blurred with unmarked individuals; 3) satisfactory photograph: 4) good photograph 5) excellent photograph. Only photographs with 3 or more stars were used in order to have more reliable data, since the lower quality photographs of individuals have a lower re-sighting probability. The best photograph of each individual was then used to construct a photo-id catalogue. In order to minimize interferences in individual identification, two different photo-id catalogues were independently constructed, one for the research surveys executed in the 2007-2011 period and another for the 1998-2001 dataset. After these two were concluded, both were merged in a main photo-id catalogue.
Survey effort and SPUE analysis
In order to have a value of sightings relative to the effort undertaken, a sighting rate (SPUE) was calculated, as the number of Sightings Per Unit of Effort, which could be per unit of time (eg. hours) or spatial unit (eg. km). Survey effort and sighting rate between years, Season (Winter, Spring, Summer, Autumn) and month were statistically tested in STATISTICA 7.0 (StatSoft, 2004). Depending on normality distribution tests, t-test (t) or Kruskall-Wallis (H-test) were used with a significance level of p = 0.05.
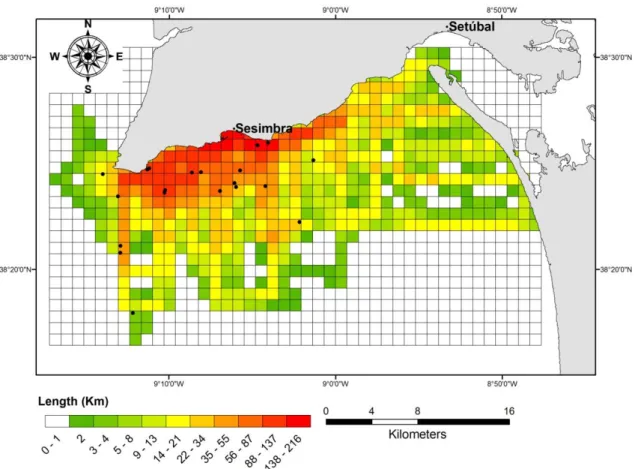
A map of survey effort (km) divided into a 1 km x 1 km grid was created using ArcMap 9.2 (ESRI 2006). Sighting information about environmental parameters such as depth, geographic location was extracted from raster and vector layer through ArcMap 9.2 (ESRI 2006).
Using SOCPROG
SOCPROG 2.4 (Whitehead, 2009) was used to analyse population size, residency patterns and social structure, using both independent photo-id catalogues, as well as the merged one, for comparison purposes. This also means that all sighting without usable photographs could not be included in these analyses.
18 Population size estimation
In this study the term ‘population’ is defined as a group of bottlenose dolphins occupying a particular area at a particular time and are not separated by geographic, demographic or genetic barriers (Krebs, 1994).
A cumulative curve of sightings, also known as ‘discovery curve’ was plotted using sighting histories of all individuals as well as the histograms of the re-sighting frequency. The best fitted model will be given by the lowest Alkaike information criterion (AIC) which measures the discrepancy between data and model by estimating it from likelihood. The degree of support for the other models was given by the ΔAIC. If ΔAIC<2 the other model has some support and should be considered (Whitehead, 2009). The fitting models represent 3 possible population systems; the ‘closed’ model assume neither decline nor growth are significant to the population, the ‘Mortality’ model take into account the population’s decline (emigration or mortality) and the ‘Mortality + Trent’ model take into account both decline and growth. The estimated population size given by the best fitted model was adjusted using a mark rate. A mark rate was calculated as the fraction between identified individuals and the actual number of animals (included unidentified animals, calves and the rejected indentified individuals). The mortality rate was also given by SOCPROG, meaning the rate of individuals that left or died in the population.
Residency patterns
In order to analyse the residency of the bottlenose dolphins in Arrábida’s shore, only the re-sighted individuals were used. Residency may be interpreted as the time spent by an animal in a certain geographical area (Wells & Scott, 1990; Wells, 1991). A resident animal is classified when is re-sighted in consecutive years. A transient animal is classified when is re-sighted in non-consecutive years and a non-resident animal is classified when is sighted only once.
The time of residence was estimated by the Lagged Identification Rate (LIR) using the movement component of SOCPROG 2.4. LIR estimates the probability that an individual in the study area at any time is the same as a randomly chosen individual from the study area t time units later (Whitehead, 2001). LIR was compared with other theoretical models and the best fitted one had the lowest QAIC value. The fitting models range from permanent companions to casual acquaintances where associations eventually fall to zero. The difference between QAIC model values (ΔQAIC) reflects the support for the other less fitted models.
19 Social structure – General associations analysis
Coefficient of association between re-sighted individuals was calculated using the half-weight association index (Cairns & Schwager 1987). This value represented the strength of association between individuals. A dendogram of coefficients of association was plotted using four different models: simple, complete, average and ward. The model with the highest cophenetic correlation coefficient was considered the best fitted to the data. Division of the population into clusters, such that association indices are generally high among individuals in the same cluster, was given by modularity values. Modularities greater than about 0.3 are considered to indicate useful division of the population (Newman 2004).
Social structure and associations
Preferred/avoided associations were tested in which the general null hypothesis is that individuals associate with the same probability with all other. The criteria used were “groups within samples” at 1000 initial permutations as few permutations will generally be conservative and the p-value inaccurate (Manly, 1995). If the real standard deviation (SD) and coefficient of variation (CV) were significantly higher than the permuted, there were preferred or avoided associations. Long-term preferred companionships were indicated by a significantly high SD of the real association indices, whereas short-term preferred companionships were indicated by a significantly low mean of the real association indices.
The analysis of lagged association rate (LAR) consisted in the estimation of the probability that two individuals associated at one moment are still various time lags later (Whitehead, 1995). To account for the sampling effort the null association rate was standardized (SLAR). SLAR was compared with theoretical mathematical models, to determine a best fit for the real data (Whitehead, 2008).
The model with the minimum QAIC was selected as the best fit, and the difference between the best fitted QAIC with other models, ΔQAIC, gave an indication of how well the data support the less favoured ones (Burnham & Anderson 2002). ΔQAIC: 0-2 substantial support for model.
Behavioural analysis
The relation between sightings, effort, environmental parameters and temporal factors, such as Seasonal and annual variances was statistically tested for both datasets. Regarding the behavioural analysis, only the 2007-2011 dataset was analysed since for data collection in the 1998-2001 dataset it was not used the same behavioural classification. Each behavioural
20 category (travelling, feeding, socializing and social-feeding) was analysed influence from geographical location, group size and composition. This last factor was based only in presence of calves, as data for gender analysis was insufficient.
Results
Survey effort and SPUE analysis
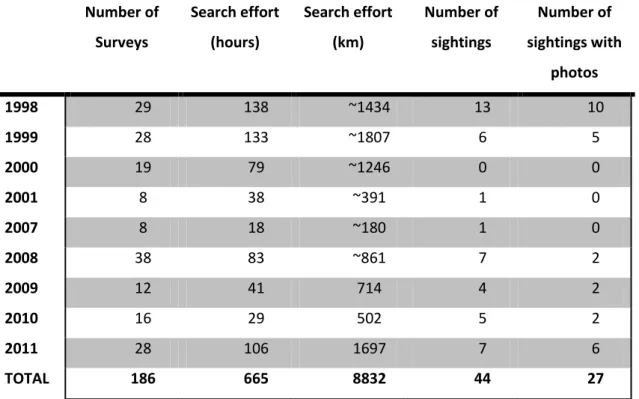
A total of 191 surveys were conducted, with 665 hours of Search effort spent, 84 surveys (388 hours) from Gaspar (2003) and 102 (277 hours) from the present study (Table 2). Overall, 44 bottlenose sightings were recorded: 20 from Gaspar (2003) (hereafter referred as 1998-2001 dataset) of which 15 had photographs available and 24 from the field work (hereafter referred as 2007-2011 dataset). From these last, 21 sightings with GPS localization (Fig. 3) and 12 with photographic sampling. The average sighting rate (SPUE) for both datasets was 0.07 sightings per hour (14h for one sighting) or 0.5 sighting per 100 km, with the 2007-2011 with a slightly higher SPUE.
Figure 3. Survey effort (km) between 2007 and 2011 and bottlenose dolphin sightings (black dots) in
21 Table 2. Summary of research effort in Arrábida and Tróia shores for dataset 1
(1998-2001) and dataset 2 (2007-2011). Number of Surveys Search effort (hours) Search effort (km) Number of sightings Number of sightings with photos 1998 29 138 ~1434 13 10 1999 28 133 ~1807 6 5 2000 19 79 ~1246 0 0 2001 8 38 ~391 1 0 2007 8 18 ~180 1 0 2008 38 83 ~861 7 2 2009 12 41 714 4 2 2010 16 29 502 5 2 2011 28 106 1697 7 6 TOTAL 186 665 8832 44 27
In the 1998-2001 dataset, effort between years was not significantly different (p= 0.0514), but sighting rate of bottlenose sightings was (Table 3) (p< 0.01). In 1999 the sighting rate was half of the 1998’s sighting rate (not significant), culminating in the total absence of bottlenose dolphin sightings in 2000, even after 19 surveys. In 2001 only one sighting was recorded, with 8 surveys. This indicates a non random lack of sightings in 2000. In the 2007-2011 dataset, some fluctuations existed along the years which was reflected in a relatively low p-value (p= 0.0732) however not low enough to be statistically significant.
Table 3. Kruskall-Wallis results for SPUE between the years 1998-2001. Bold p-values and respective
z-values are significant at p < 0,05 and underlined z-values are close to significant.
p\Z 1998 1999 2000 2001
1998 0.68 2.45 1.82
1999 0.49 2.11 1.36
2000 0.014 0.034 0.54
22 Monthly analysis of the effort showed a clear normal distribution in both datasets (K-S d= 0.17864, p< 0.01; Lilliefors p< 0.01) centred on July-August (Fig. 4). A t-test showed that monthly effort between datasets were similar (t= -0.389 ; p>0.5). In the 2007-2011 dataset, sighting rate (SPUE) showed a decrease in August and September (Fig.4, B). The analysis did not shown statistical differences between the other months and Seasons, in both datasets (p>0.05).
SIGHTINGS SURVEYS
Figure 4 Seasonal survey rate and sighting rate of bottlenose dolphin in Arrábida and Tróia shores for
the years 1998-2001 (A) and 2007-2011 (B).
Photo-ID analysis
In the 1998-2001 dataset, group photographs were preferred over individual photographs, as the photo selection aimed to cover all individuals from each sighting but mainly their associations. This resulted in 623 selected photographs from which 105 individuals were identified. In the 2007-2011 dataset, more than 3000 photographs were used for photo-identification, resulting in 150 individuals identified (calves not included). Afterwards, using the cut-off level of 3 stars or more, individuals used for analysis were reduced to 50 for 1998-2001 (See Appendix I) and 70 for 2007-2011 (See Appendix II).
0% 5% 10% 15% 20% 25% 30% 35%
Jan Mar Mai Jul Set Nov
A B 0% 10% 20% 30% 40% 50% 60%
23 Population size estimation
Considering the discovery curves (Fig. 4) the 1998-2001 dataset indicates a stabilisation on the 50 individuals after 13 sightings. At the 12th sighting the number of re-sightings surpassed the total of identified individuals, indicating a possible closed population. In the 2007-2011 dataset the number of identified individuals did not stabilize, even after 12 sightings and 70 individuals recorded, indicating a larger or an open population.
Figure 4. ‘Discovery curve’ (black) and re-sighting curve (grey) of bottlenose dolphin in Arrábida and
Tróia shores in the years 1998-2001 (A) and 2007-2011 (B).
Regarding the population size estimative (Table 4), for both 1998-2001 and 2007-2011 datasets the ‘closed’ model was the best fitted one. Additionally, for the 2007-2011 dataset, ‘mortality’ model was also suitable, given the similar AIC value (ΔAIC=0.06). For the merged catalogues the ‘mortality’ model was the most adequate. The adjusted closed population size estimated a total of 106 (95% CI= 69–192) animals for the 1998-2001 dataset, 153 (95% CI= 132–219) individuals for the 2007-2011 dataset. Regarding the adjusted 2007-2011 ‘mortality’ model the population size estimative consisted in 108 individuals (95% CI= 83–177), with a mortality rate of 0.19 individuals per year. The adjusted population model for the merged 1998-2011 dataset estimated a total of 80 (95% CI= 66–172) individuals, with a mortality rate of 0,38 individuals per year.
0 10 20 30 40 50 60 70 80 1 2 3 4 5 6 7 8 9 10 11 12 13 14 15 N u m b e r o f In d iv id u al s Number of Sightings 0 10 20 30 40 50 60 70 80 1 2 3 4 5 6 7 8 9 10 11 12 N u m b e r o f In d iv id u al s Number of Sightings A B
24
Table 4. SOCPROG fit results of population models for bottlenose dolphins in Arrábida and Tróia shores
in 1998-2001, 2007-2011 and 1998-2011. Underlined values indicate the best fit model, bold values represent population size estimate.
1998-2001 2007-2011 1998-2011 Closed (Schnabel) 80.7 101 232.5 Likelihood 95% - 78.9 – 141.7 174.4 – 325 Bootstrap s.e 95% 52.4 – 145.7 87.1 – 144.7 192.5 – 322.8 AIC 47 74.14 191.9 Mortality 72.2 71.8 56.7 Likelihood 95% - 56.0 – 127.8 56 – 80.5 Bootstrap s.e 95% 58 – 114.6 55 – 116.8 47 – 69.4 AIC 49 74.2 121.9 Mortality + Trend 72.6 71.1 56.3 Likelihood 95% - 55.3 – 169.6 55 – 82.2 Bootstrap s.e 95% 58.9 – 111.3 45.6 – 14823.6 49 – 71.1 AIC 51 76.2 123.9 Adjusted 106.2 108 79.9 Bootstrap s.e 95% 68.9 – 191.7 83–177 66.2 – 171.7 Mortality rate - 0.19 0.38 Residency patterns
The 1998-2001 dataset had an average of sighting frequency for the identified individuals of 2.3 times (SD=2.14; Fig. 6 A), while the 2007-2011 dataset had an average 1.4 times (SD=0.93; Fig. 6 B). The distribution of re-sightings for the 1998-2001 dataset showed a normal distribution (Shapiro-Wilk W= 0.93621, p> 0.20) and an re-sighting average of 5.2 times (SD=1.4). The 2007-2011 dataset had re-sighting average of 2.8 times (SD=1). In 1998-2001 dataset, 68% of the identified individuals were classified as non-resident (only sighted once), 22% as residents and 10% as transients. In the 2007-2011 dataset 74% of the identified individuals were classified as non-resident, 14% as residents and 12% as transients.
25
Figure 6. Sighting frequencies of bottlenose dolphins identified for the years of 1998-2001 (A) and
2007-2011 (B).
The best fitted models for both original datasets were a ‘closed’ population (Table 5). For the 1998-2001 dataset, on average, at a given time, a group of 15 (SE = 0.41) individuals is observed in the specific study area. For the 2007-2011 dataset, the calculated resident group was 28 (SE=1.76) individuals. The best fitted model for the merged dataset of 1998-2011 was ‘Emigration/mortality’ (Table 5), estimating a resident group size of 14 (SE=1.25) individuals, a mean residence time of 824 days (SE= 69.1) (Fig. 7, C) and emigration rate of 0.0012 (SE=0.0001). R² = 0,9571 0 10 20 30 40 1 2 3 4 5 6 7 8 N u m b e r o f In d iv id u al s Number of sightings R² = 0,9917 0 10 20 30 40 50 60 70 80 1 2 3 4 5 N u m b e r o f In d iv id u al s Number of sightings A B A
26
Figure 7. Lagged identification rates (LIRs) for bottlenose dolphins in Arrábida and Tróia shores, between
1998 and 2001 (A), 2007-2011 (B) and 1998-2011 (C). Data points are represented as circles and the best-fit model (A and B, Closed population; C – Emigration + Mortality) is displayed as the dark line.
B
27
Table 5. SOCPROG fit results of movement models for bottlenose dolphins in Arrábida and Tróia shores
in 1998-2001, 2007-2011 and 1998-2011. Bold values indicate the best fit model to LIR. A, B - Closed population; C,D - Emigration/mortality; E, F - Emigration + re-immigration + mortality; G, H - Emigration + reimmigration + mortality.
Model type \ QAIC 1998-2001 2007-2011 1998-2011
A 1400 139.87 2433 B 1400 139.87 2433 C 1402 141.82 1857 D 1402 141.83 1857 E 1404 143.07 2217 F 1404 143.87 1859 G 1406 144.92 1860 H 1406 325.93 1861
Social Structure and Associations
The distribution of coefficients of association (CoA) showed a clear difference on the population structure of both datasets (Fig. 8). The 1998-2001 dataset (A) had a higher amount (Mean=0.63; SD=0.1) of high association indexes than the 2007-2011 dataset (B) (Mean=0.28; DS=0.07). The latter dataset presented most null association indexes between individuals (Mean=0.2; SD=0.06). Since none of the individuals shared both datasets, the null associations rouse up in the merged dataset (C).
28
Figure 8. Coefficient of association plot for bottlenose dolphins in Arrábida and Tróia shores from A)
1998-2011, B) 2007-2011 and C) 1998-2011.
In all datasets, the average model had the highest cophenetic correlation coefficient (Table 6). The dendogram represented in Fig. 9 reflects both merged datasets and has the highest cophenetic correlation coefficient and modularity values, indicating the best representation of the division of the population.
A B
29
Figure 9. Dendogram of associations between individuals based on half-weight indices for bottlenose
dolphins from 1998-2011.
The 1998-2001 cluster is divided in 2 groups. However, since the modularity value is below 0.3 this division is not a good representation. The other two datasets were divided in 3 groups with a better modularity values.
Table 6. SOCPROG cophenetic correlation coefficient results of bottlenose dolphins from 1998-2011,
2007-2011 and 1998-2011. Bold values for modularity represent a useful division of the individuals.
Cophenetic correlation coefficient 1998-2001 2007-2011 1998-2011
Average 0.871 0.849 0.940 Single 0.863 0.821 0.828 Complete 0.725 0.833 0.894 Ward 0.759 0.786 0.884 Modularity 0.085 0.377 0.574 Number of groups 2 3 3
In the preferred/avoided associations test the p-values from the permutations test stabilized at 1000 permutations. Real associations CV and SD are significantly higher that the permuted, indicating long-term preferred/avoided associations in all datasets (Table 7).
1998-1999
30
Table 7. SOCPROG preferred/avoided associations test results. Real values represent observed data and
random values represent the generated values from 10,000 permutations. Bold values denote there is evidence to reject the null hypothesis.
1998-2001 2007-2011 1998-2011
Real association indices 0.632 0.277 0.195
SD 0.184 0.302 0.296
CV 0.290 1.088 1.517
Random association indices 0.00063 0.00003 0.0002
SD 0.00018 0.00003 0.0003
CV 0.00029 0.00011 0.0015
p-value 0.001 0.0001 0.000
All except the 1998-2001 dataset showed to best fit to the casual acquaintances model for associations (Table 8). The best fit for 1998-2001 was the constant companions, but the casual acquaintances model still have substantial support (ΔQAIC = 1.6).
Table 8. SOCPROG model fitting results to the standardized lagged association rate (SLAR) for bottlenose
dolphins in Arrábida and Tróia shores from 1998-2001, 2007-2011 and 1998-2011. Bold values indicate the best fit model to SLAR.
Model type \ QAIC 1998-2001 2007-2011 1998-2011
Constant companions 6937.81 567.42 5461.10
Casual acquaintances 6939.44 561.87 5458.99
C. c. and c. acquaintances 6940.99 571.42 5464.41
Two levels of c. acquaintances 6943.07 565.81 5462.75
Number of days - 750 >800
The standardized lagged association rate (SLAR) is represented in Fig. 10. The 1998-2001 period, apart from some variations, remained constant above the null association rate days (Fig, 10, A). The 2007-2011 period showed association rates decaying through time eventually touching the null rate at 750 days (Fig. 10, B). The 1998-2011 dataset showed to be an average of both, with the association rate decaying, but keeping above the null association rate after 800 days (Fig. 10, C). The large error bars reflect the lack of consecutive sampling days and long periods of time between the sightings.
31
A
32
Figure 10. Standadized lagged association rates (SLARs) of bottlenose dolphins from A) 1998-2001; B)
2007-2011 and C) 1998-2011. Bars represent 1 standard error calculated using jackknife. The null association rate represents the theoretical SLAR if individuals associated randomly. The third curve represents the best-fit model A) Constant companions B) and C) Casual acquaintances) based on the
log-likelihood ratio for the dataset.
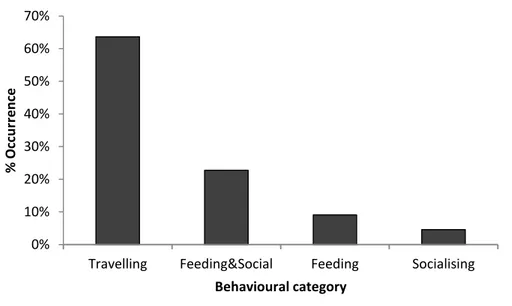
Behavioural analysis
The most observed behaviour was travelling, representing more than a half of the recorded behavioural data (Fig. 11). Most common group size was between 10 and 20 individuals (Fig. 12). Frequency of group size categories showed no statistical differences between behavioural classes (p < 0.05, Fig. 13). Considering group composition, calves were present in all behavioural categories except feeding (Fig. 14) and there were statistical differences between behavioural classes (p<0.01).
Besides a general indication of preference for steep sea bottom areas, there were not found any behavioural patterns in the geographical location of the respective behaviours (Fig. 15).
33
Figure 11. Frequency of behaviour of bottlenose dolphins in Arrábida and Tróia shores (n = 22).
Figure 12. Frequency of group size of bottlenose dolphins in Arrábida and Tróia shores (n = 21).
0% 10% 20% 30% 40% 50% 60% 70%
Travelling Feeding&Social Feeding Socialising
% Occ u rr e n ce Behavioural category 0% 10% 20% 30% 40% 50% 60% 1-10 11-20 21-50 51-100 % Occ u rr e n ce Group Size
34
Figure 13. Frequency of group size of bottlenose dolphins in each behavioural category (n = 20).
Figure 14. Frequency of calves of bottlenose dolphins in each behavioural category (n = 8).
0% 25% 50% 75% 100%
Socialising Travelling Feeding Feeding&Social
% Occ u rr e n ce Behavioural category 1-10 11-20 21-50 51-100 0% 10% 20% 30% 40% 50% 60% 70% 80% 90% 100%
Feeding Travelling Socialising Feeding&Social
% Occ u rr e n ce Behavioural category
35
Figure 15. Geographical location of bottlenose dolphin behaviour in Arrábida and Tróia shores.
Discussion
Survey effort and sighting rate (SPUE)
This study represents the first attempt to document and assess the population status of bottlenose dolphins occurring in the Arrábida Shore. However, the survey effort was limited and there were differences between Seasons which might have influenced the results. A significant decrease in bottlenose dolphin sightings in 2000 compared with other sampled years was found despite similar survey efforts. A similar tendency in this area was also observed in harbour porpoise sightings (Martins, 2004). In terms of sighting effort and photo-identification analysis, the earlier local population (1998-2001 dataset) of bottlenose dolphin seemed to be replaced over time by the present population (2007-2011 dataset), which was surprising given the tendency of some individuals to return to a specific area. This may be related to unknown ecological or anthropogenic factors or events. It is known that fishery intensity, such as trawling, affects social structure and movements of bottlenose dolphins. The Arrábida coast is an area where trawling and other fisheries that may affect bottlenose dolphins occur. Further studies about fishery intensity and direct and indirect impacts on bottlenose dolphins are needed to assess this hypothesis. Shane et al. (1986) suggests that
Sesimbra