MASTER IN FINANCE
THIS REPORT WAS PREPARED EXCLUSIVELY FOR ACADEMIC PURPOSES BY DANIEL WANG YAO AND XIAOQIANG CHEN, A MASTER’S IN
FINANCE STUDENT OF THE NOVA SCHOOL OF BUSINESS AND ECONOMICS.THE REPORT WAS SUPERVISED BY A NOVA SBE FACULTY MEMBER, ACTING IN A MERE ACADEMIC CAPACITY, WHO REVIEWED THE VALUATION METHODOLOGY AND THE FINANCIAL MODEL.
(PLEASE REFER TO THE DISCLOSURES AND DISCLAIMERS AT END OF THE DOCUMENT)
Page 1/39
§ Based on our valuation model, the investment recommendation for Nike is BUY, with a target price of USD 103.48, which represents a 39% upside comparing to the current price of USD 74,64. It is believed that the market underestimates Nike’s “Consumer Direct Offense” potential that is still in its early stages.
§ Nike has overcome the declining tendency observed during the H1 of 2018, with revenue growth of 13%/10% in 4Q18/1Q19, driven by double-digit growth in the international segment and Nike’s Direct channel. The highlight goes to Greater China, where the company has grown at a compounded annual rate of 20,1% and successfully increased its market share from 11% in 2015 to 13,1 % in 2018.
§ Casualization of dress codes and increasing health consciousness among the world population is incrementing the participation rate of sports in international markets. As a result, Sportswear market growth outpaces the traditional apparel and footwear industries, 8% compared to 5% and 6% in 2018. The market is expected to continue to grow at the same rate and by 2022 it will be worth 420 billion USD.
§ Adidas’s momentum in North America is slowing, particularly in the footwear industry. Its year over year growth rate decreased from 20% (2Q17) to 4% (2Q18).
Company description
Nike Inc. is the world leading company in the Sportswear industry, with revenues over 36 billion USD in 2018.
The company has a dominant position in the American athletic footwear industry with 23,4% market share and has a wide international presence, selling its products to more than 190 countries worldwide.
The company also wholly owns subsidiary brands: Converse, Hurley and Jordan brand.
NIKE
I
NC
.
C
OMPANY
R
EPORT
FOOTWEAR AND APPAREL 26NOVEMBER 2018
STUDENT: DANIEL WANG YAO &XIAOQIANG CHEN
[email protected]
Nike’s Supremacy
Shift from wholesaler to direct to customer
Recommendation: BUYPrice Target FY19: 103.82 $
Price (as of 4-Jan-19) 74.64 $
Bloomberg: NKE:US
52-week range ($) 60.13-86.04
Market Cap ($b) 118.505
Outstanding Shares (m) 1273,07
Fiscal Year End 31 - May - 2018
Source: Bloomberg
NIKE vs S&P 500 stock returns, rebased Source: Bloomberg
(Values in $ millions) 2018 2019E 2020E
Revenues 36397 40016 43886 YoY 6% 10% 10% GP 15956 17723 19700 EBITDA 5192 5739 6587 EBIT 4445 4882 5687 NOPLAT 2028 4150 4834
Source: NIKE Inc. Annual report 2018, Bloomberg and own estimates
Key Executives
Phil Knight Chairman Emeritus
Mark Parker Chairman & CEO
Andrew Campion Executive VP & CFO
NIKE INC. COMPANY REPORT
PAGE 2/39
Table of Contents
NIKE CASE STUDY ... ERROR! BOOKMARK NOT DEFINED. VALUATION ... ERROR! BOOKMARK NOT DEFINED. COMPANY OVERVIEW ... ERROR! BOOKMARK NOT DEFINED. COMPANY DESCRIPTION ... ERROR!BOOKMARK NOT DEFINED. BUSINESS OVERVIEW ... ERROR!BOOKMARK NOT DEFINED. BRAND OVERVIEW ... ERROR!BOOKMARK NOT DEFINED. • NIKE ... ERROR!BOOKMARK NOT DEFINED.
• JORDAN BRAND ... ERROR!BOOKMARK NOT DEFINED. • CONVERSE ... ERROR!BOOKMARK NOT DEFINED. • HURLEY INTERNATIONAL ... ERROR!BOOKMARK NOT DEFINED. SHARE PERFORMANCE ... ERROR!BOOKMARK NOT DEFINED. SHAREHOLDER STRUCTURE ... ERROR!BOOKMARK NOT DEFINED.
THE SECTOR ... ERROR! BOOKMARK NOT DEFINED. INDUSTRY OVERVIEW ... ERROR!BOOKMARK NOT DEFINED. COMPETITORS ... ERROR!BOOKMARK NOT DEFINED.
KEY DRIVERS ... ERROR! BOOKMARK NOT DEFINED. ATHLEISURE ... ERROR!BOOKMARK NOT DEFINED. WOMENSWEAR ... ERROR!BOOKMARK NOT DEFINED.
DIGITAL AND DIRECT TO CONSUMER ... ERROR!BOOKMARK NOT DEFINED. MARKETING ... ERROR!BOOKMARK NOT DEFINED.
INTERNATIONAL SEGMENTS ANALYSIS .... ERROR! BOOKMARK NOT
DEFINED.
COMPARABLE COMPANY ANALYSIS ... ERROR! BOOKMARK NOT
DEFINED.
VALUATION ... ERROR! BOOKMARK NOT DEFINED. APPENDIX ... ERROR! BOOKMARK NOT DEFINED. FINANCIAL STATEMENTS ... ERROR!BOOKMARK NOT DEFINED. REPORT RECOMMENDATIONS ... ERROR!BOOKMARK NOT DEFINED.
NIKE INC. COMPANY REPORT
PAGE 3/39
NIKE case study
Nike Inc., founded in 1964 and with headquarters in Beaverton, United States, is considered to be one of the most important players in the global apparel and footwear industry, and number one player in the sportswear sector. The company has a very complete selection of products to wide variety of sports, from football to golf or to surf, able to supply the most exigent consumer/athlete to the ones that value causality and fashion.
The company presented recently a new strategic plan “Consumer Direct Offense”, where the company aims to make 50 billion USD in sales by 2022. Beating investors and analysts’ expectations for more than 3 successive quarters, the new strategy had given it first prizes with the strong annual results and a compounded annual rate (CAGR) 6,4% from 2015 to 2018. The company has been able to transfer its sales to the Nike Direct channel, where sales grew 11% on the offline channel and 33% on the online channel respectively.
There are some risks associated with the company’s growth strategy. However, Nike is well insured against currency changes, well diversified in its manufacturing, US tariff changes might have a slight impact in the company’s ability to meet its targets and transitioning of its overly big wholesale channel to Nike Direct can be harder than expected as well as ability to continue to innovate.
The biggest competitor is Adidas, a German company that is focusing on attacking Nike’s core market (North America). The German brand, has benefited from positive momentum in the retro and athleisure segments, resulting in strong double-digit quarters and market share gain. Moreover, Adidas’s have presented similar strategies in its supply chain and manufacturing process as Nike, focusing on delivering products faster (Speed) and investing heavily in 3D printing footwear.
Valuation
Our DCF valuation model estimates a target price of USD 103,82 per share. The current price is USD 74,64, which will have an upside of 39%to the current value. It leads to a strong buy recommendation, based on the belief of Nike being underestimated by the market.
Transitioning from wholesale channel to Nike Direct can be harder than expected
Biggest competitor Adidas is focusing in attacking Nike’s core market
BUY recommendation with price target USD 103,82
Largest sportswear brand in the world
Consumer Direct Offense aims 50 billion in sales by 2022
NIKE INC. COMPANY REPORT
PAGE 4/39
Company overview
Company description
Nike Inc. is a U.S. based company whose activities include the design, development, promotion of active apparel, footwear, equipment, services and accessories. In the 2018 fiscal year, Nike accounted more than 73100 employees in more than 190 countries and generated more than 36 billion dollars in sales, maintaining its leadership position in the sportswear market.
Founded by Phil Knight and Bill Bowerman and headquartered in Oregon, US, had its first origins in 1964 with Blue Ribbon Sports Inc., a company founded by Phil that worked as the exclusive distributor of Japanese brand Onitsuka Tiger (now Asics), known at the time for its high-quality athletic footwear.
Despite successful sales as a distributor, the partnership between the two companies ended in 1972, since the Japanese counterpart was not able to satisfy the US demand and product innovation that Bill desired. As a result, in 1971, the company inspired in the Greek goddess of victory, changed its name to Nike Inc. and presented as a logo “the swoosh”. Moreover, in that same year Nike signed its first endorsement contract with an athlete, a successful marketing strategy that highly contributed to the company’s growth.
Another critical factor for the company success, was Bill’s vision and knowledge about the sports industry and the athlete’s needs. For instance, Bill developed lighter and more durable shoes for runners and was responsible for introducing jogging in the American market in the 1970s. In 1980, Nike created a new shoe, to be used in grass and turf, named “Nike Shark”. First mover and product innovation have been two key factors for its success and differentiation from its competitors. In 1984, it signed a contract with the NBA rookie star Michael Jordan and in 1986 the brand sales surpassed 1 billion dollars for the first time. In 1989, surpassed Reebok as the best-selling sportswear brand in North America and in the turn of the new millennium it consolidated its position as the best-selling sportswear brand worldwide offering a diversified portfolio of products.
On its way to success, Nike has made several acquisitions, up until 2008 the company only targeted companies that were strategically related to its existing markets, prioritizing product extension and horizontal growth. Nike’s first acquisition was the upscale footwear brand Cole Haan and in 1994 Nike acquired hockey product giant Bauer. In 2002, the company further expanded to the surf apparel and acquired Hurley International, a year later the company acquired Converse, its basketball shoe competitor, and Chuck Taylor, “All Start” sneakers for a 305 million dollars deal. However, in 2008 the company announces its first divestiture, Bauer while acquiring the soccer apparel titan Umbro in the same year.
In 2012, the company announces its intention of selling two wholly-owned subsidiaries, Umbro and Cole Haan, with the objective of focusing its resources on its highest-potential brands, such as Jordan brand, Converse and Hurley, accelerating growth and continue to deliver innovation. In recent years, Nike is focusing on strengthening its digital capabilities, as a result in 2016, acquired the tech startup dedicated to fan communities and mobile shopping, Virgin Mega. Moreover, this year Nike acquired a leading consumer data analytics firm Zodiac Inc. and an Israeli computer vision company, Invertex, Ltd.
Successful marketing
strategy highly contributed to the company’s growth
Responsible for introducing jogging in the American market
Best-selling sportswear brand in North America since 1989
Major acquisitions in order to prioritize product extension and horizontal growth
NIKE INC. COMPANY REPORT
PAGE 5/39 Focusing on its portfolio of brands: Nike, Hurley, Converse and Jordan brand. The company current plan, Consumer Direct Offense, runs until 2022 and aims to achieve 50 billion dollars in revenues within the next four years. Moreover, Nike believes offering a unique consumer experience will leverage the company towards their sales goal. Therefore, Nike plans to shift its sales from wholesale to the direct to consumer channel and is making big changes in its supply chain and manufacturing. Moreover, the company’s recent company’s acquisitions are the commitment in using data and artificial intelligence to transform the future of retail.
Business overview
The company reports its business in different brands, product categories, distribution channels and geographical regions, aiming to supply the entire global market and consumers, by satisfying different demands from its customers. As mentioned in the previous chapter, the company sells its products through different brands, from figure 1, we can identify that the biggest source of revenue, is the original brand Nike, where it accounts for 85% of the group’s total revenues with 31 billion USD, 6,4% compounded annual rate from 2015 to 2018, with growth mainly driven by high-single-digit sales increase in running and sportswear categories. Converse brand following weak and underperforming years, sales decreased 8% in 2017, represent 1,886 million USD and 5,2 % of the group total sales, while Jordan Brand sales account for around 10% and Hurley sales are not disclosed, therefore included in Nike’s brand sales.
In terms of product category, Nike (excluding Converse) generates revenues mainly through three categories: footwear, apparel and equipment. Originally born as an athletic footwear company, this category contributes for more than 61% of the sales of the group registering a compounded growth rate of 6,7% from 2015 to 2018. However, the highest growing category with 7,5% is apparel, accounting for approximately 30% of the group’s total revenues with 11 billion USD, driven especially by the casualization in wearing and the growth of athleisure wear. Equipment refers to sports accessories, such as balls, bags, protection equipment, watches and others, decreasing 5% yearly since 2015, it is the smallest category for the brand accounting for only 4% of the annual revenues. (see figure 2)
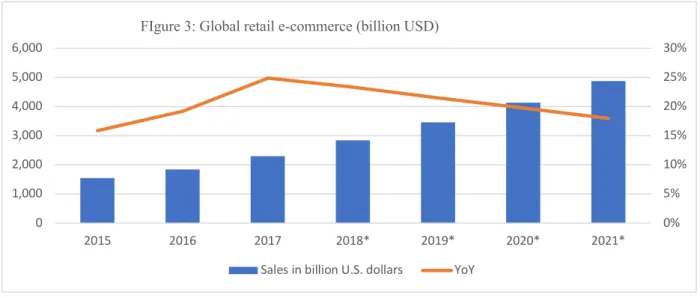
Following regional restructuring and changes in the strategy, the company reports in four different geographical areas, where the highlight goes to the North American market with 43% of total revenues but with the slowest growth with 2,6%, CAGR. Europe, Middle East & Africa (EMEA) and Greater China have been gaining importance over the last years, contributing with 27% and 15% respectively and driving the highest growth with 9,1% and 18,7% CAGR. Asia, Pacific and Latin America (APLA) revenues contribute to around 15% of the total, with a moderate compounded growth rate around 3,5%, mainly affected by the political instabilities of Latin American economies during the period.(see figure 3)
Nike’s sales are mainly generated through its Wholesale channel, where it accounts for almost 24 billion in sales or 70% of its annual revenues. In its wholesale channel, the company has partnerships with around 30 000 retail accounts. However, the revenues in the wholesale segment grew at an annual compounded rate of 3%. (see figure 4) with such a slow growth the company announced in the 2015 Investors day, the objective of restructuring and reducing its wholesale channel to only 40 key partners, among them Nordstrom, Foot Looker or Dick’s sporting goods. It’s strategic change, have the objective of offering more personalized customer experience, while offering more high-quality products, in order to propel growth through higher prices.
Using data and artificial intelligence to transform the future of retail
Fig.1
Fig.2
Fig.3
NIKE INC. COMPANY REPORT
PAGE 6/39 Moreover, the company is focusing on the development of its Direct to Consumer (DTC) channel, referred by the company as Nike Direct, where sales accounted for 30%. Nike’s Direct growth was driven by sales in self-owned retail stores, where it owns a total 1182 physical stores (790 in the international market and 392 in the United States) with 22% of sales and 12% annual compounded growth (see figure 5). However, Nike digital platforms and mobile phone applications, such as Nike+ and SNKRS app, account with more than 100 million users, generated 8% of the company’s sales and grew at 33% compounded rate which reflects the company focus in the development of its DTC channel.
Nike’s investments in technology are not only applied in its digital platforms and product development but also in the manufacturing process, with focus in sustainable and efficient production. The company has been implementing more efficient processes and environmentally friendly materials, for instance the company has been using recycled materials and 3D printing in its sub-contractor factories. Moreover, the company outsources 100% of its manufacturing in order to minimize its costs. Nike is connected with 123 footwear factories across 13 countries where China, Indonesia and Vietnam produced approximately 26%, 21% and 47% respectively. Other than the 94% produced by the top 3 Asian countries, the company also operates footwear manufacturing facilities focused in local markets in Italy, India, Argentina, Brazil and Mexico. Regarding apparel, Nike is supplied by 321 apparel factories in 36 countries, where the top manufacturer is China (26%), followed by Vietnam (18%) and Thailand (10%).(see figure 6 and 7)
Being the leader in the industry, its push for innovation and research development is widely recognized, and since 2009 it doubled the number of patents, with more than 20 000 patents issued worldwide, largely outpacing the number two Adidas with only 2500 patents. Despite outsourcing the majority of its production to Asian countries, the company makes its research, design and development in-house, with investments made in the recently opened Advanced Product Creation Center, located in its headquarters. Other investments include, new and remodeling of own- retail stores and franchise stores and IT investments, accounting for a total of 467 million USD in capital expenditures in 2018.
In terms of operating expenses, the company reports operating overhead expenses and demand creation expenses, also known as marketing expenses it represents 1/3 of the company’s expenses or 3,6 billion USD in 2018. While operating overhead expenses consist of wages, administrative and R&D related costs, accounts for 7,2 billion USD or 2/3 of the company’s expenses.
Brand overview
Fig.5
Fig.6
NIKE INC. COMPANY REPORT
PAGE 7/39 Introduced in the previous chapters, Nike Inc. has several brands in its portfolio that reinforce the positioning of the group in different areas, Jordan brand in basketball, Hurley in surf and Converse in lifestyle categories.
• Nike
The original brand Nike, is among one the most recognized brands around the world with the swoosh logo and its “Just do It” slogan. Inspired in the motto that everyone’s an athlete the company offers its products from the perfomance athlete to the casual practioner. The brand identifies 6 key product categories: training, footbal, Nike basketball, running, sportwear and others (includes various other sports such as baseball, golf, american football, etc.). In total, Nike brand generated 27 billion USD as wholesale equivalent in 2018, and grew at a compounded annual rate of 5,5%, from 2015 to 2018.
• Jordan brand
Jordan brand is an in-house born brand, that resulted from the partnership between Nike and the professional basketball player Michael Jordan in 1984. It has the iconic player silhouette, known as “The Jumpman” as a logo and since its debut, it had played an enourmous success among the basketball community, frequently solding out its sneakers just days after the launch of a new collection. For instance, the Jordan Brand has a share of 15,7% in the US footwear market and 65% in the 3 billion US retro basketball footwear category, being the best-selling brand in the US, surpassing Adidas 9,3%, according to NDP Group. Moreover, it has been one of the top drivers of Nike with 2,9 billion dollars USD in sales and contributing for 10% of the company sales. (see figure 8)
• Converse
Founded in 1908, Converse is an iconic American brand that was a dominant player in the basketball court shoes until the 1970s. After suffering competition from Adidas and Puma the company’s dominance vanished from basketball, and showed a revival in the 1980s, with the popular Chuck Taylor sneakers in the lifestyle format. After filing for bankruptcy, Nike buys the company for a 305 million USD deal. Benefiting from synergies of Nike’s supply chain and manufacturing structure to expand the company worldwide, it turns to be one of the best Nike’s investments from 205 million USD to nearly 1,9 billion in sales in 2018, the company grew at a compounded annual rate of 19%(see figure 9). Currently, the company has 112 stores in the US and 61 stores internationally and is focused on international growth and expansion to the skateboarding sneakers segment.
• Hurley International
Founded in 1999, by Bob Hurley in Costa Mesa, California. The surf brand was acquired by Nike in 2002, following its failure in entering in the surf and skateboarding apparel market. At the time of the acquisition, Hurley was only present in the American market and had revenues around 70 million USD. Fast-forward 11 years (2013) and Hurley grew into a 260-million-dollar business, joining the same synergies as Converse. In 2014, Nike’s started to report Hurley’s sales integrated in the Nike’s brand business, without disclosing the detailed amount of the business. However, the brand has now 29 stores in the US and 17 stores across the world, where Japan is one the company’s most successful markets with 17% of the worldwide stores (see figure 10). Moreover, in 2017 the brand had the most successful team of surf around the world with the WSL champions John John Florence and Carissa Moore.
Share Performance
Fig.8
Fig.9
NIKE INC. COMPANY REPORT
PAGE 8/39 In December 1980, Nike began trading publicly with an initial issue of more than 2 million Class B shares at USD 0,18 per share. Later, Nike was selected to be listed on New York Stock Exchange (NYSE), and in the America Stock market index S&P 500 eight years later. Currently, Nike is included in numerous stocks indices, for instance, MSCI World Consumer Durable & Apparel (MXW0CA Index), and as of September 20, 2013, the Dow Jones Industrial Average (INDU Index).
In 6-year period, Nike´s share registered a compound annual growth of 21%, while the S&P500, MSCI World Consumer Durables & Apparel and Dow Jones Industrial Average had lower performance, with 12%, 7% and 12% respectively (see figure 14). When compared with its peers, Nike outperformed Adidas (ADS GY), Under Armour (UAA US) and Puma (PUM GY) which had compound annual growth of 19,3%, 10,1% and 12,1%, respectively (see figure 13). From the graph, we can identify that the company has been growing steadily over the period, which reflect the successive earnings surprise quarters. The growth is evident since the 4Q of 2017 and drives Nike to gain more than 120% year on year and become one of the best performing stocks in 2018. After 4Q of 2018, the company surpassed the second-best performer Adidas, which are a result of strong financial performances and earnings growth, reaching an all-time high of USD 86,04 per share, on September 21st, 2018.
Shareholder structure
Nike has in total 1,621 billion shares outstanding, investment advisors are the largest shareholder group, with 87,48% of the total shares outstanding. Among the investment advisors, Capital Group Cos Inc. had the biggest position with 10,12%. (see figure 11)
Taking into account the geographic breakdown of the shareholders, United States accounts for the majority with 82,15 % of the total shares outstanding, followed by United Kingdom, Canada and Japan, with 4,58%, 2,59% and 2,13% respectively. (see figure 12)
Following the positive results, in June of 2018 Nike announced a new repurchase program of USD 15 billions of its class B shares over four years. The program is expected to start upon the completion of the existing program, which is planned to end within the fiscal year 2019. It is highly appreciated by investors since it reduces the number of shares outstanding and increases the value of the remaining shares in the market.
The Sector
Industry Overview Fig.11 Fig.12 Fig.13 Fig.14NIKE INC. COMPANY REPORT
PAGE 9/39 Nike is part of the accessories, footwear and apparel design industry, which is worth 1622 billions of dollars in 2018, according to Euromonitor. The industry is extremely fragmented, as there are numerous players in the market competing for different categories, resulting in a tiny market share for each player, led by luxury giant Christian Dior SA, followed by fast-fashion Inditex SA and sportswear company Nike Inc.
In a sector where growth rates vary widely between the three industries, apparel, footwear and sportswear, we observe the high growth in the sportswear industry 6,8% CAGR from 2015 to 2018, outpaced the growth in the other segments respectively 3,9% and 5% as shown in figure 15.
Therefore, it is important to focus the analysis in the industry where Nike is integrated, the athletic apparel and footwear industry, also known as sportswear industry. According to Euromonitor International, the Sportswear industry is expected to generate USD 321 billion in 2018 and by 2022 it is expected to generate an additional USD 100 billion, implying a CAGR of 6,9%. (see figure 16)
The sustainable growth makes it an attractive industry, that it is characterized for being extremely fragmented and competitive, composed by numerous players, from small national players with simpler brands to big global players with high-end brands, which majority has less than 3% of the global market share. The absence of the switching cost between brands contributed significantly to the current composition of the industry, hence it is very important to differentiate from other competitors in order to gain market share.
The rising demand for athletics products across the globe, can be explained by changes in behavior which are leading to new lifestyles and increasing health consciousness among the population. Consumers are shifting their preferences and demand for athleisure clothing have been growing, in other words this style refers to causal athletic sportswear that can be used in various social contexts other than the practice of sports.
Also, the crossover between fashion and sports have been rising and collaborations between fashion designers and sports brands are becoming common. The aforementioned trends not only have contributed to the growth of the industry but also aroused the interest of high-end brands into the market and propelled the demand for sports apparel among women.
Another change in consumer behavior that is influencing the clothing and footwear industry is the e-commerce. The contribution of sales through the online channel,
NIKE INC. COMPANY REPORT
PAGE 10/39 vary a lot across the industry, from 21,8% (Lululemon) to 8% (Nike) of total sales, however we note that consumers are buying more products through online and mobile platforms, and is becoming an important channel for clothing and footwear sales.
Most recent trends in the industry include, the growing demand for personalization and the sale of premium/limited edition sneakers. Consumers want to own a special clothing and footwear pieces that have been specially designed to their own silhouettes and preferences.
Moreover, on the cost side of the equation we identify the marketing expenditure as one of the drivers of demand in the industry, as companies tend to spend heavily in advertising campaigns and sports sponsorships in order to promote the products of the brand.
Finally, it is important to note that companies have been focusing on international expansion, since it has been the second most disruptive trend in the industry with companies reporting high double-digit growth every in countries like China.
Competitors
As previously stated, sportswear is a highly segmented industry, composed by numerous players with different sizes. Among the existent companies in the industry, there are some competitors in the market that need to be paid attention, such as Adidas, Under Armour, Puma, Sketchers and VF Corp, main competitor in the North America and Europe, whereas Li Ning operates mainly in Asia
To analyze company’s position in the sportswear industry, it is essential to be able to identify the right comparable companies, peer of the Nike. For that purpose, only three of the existent companies were selected, Adidas, Under Armor and Puma, taken into account their size and operating geography. While the rest of the players were eliminated from the list due to following reasons, product category focus (Asics in footwear), geographic focus (Li Ning in Asia) and size, which eliminated the majority of the smaller player. (see figure 17)
Adidas AG
German multinational that manufactures active apparel, footwear and accessories. Founded in 1949, after the disagreement between two brothers, Adolf created Adidas and Rudolf created Puma, eternal rival since the beginning of the business. Although Adidas has maintained double-digit growth rate over the last three years, reaching total revenue of USD 23 969 millions in 2017, it has shown some slowdown in term of the year over year growth rate, which decreased from 16,4% in 2015 to 10% in 2017. In terms of the gross margin, it has improved along the years, from 48,3% in 2015 to 50,4% in 2017, resulted from the increasing sale through the direct channel, mainly e-commerce which has higher margin compared to the wholesaler.
Under Armour Inc
American multinational that manufactures casual apparel, footwear and sports. Currently, it has USD 4 977 millions in 2017, which represents a slowdown compared with past sales growth, 3% YoY in 2017 which is well below 22%/23% Fig.17
NIKE INC. COMPANY REPORT
PAGE 11/39 YoY in 2016/2015. Besides that, it observable some gross margin deterioration, decreased from 48% in 2015 to 45% in 2017. Its recent poor performance reflects company inability to capture the new trend, and most of the consumers do not see Under Armour as a lifestyle brand, which means that many of the lifestyle initiative that company purses fall on stony ground.
Puma
German multinational that manufactures active apparel, footwear and accessories. As explained before, it resulted from a family conflict, founded in 1949. Nowadays,
Puma had total revenue of USD 4 672 millions, with CAGR of 11,6% from 2014 to 2017. In terms of the gross margin, it possible to verify that Puma had increasing GP since 2015 from 45,5% to 47,3% in 2017, a substantial improvement in such short period of time.
In terms of the financial performance, the figure below shows the unquestionable leading position of Nike within the group. It has higher revenue than all other three competitors together, USD 34 350 millions compared to the USD 33 618 million, sum of the revenue of Adidas, Puma and Under Armour revenue in 2017.
Besides that, Nike has higher operating margin (14%) and net income margin (12%) than its peers. While Puma has the worst margins, both in operating margin (1%) and NI margin (-1%). (see figure 18)
Key drivers
It is very important to be able to identify and monitor the key drivers of the company, since it allows us to better understand the sources of the revenue growth and being able to make more reliable forecast. You can find below, some of the main drivers that could affect the company future performance.
Athleisure
Introduced in the market by Adidas and Lululemon back in 1998, athleisure changed the way people dress and nowadays we find athletic inspired clothes everywhere and they have changed the way how people dress to the gym, in the street and even to work.
NIKE INC. COMPANY REPORT
PAGE 12/39 As explained in the industry overview chapter according to Euromonitor International, sports-inspired apparel sales have outpaced traditional apparel sales growth. Despite limitations on data, as sports-inspired apparel aggregates more data than just athleisure specific sales, it represented 70,4 billion dollars in sales in 2017 and if we add the sports-inspired footwear (48,4 billion USD), we arrive to a 118,8 billion industry or 39% of the sportswear sales.
Its high growth and profitability contributed for an increasing number of apparel and footwear companies, aiming to profit with the trend. The attractiveness of this industry is obvious, as consumers value design over fabric specifics, in other words, apparel and footwear companies seeking to profit do not need to develop high performance garments, like Nike or Adidas.
The crossover between fashion and sports, disrupted the sportswear market and attracted companies with no previous relation to sports, from traditional apparel brands to luxury brands such as Emporio Armani (EA7) or Gucci, to create its activewear lines. As a matter of fact, traditional apparel companies such as H&M collaboration with Alexander Wang and Gap Inc. (Athleta), were among the top 20 biggest sportswear companies by sales in 2017, which demonstrate the opportunities of athleisure.
Moreover, the sports-inspired apparel and footwear market is set to continue to grow by 28 billion over 2017 to 2022, forecasting a market value of 146,8 billion in 2022, driven by the continue casualization of dress codes and the growing consumer focus on health and wellness.
The workplace has suffered big changes over the years, inspired in the start-up culture, and millennials are the responsible for the change, where comfort is often more valued than formality. Furthermore, urbanization is also leading to changes as consumers face challenges while living and working in a city environment, people value functionality in apparel and footwear as people need appropriate clothing to diverse social settings as well as comfortable wearing for commuting.
Despite, the luxury and traditional brands efforts, the athleisure market is dominated by the two big sportswear powerhouses, Nike and Adidas, both companies have explored the opportunities in the market and took advantage of their brand reputation and technical knowledge into their athleisure lines. For instance, Nike’s casual wearing segment, Sportswear, was the biggest category for the company in 2018, accounting for 33% of Nike’s brand sales or 10 billion dollars. Moreover, it was the segment driving the biggest growth last year (11%) and the second overall from 2015 to 2018 (7,7%) which signal that the trend is not dead as many analysts reported. (see figure 19)
Adidas focused in celebrity partnerships with Yeezy, adidas Originals and NEO, and blended with techwear, emphasizing premium material and innovative engineering for high performance durable products that would increase its attractiveness and retention rate of new customers.
While Nike to insure its product line always appeal to the likes of the probable customer, company has teamed up with cult brands such as Supreme and Off-white and put an extra effort in the product innovations in order to attract and retain customers. Which consists of innovative manufacturing techniques, using classic material like spandex and polyester to make athleisure outfits comfortable and practical at the same time.
Womenswear Fig.19
NIKE INC. COMPANY REPORT
PAGE 13/39 In the global apparel and footwear market, women’s products generally outsell men’s, as one can see in figure 22, we can observe that womenswear is the most representative category in the apparel and footwear industry. However, in the sportswear industry, until recently products were usually designed and targeted to men.
Once an ignored segment, in the recent years women sportswear became one of the biggest drivers in the industry. The increasing participation of female in sports and fitness programs, such as Yoga and Zumba, together with preference of wearing sports apparel in their daily wear, has led to a tremendous growth in the segment. For instance, women yoga pants import surpassed jeans denim imports for the first time in 2017, according to US census bureau,. (see figure 20)
In the women’s segment, one of the biggest companies is Lululemon Athletica, where its women sales represent 78% compared to only 22% of men’s category, exploring the women niche market since its beginning (first mover) created a special bond with the customers. However, for Nike capturing female consumers have been challenging, representing only 23% of the sales in 2018, it has been one of the highest growing segments of the brand, growing at a higher pace (6,5%) than men and children sportswear categories, 5,2% and 4,5% respectively, from 2015 to 2018. (see figure 21)
Nike’s current plan defines the women segment as one of the core markets where the company sees tremendous potential to grow, planning to double sales from 5,7 billion in 2015 to 11 billion USD in 2020. In order to achieve the sales target, the company allocating more retail space for Women’s products in its stores, announcing the creation of Nike Pants studio on its stores and digital platforms, offering more style choices and options for every type of woman workout.
Moreover, the company opened Nike women exclusive stores in London, Shanghai and Los Angeles and is following Lululemon’s strategy in launching women’s exclusive events, such as Yoga sessions on its stores. The company has also teamed up with women designers, to deliver fashionable cloth design, since women tend to give more importance to the actual quality and design of the product. Women are not only interested in apparel but also in the footwear, and companies in the industry have been focusing their strategies in the segment. For instance, Nike launched Jordan’s and Air Max women lines, where women’s Jordan sneakers sales have nearly tripled and the launch Nike Sneakers Boutique grew 30% to 50%, identifying the opportunities in the segment and recognizing that women tend to spend more than men on average.
Adidas, has been also focusing on the women segment with its partnerships with Stella McCartney, working together to develop active apparel and footwear for women, specialized for different rage of disciplines, for example yoga, running, swim and tennis.
Fig.21 Fig.20
NIKE INC. COMPANY REPORT
PAGE 14/39
Digital and Direct to Consumer
In the 2017 Investor Day, the company announced a re-organization and a new strategy for the following years, called Consumer Direct Offense. It is driven by its Triple Double strategy, where the company plans to double its innovation and differentiation, double its speed to market and double its direct connections with customers.
In Nike’s case, sales in its direct to consumer channel have been one of the most important drivers of the company’s growth. DTC sales grew at compounded annual rate of 15,3%, from 2015 to 2018, largely outpacing the sales growth in the wholesale channel, with only 3%. However, sales to wholesale costumers represented the main source of revenue of the company, representing 70% of company sales in 2018 but down from 77% in 2015, on the other hand the company has been shifting its sales to the DTC channel, where it represents 30% in 2018, up from 23% in 2015.
Following the weak growth in its overly big wholesale channel, the company announced that the new strategy of the company will be driven mainly through sales in its DTC channel while it plans to reorganize its wholesale channel from 30 000 retailers to only 40 key partners. Moreover, the company wants to capture the e-commerce trend and grow 400% the number of digital costumers and triple the number of members in its Nike+ app by 2023, from the 100 million current users. In order to further develop its DTC channel, Nike is focused in creating an omnichannel environment, where the Nike+ app is key and closely linked with its stores, allowing the costumer to reserve in store, recognition upon entering the store and ease to communicate with staff.
In its own retail stores, where sales grew 11% CAGR from 2015 to 2018, the company is focusing in 12 key cities worldwide with two new store formats: Nike Live first store opened its first store in Los Angeles in July 2018 and House of Innovation in Shanghai in October 2018. The stores collections will be influenced by customer buying patterns as well as app engagement. Another feature is the ability to book appointments with Nike Experts for personalized advice as well as to check in store product availability, self-check out and pick up through the Nike app. Nike recognized the opportunities in the e-commerce and despite it only represents 8% of the company sales, it has driven DTC sales growth at 33% CAGR from 2015 to 2018. Therefore, the company redesigned its online platforms and plans to offer 1/3 of its products exclusive to Nike app members, meaning that costumers need to register and login to its Nike app accounts similar to social media platform, Nike then collects consumer data, that would be used for product design, inventory management and personalized shopping.
Moreover, the company is testing sales using the newest technology, such as artificial intelligence, augmented reality (AR) and image recognition. For instance, in May 2017 the company tested the sale of its shoes in Facebook Messenger app, where costumers saw an AR version of the shoes through their cameras.
Furthermore, Nike has also made changes to its supply chain, where it plans to increase its efficiency levels, with for instance Express Lane, the company aims to quickly create and fulfil consumer demand, cutting time to market of its products to the final consumer in half, from months to only weeks. Also, Nike has identified seven key distribution centers globally, with focus on putting products into market efficiently, for instance a new Rebound facility deals with returned items and puts
NIKE INC. COMPANY REPORT
PAGE 15/39 back in the market as fast as possible so Nike can still sell in-season prices, in other words maximizing the full-price of its products.
Marketing
As mentioned in the company description, sports sponsorship has been the core activity for companies in the sportswear industry throughout their lifetime. Marketing play an essential role in promoting the company’s products and interest over the brand.
In Nike’s case, advertisements usually have a deeper role than merely promoting the company’s product, the company’s central objective is to create emotional attachment among the consumers, by creating inspirational and social awareness campaigns, that causes consumers to feel the need of having Nike’s products. The most recent example is the Colin Kaepernick campaign which generated an exponential number of searches on Google.
Marketing campaigns as well as sponsorship agreements with celebrity athletes and professional sports teams can boost the consumer’s engagement with the brand and increase the sales. For instance, “The Stephen Curry Effect” increased Under Armour footwear sales by 40% and contributed to USD 153 millions of sales, in the first quarter of 2016.
Nike invests heavily in marketing, and during the 2018 fiscal year, the company spent around 3 billion USD or 10% of its revenues in Demand Creation expenses. The company is famous for endorsing the hero type of athlete, such as Michael Jordan, Cristiano Ronaldo, Lebron James, Roger Federer and Tiger Woods or the Atlanta 96’ gold medalist Michael Johnson.
Investments tend to be higher in years of big sporting events such as FIFA World Cup and Olympic Games, as sportswear companies compete for the viewer’s attention. In the two most viewed competitions worldwide, it is a unique opportunity for companies to promote its hottest products to an audience of billions of people. While, in the FIFA World Cup, Adidas have been dominant player with the major sponsorship of the event since 1972, it has the exclusive rights in producing the official competition ball and referee’s equipment. Nike on the other hand has been the dominant brand in the Olympic Games, leading by far the number of gold medalist’s athletes sponsored during the Rio 2016, Olympic Games. (see figure 23) Moreover, Nike signed deals with two of the three biggest professional sports leagues worldwide generating revenues of USD 14 billions and USD 7,4 billions, respectively. In more detail, the NBA deal represents an 245% premium over the Adidas/NBA previous deal. The investment seems to have paid off, with NIKE’s Basketball sales segment recovering from two successive years of sales drop, to a 16% growth during the 2018 fiscal year. Moreover, the company maintains a unquestionable dominant position in the America basketball shoe market, controlling 95% of the market, despite of the numerous attempts by its main competitors, Under Armour and Adidas.
Adidas changed its strategy, aiming to increase the number of sponsored players within each league. Since it is believed that it will allow company to reach a greater range of consumers.
International segments analysis
Global industry is divided in different segments according to the regions where company operates. Nike Inc., being a global player, operates in a set of business units, each of them different from other due to its unique characteristics. Thus, in Fig.23
NIKE INC. COMPANY REPORT
PAGE 16/39 order to get a better understanding of the business, the analysis will be processed separately for each region: North America, Europe Middle East & Africa (EMEA), Greater China and Asia Pacific & Latin America (APLA).
The following segment analysis corresponds to the wholesale and retail of Nike, Jordan and Hurley brands, while the rest of revenue is presented separately.
North America
The North America region represents the largest market among the four regions, despite being constituted by only 2 countries, United States and Canada. It represents 38% of the industry in 2018, corresponding to USD 122 billion in 2018. From 2015 to 2018, the North American sportswear market grew at CAGR 5,9% and as the market matures, it is projected to slow down its growth to 4,9% between 2019 and 2022. By 2022, the market is expected to achieve USD 149,4 billion, and growth will be driven by sports footwear (5,3%) and sports apparel (4,7%), where two thirds of the sales (67%) will come from the apparel segment.
Nike Inc. has long established a dominant position in the market, with the largest market share, 13,4%, which corresponds to USD15 216 million of net sales in 2017, compared to the 4,2% of Adidas and 3,3% of Under Armour, the two main competitors.
Currently, company’s predominant position is being challenged, its market share has been decreasing since 2016 until now, from 13,6% to 12,2%. Additionally, net sales decreased -2,4% in the last year, negative growth for the first three quarters of the financial year 2018. It may be a sign of the loss of controlling power over this segment against its competitors, such as Adidas whose market share increased from 3% to 4,2%, for the periods of 2015-2017. And it can be explained by the following reasons: 1) consumer preference of Adidas’s new product over Nike’s. 2) Fashion trends moved in Adidas’s favor.
Despite the decline in the last year, it is believed that the Nike will outperform in the following years, taken into account several factors, such as, new innovative platforms, sportswear momentum, broad-based growth across apparel and the strategy shift from undifferentiated wholesale partners into a more digital-friendlier consumer experience. Besides that, Nike’s partnership with the NBA had a successful first year, which affected positively the Nike basketball segment sales growth, 16% year over year in 2018 compared with -1%/-6% year over year in 2016/2017. Furthermore, it is believed that Adidas’s momentum in North America is slowing, particularly within footwear industry, which can be explained by the fashion trend that is shifting back to performance and away from lifestyle, as result, Adidas’s growth rate decreased from 13,7% to 12,3%, from 2016 to 2017.
Greater China
China represents the fast-growing market among the four regions, which represents 12,2% of the industry, corresponding to USD 39 160 billion in 2018.
From 2015 to 2018, the Chinese sportswear market grew at CAGR 12%, well above the global average (6,9%), and it is projected to grow at CAGR of 10,2%, from 2019 to 2020. By 2020, the market is expected to achieve USD 58 331 billion, and growth will be driven by sport footwear (11%) and sport apparel (9,2%), according to the Euromonitor, which is aligned with expectation and potential of this market.
In this region, Nike has 12,1% of the market share, which corresponds to a net sale of USD 4 237 million in 2017, compared to the 12,2% of Adidas. Thus, it is possible
NIKE INC. COMPANY REPORT
PAGE 17/39 to affirm that there is no clear leader in this region, which coupled with high growth potentials, it is definitely a highly disputed segment.
Nike has adopted several strategies along the years, including the 10-year partnership with the China Super league which is one of the region's fastest growing football program, “Shoes Go” campaign which inspired 2 million participants and finally, being part of their education system by providing educational resources to schools, and school basketball leagues. In our perspective, all the initiatives aim to raise the brand's awareness, which has long terms effect and maintains company’s dominant position in this segment.
Although Greater China is not the most important geographic segment of the company taken into account the current levels of sales, it is the “Future Star”, it has potential to become “that one”, since it is facing fast booming in this sector and it can be explained by following factors:
1) Increasing health consciousness among the population affected its habits, it implied a higher participation in sport activities, and it has become as a way of socialization, as result, booming of health and fitness club.
2) Government intervention to increase the health awareness among the population, which involves the creation of more spare dedicated for the practice of sport. For that purpose, Chinese Government aims to rise the domestic sport industry, by increasing sport area per capital from 1,4 square meters to 1,8 square meters in 2020 and 2 square meters in 2025. Thus, thanks government support, it is possible to affirm it is no longer a fashion trend that may cease in the near future, it has become a sustainable trend that may last for a longer period of time.
3) High number of populations aligned with fast economic growth.
China has more than triple of the population when compared with North America, 1390,090 million people against 364,719 million.
Besides that, China is facing a transition period, experiencing exponential positive growth, which can be translated into increasing purchasing power of the population. Hence, Chinese people are more willing and capable to buy the products, which may be translated into higher potential of the sportswear industry.
EMEA
The EMEA region is the second largest market among the four regions, which represents 30% of the industry, corresponding to USD 96 billion in 2018. The market grew at CAGR 5,8%, from 2015 to 2018, driven by sport footwear sales (6,9%) and sport footwear (5,1%).
It is composed by Eastern Europe, Western Europe, Middle East and Africa. It represents 30% of the industry in 2018, corresponding to 96 billion in 2018. Western Europe accounts for 63% of total market size, which corresponds to USD 60 billion in 2018. Eastern Europe contributes for 15% of the revenue, and the Middle East & Africa with remaining 22%.
Western European market grew below the EMEA average at 4,4% CAGR, impacted by countries in economic difficulties and decreasing disposable incomes, such as Italy and Greece, and as the market matures, it is projected to slow down its growth to 4,3% CAGR, from 2019 to 2022. Meanwhile, Eastern European and Middle East & Africa regions grew at 7,9% and 8,7% CAGR, from 2015 to 2018, and it is expected to continue the region growth at 7,5% and 7,2% CAGR
NIKE INC. COMPANY REPORT
PAGE 18/39 respectively from 2019 to 2022, explained by the emerging economies in the region and increasing disposable of the population.
In this region, Nike has market share of 8,8%, corresponding to USD 7 970 millions of net sales in 2017, compared with 11,4% of Adidas and 1,9% of Puma, two main competitors.
Analyzing competitors in this region we can identify that several Nike’s competitors have shown softness in Europe. Adidas’s slowdown, particularly in Western Europe helped Nike to consolidate its position across apparel and footwear, which decreased from 16,2% yoy in 2016 to 13,5% yoy in 2017. Coupled brand momentum in London, Paris, Berlin, Barcelona and Milan, five of Nike’s twelve key cities and strong product innovation, which helps the company to differentiate from its competitors, leading to gain market share overs its competitors.
APLA
The APLA region is one of the most interesting regions, which represents 20% of the sportswear industry, corresponding to USD 64 billion in 2018. The region grew at CAGR of 7,9%, from 2015 to 2018, driven by sport footwear sales (9,8%), and sport apparel (6.3%).
The region can be split in two different regions Asia Pacific and Latin America. Asia Pacific accounts for 65% of the total market size, which corresponds to USD 42 billion in 2018. The market consistently grows due to strong macroeconomic and demographic indicators, such as higher birth rates and large younger population with millennials driving incremental growth in sportswear. Geographically the main driver in this market is the second most populous country in the world, India, where sportswear industry is expected to grow at a CAGR of 22,3% from 2019 to 2022, more than doubling its market size from USD 8,3 billion in 2018 to USD 18,4 billion in 2022.
Latin America sportswear market had faced some adversities, mainly due to the strong economic and political issues that have been affecting countries like Brazil, Argentina and Venezuela. Despite, the problems mentioned the region grew at 7,5% between 2015 to 2018 and is set to grow 9,6%, 2019 to 2022.
On average, the APLA region is forecasted to grow at CAGR of 10,1%, from 2019 to 2022, being the second fastest growing segment in the world behind Greater China. It is expected to benefit from the Summer (Tokyo 2020) and Winter Olympic Games (PyeongChang 2018 and Beijing 2022) and grow to a market size of USD 96 billion by 2022, contributing to 22% of the world sportswear market.
In this region, Nike has market share of 8,1%, corresponding to USD 5166 millions of net sales in 2017, compared with 5,7% of Adidas and 1,6% of Puma, two main competitors.
Analyzing competitors in this region, it can be seen an extra effort from others international brands such as Puma and Adidas, to increase their presence/brand awareness in key emerging markets by investing in multi-million-dollar marketing strategies aimed at building a special bond with local consumers. Nike being the leading global company, did not fall behind, it also invested heavily in marketing to increase the brand awareness, and it couple with DTC strategy in the 3 of the 12 key cities in this region, Tokyo, Mexico City and Seoul.
NIKE INC. COMPANY REPORT
PAGE 19/39 This methodology is used to determine the value of the company based on comparable peers. Adidas AG, PUMA and Under Armour, as presented previously, are companies present in the same industry (sports apparel & footwear) and markets as Nike Inc. Despite its obvious limits, this non-looking forward can give us an idea of Nike’s position taking into account its peers.
We used three equity-based market multiples, namely Price/Earnings, Price/Sales and Price/Book Value. Lying on these, we obtained a valuation of USD 67,30, lower than DCF valuation, in which we trust more. Comparable method, indeed, may not give us a reliable value (“fundamental price” or “fair value”) but just “how much the market may value the firm object of valuation”, due to some limits implicit in the model:
● Based on simplistic hypotheses, not fundamental analyses; ● Based on short-term accounting performance;
No guarantee that firms are correctly priced: multiples are influenced by “market sentiment”, so they may overvalue firms in “bull market” periods and undervalue in “bear market” periods.
Along with the differences between DCF value and Multiples Value, we choose the first, whose assumptions are more reliable and based on future firm’s perspectives. (see figure 24)
Valuation
Discounted Cash Flow Model
The methodology used to determine the value of the company was the Discounted Cash Flow model (DCF), we believe this model will accurately capture all the main growth drivers of the company.
NIKE INC. COMPANY REPORT
PAGE 20/39 The model was built with the objective of forecasting the operating cash flows of the company for the period 2019-2022. In the next sections we will explain the assumptions and inputs used to build and estimate the value of the company.
Forecasting
Revenues
One of the crucial parts of the DCF model is the forecast of the revenue, which is the first step of the forecast process. Taken into account the nature of the business, fashion industry, it depends on different factors, such as, new fashion trends which may affect the consumer preferences and cause changes in demand side.
Thus, it is hard to make forecast and prediction of future sales, since it suffers intense fluctuations across years and during each year. Besides that, the revenue is usually higher in the first and third quarters, which coincides to the launch of new collections, spring/summer and fall/winter respectively. Thus, the following estimates may suffer changes along the years with possible changes in the industry. All the key drivers were considered for the forecast of the revenue, namely the digital friendly consumer experience instead of undifferentiated wholesaler partners, which is considered to be main driver of revenue in the short run and also a strong contributor for the long-term growth, which can be proven with abnormal growth rate of the direct channel in last years as explained before.
Moreover, caption of the women’s preference is also a strong driver in some regions where Nike operates, mainly emerging markets where the female rise is more evident when compared with developed regions.
In this sense, revenues were forecasted for Sports Apparel, Footwear and Equipment divisions and for each geographic segment where the company operates, based on the following formula market share x market size, reflecting company sales of Nike, Jordan and Hurley brands. Converse is considered a footwear brand and sales were predicted using the same formula at a global level. For Corporate and Global Brand Divisions, we assumed that revenues will remain the same, as the last reported fiscal year, as both represent less than 0,5% of the company’s annual revenues and its nature, make it hard to forecast.
North America
It is the company´s main segment, representing 41% of the total revenue in 2018. In the last year, Nike lost 1,2% of the market share, mainly due to disappointing sales and increasing competition in the market, which Adidas expansion in this region is the key factor for the loss of market share.
Nevertheless, Nike is expected to be able to turn it around and consolidate its market share over the next four years, by increasing up to 12,7% in 2022, at CAGR of 5,9%, mainly due to following reasons: Adidas’s decelerating momentum, Nike’s increased innovation pipeline and DTC focus will help the company to deliver sustained growth rate over the short to long term.
NIKE INC. COMPANY REPORT
PAGE 21/39
China
Although China only represents 14,1% of the total revenue in 2018, being the smallest segment of the company. It is definitely the most attractive one, which is expected to have an outstanding performance, maintaining double digit growth for the following four years and after that will eventually converge to the country GDP/industry growth rate. Thus, considering the increasing sport adoption, lower tier-city consumption growth (emerging middle class), associated fashion shift towards athleisure and Nike´s Shanghai and Beijing DTC efforts, it will grow at CAGR of 16,7% from 2019 to 2022, by reaching 16,7% of the market share.
Europe, Middle East & Africa (EMEA)
In the EMEA region, the company have been growing and still has a smaller market share compared to its peer Adidas. Nike is expected to gain some market share as it partners with ecommerce giants such as Zalando, an online marketplace that offers Europe’s largest selection of footwear and apparel. Growth will be fueled by digital sales and investment in NIKE flagship stores in five key cities identified by the company. Hence, it is expected to grow at CAGR of 8,2%, from 219 to 2022, by reaching a market size of 10,7%.
Asia Pacific and Latin America (APLA)
In the APLA region, Nike is expected to benefit from the emerging middle class as well as the cultural passion for sports, namely the passion for football/soccer in this region is one of the strongest worldwide and continues to grow in Asian countries. Moreover, 3 of the 12 key cities are identified in this region: Tokyo, Mexico City and Seoul, and Nike is considered the number one favorite brand in the region key cities, outlining growth opportunities. Taken all these factors into account it is expected to grow at CAGR of 14,8%, from 2019 to 2022, by reaching a market share of 9,6% in 2022.
Gross margin
Nike has a gross margin of 43,8% in 2018, which is expected to improve up to 46% in 2022, with 53 basis points annual increase on average, which is close to the guidance released by the company, 50 basis point annual increase on average. The company’s margin improvement will be mainly driven by the DTC strategy, reflecting the higher margin of the DTC channel compared with wholesale channel. Moreover, the company is making investments in high tech, that will leverage the company to better forecast demand and control the supply, so it can enjoy from full-price sales and maximize its margin. Also, the company announced changes in its supply chain that will enable the company to deliver faster, translating into efficiency improvements.
Finally, we also see recent innovations as drivers of margin improvement, for instance in manufacturing Nike announced its 3-D printing shoes, where in the future it will mean that the company will literally be able to produce its shoes anywhere at lower production cost.
NIKE INC. COMPANY REPORT
PAGE 22/39 Capital expenditures represent investments that the company plans undertake either to build or maintain its fixed assets.
Comparing Nike against its main competitor Adidas, Nike stands out with a higher Capex value, more than double of the value presented by Adidas. Nevertheless, it is possible to verify the same tendency in both company, capex gradually falls throughout the years in terms of Capex per sale, Nike falls from 3,6% in 2016 to 3,3% in 2018.
It can be explained by the focus on digital direct strategy, which has negative implication in number of physical shops, since a higher percent of sale has been transferred from physical stores to e-commerce. The new stores opened in the recent years have revolutionary characteristics, which differs from the old ones. It is a mix of physical and digital, improving both of the experience at same time. Thus, it is no longer quantity of new stores that matter, but the quality is key factor to success, since the customers cares more and more about the quality of the service than ever.
In figure xx, we can see that the number of new store openings started to decrease after 2016, a year with 114 new store openings, in the following years 2017 and 2018, the company further deaccelerates the investment in new stores with only 97 and 40 new store openings. In this sense, we forecast that the declining tendency will continue until 2023, with new store openings forecasted between 2% and 3%, driven by 1% growth in the stable North American market and 4% to 3% growth in the international markets. As we believe, the brand will continue to make investments in order to improve its positioning emerging markets, such as China and Latin America.
To sum up, capital expenditures are forecasted to maintain stable during the next four years, reflecting the company’s new strategy focused in improvements and remodeling of own and franchise stores and deacceleration of investment in new store openings.
Net Working capital
Net Working Capital is a measure of the company’s liquidity, in other words, it reflects a company’s ability to pay its short-term obligations.
Days receivable reflects company’s ability to claim for payments, we used Nike’s
historical average #days to estimate accounts receivable, expecting to reach 38 days in 2022. In terms of the Inventory turnover days, we reflected Nike’s innovations and changes in their supply chain, therefore we assumed a 2% efficiency gain per year, as the company Triple Double strategy focus in speed in delivering and reducing the inventory holding period, thus it is expected to reach 87 days in 2022. Days payable was estimated using the company’s historical average therefore it is expected to be 43 days in 2022.
To sum up, the company’s new strategy will have some impact in the company’s
cash conversion cycle from 88 days in 2018, some improvement is expected over
the next four years, reaching 81 days in 2022.
WACC
For the valuation purpose, the WACC was estimated based on the following inputs, cost of debt, cost of equity and tax rate.
NIKE INC. COMPANY REPORT
PAGE 23/39 It was estimated by using the average yields of the company’s corporate bonds. As Nike had bonds maturing in different periods, we selected bonds maturing in 2026 and bonds maturing in 2046.
Corresponding yields were retrieved from Bloomberg and the average yield/cost of debt is 3,83%, which is assumed to be our cost of debt, based on the belief of same rating along the years.
Cost of equity
The cost of equity was estimated using the Capital Asset Pricing Model, with the following formula: cost of equity= risk free rate + company’s beta * market risk premium.
The assumption used to determine the risk-free rate, was a ten-year US treasury Bond with a yield of (2,95%), which is considered to be a very close proxy to the Rf. Moreover, to determine Nike’s beta, we used Bloomberg’s adjusted beta method, which is derived from the following formula: Nike’s adjusted beta (0,9) = 0,67 x Raw Beta + (0,33) x 1.0, the assumption is that a security’s true Beta tend to move towards the market average of 1, over time.
According to Duff & Phelps’s US Equity Risk Premium guidance, the recommended risk premium is 5%, which is a general accepted rate that falls within the accepted range.
Taking into account the aforementioned inputs we arrive to a cost of equity of 7,47%. Finally, WACC was estimated at 7,30%, the discount applied to the company’s free cash flows.
Tax
Regarding to the corporate tax rate, US suffered the biggest statutory tax cut in the history, from 35 per cent to 21 per cent in 2018. But, during the last fiscal year the company paid an abnormal amount of taxes, due to a one-time expatriation of company funds held overseas.
Therefore, we do not expect that Nike will engage in similar events in a near future, and we estimate that the company’s effective tax rate to be around 15%, in range of the two previous years, 2016 and 2017, where the company paid 18% and 13% in taxes respectively.
Perpetual growth rate
The perpetual growth rate is the rate that the company is expected to grow from the last forecasted year to perpetuity, which shows how Nike will evolve after stabilized in terms of financials.
Taken into account its characteristics, it is projected to grow in line with GDP. Since it is not reasonable to expect that the company will keep growing at higher/lower rate than the forecasted GDP growth rate in the future, because it would mean that the company will overtake the entire industry or disappear in some point of time in the future, which is impossible to happen or less probable.
The forecasted GDP growth rate for the future is around 2,44%. Thus, the company is expected to growth within the same rate.
NIKE INC. COMPANY REPORT
PAGE 24/39
Sensitive analysis
In order to perform the sensitive analysis, we selected two inputs that in our point of view could have the biggest impact in the valuation model. The inputs selected were WACC and the perpetual growth rate, both play a vital role in the valuation model. The perpetual growth rate is the input that impacts the most the terminal value, and WACC is the discount rate that will be applied to all cash flows, forecasted period and the terminal value.
By observing the figure 25, it can be seen that the share price ranges between 90 to 122, meaning that even in the worst case, higher WACC and lower perpetual growth rate, it is still significantly higher than the current trading value. Thus, it reinforces our buy recommendation, since the company is being undervalued by the overall market.
Appendix
Financial Statements
NIKE INC. COMPANY REPORT
NIKE INC. COMPANY REPORT
NIKE INC. COMPANY REPORT