Professional Training in Organic Food Production: A Cross Country
Experience
Raquel P. F. Guinéa*, Daniela V. T. A. Costab, Paula M. R. Correiaa, Cristina A. Costa1, Helena E. Correiab, Moisés Castroc, Luis T. Guerrac, Catherine Seedsd, Collette Colld, Lászlo Radicse, Mehmet Arslanf, Soner Soyluf, Monika Tóthóvag, Peter Tothg, Salvatore
Basileh a
CI&DETS/ESAV, Instituto Politécnico de Viseu, Portugal b
DEAS/ESAV, Instituto Politécnico de Viseu, Portugal c
EOSA - Estrategia y Organización S. A., Vigo, Pontevedra, Spain d
SRUC - Scotland’s Rural College, Aberdeen, Scotland e
Association for Hungarian Organic Farming, Budapest, Hungary f
Mustafa Kemal University, Hatay, Turkey g
Slovak University of Agriculture in Nitra, Slovakia h
Biocert Association, Naples, Italy
*
Corresponding author: Professor Raquel P. F. Guiné, Quinta da Alagoa. Estrada de Nelas.
Ranhados. 3500-606 Viseu. Portugal. Tel: +351-232-446641, Fax: +351-232-426536, E-mail: [email protected]
ACKNOWLEDGMENT
Thanks to Project Leonardo da Vinci – Transfer of Innovation ECONewFARMERs: Building a future for new farmers in ecological farming through vocational training (2013-1-PT1-LEO05-15535).
Published article. Citation:
Guiné RPF, Costa DVTA, Correia PMR, Costa CA, Correia HE, Castro M, Guerra LT, Seeds C, Coll C, Radics L, Arslan M, Soylu S, Tothova M, Toth P, Basile S. (2017) Professional training in organic food production: a cross-country experience. The International Journal of Information and Learning Technology, 34(3), 242-258.
Professional training in organic food production: a cross country
experience
Abstract
Purpose: The aim of this work was to characterize the agricultural
activities and past experience in professional training in the context of mobile learning in different countries (Portugal, Spain, Slovakia, Hungary, United Kingdom, Italy and Turkey).
Design: For the survey, a questionnaire was prepared in English and
Portuguese and then translated into the languages of the participating countries. It was delivered electronically for answering on-line by adults only. The participation was voluntary and in the end 133 consented valid questionnaires were obtained.For the treatment of the data was used SPSS and basic descriptive statistics tools were applied, together with tests, namely crosstabs and chi square tests, considering a level of significance of 5%.
Findings: The results showed that the majority of the participants
presently have some agricultural activity and one third is thinking about starting one the future. Most of the participants want to produce food in organic mode, with significant differences among the countries at study.
Most of the participants were enrolled in training activities in
agriculture, especially those with higher education. This participation showed significant differences between countries and also according to the dimension of the farms owned by the participants. A significant association was found between being a teacher in forming activities related to agriculture and being a farmer. When compared to distance learning, the training activities in classroom were the most frequented, with significant differences among the countries.
Practical implications: This study allowed characterizing the learning
activities in the field of organic agriculture and establish direction lines for planning of future training programs, in different countries, with maybe different social, educational and cultural realities
Originality/value: Because the study included the participation of
people from several countries all around Europe, the results obtained enrich the scientific area of training in Organic Farming, in view of distance learning versus classroom learning on a more global basis.
Introduction
Andragogy, or adult education, is much more than just a theory of adult learning, being an educational ideology that is established on paradigms of learning and teaching (Slavkovic and Savic, 2015). Malcolm Knowles, one of the most famous pioneers of adult learning or long-life learning, proposed the six principles of adult learning (Knowles, 1984): 1) Adults are internally motivated and self-directed; 2) Adults bring life experiences and knowledge to learning experiences; 3) Adults are goal oriented; 4) Adults are relevancy oriented; 5) Adults are practical; 6) Adult learners like to be respected.
Adults want pleasurable learning experiences, participating creatively in in the process of constructing their own knowledge. Hence, it is important to generate opportunities to involve them in stimulating learning in a creative and interactive way (Oprea, 2014).
The m-learning system has much potential, and one of the most gratifying characteristics of these solutions is that students of any age or background can seek for knowledge that is important and satisfying to their lives, either at the personal level and/or professional aspirations (Slavkovic and Savic, 2015).
The Copenhagen Declaration of 29-30 November 2002 set the basics of strategic cooperation in Vocational Education and Training (VET) at the European level. Since then, many countries have implemented initiatives which support and improve the quality of the vocational education, among which: European Qualifications Framework (EQF); European Credit system for Vocational Education and Training (ECVET); European Qualifications Framework (EQF); Europass framework (Bostan et al., 2015).
people with low qualifications or no qualifications at all; 2) technological change will increase the demand for people with medium or high qualifications; 3) the mobility of learners in VET remains low; 4) curriculum does not keep pace with rapid technological change; 5) reduced investment in VET due to economic crisis (Bostan et al., 2015).
Lifelong Learning Program is a European Union program for cooperation in education and training, which targets to increase exchanges, cooperation and mobility between education and training in the European Union (Nicolau, 2010). The program Leonardo Da Vinci aims to develop techniques for teaching/learning for all those involved in education and training (except at tertiary level), development institutions, organizations that provide/facilitate access to education and training. Hence this encourages European cooperation in education and training, as well as the implementation of the Copenhagen Declaration concepts through innovation, testing and experimentation (Nicolau, 2010).
Presently, organic farming is promptly gaining importance, due to the many problems that conventional farming brings both to human health and the environment (Aguado-Giménez et al., 2015; Andersen et al., 2015). Thus, organic agriculture has been identified as a developmental opportunity. Agriculture, beyond its primary function of producing goods for human consumption, can also shape the landscape, provide environmental benefits, such as land conservation, sustainable management of renewable natural resources, preservation of biodiversity, and also contribute to the socioeconomic viability of many rural areas (Groot et al., 2009; López and Requena, 2005; Parra-López et al., 2008, p.; Rozman et al., 2013).
Training is an effective way to enhance practicing and mastering organic farming in accordance with the Organic Farming Regulation and Rules. Naturally, organic farming
2015).
The project “ECONewFARMERS - Building the future with new farmers in organic production through vocational training”, approved by Program Leonardo da Vinci – Transfer of Innovation (ref 2013-1-PT1-LEO05-15535), aims to contribute for the technical training and provide tools in contexts of mobile-learning (m-learning), to improve the capacity of intervention and innovation of farmers wishing to convert or start a farm in organic farming, and who already have at least secondary education but no formal knowledge in agriculture in general or organic farming in particular. This project includes partners from different European Countries, namely: Portugal, Spain, Slovakia, Hungary, United Kingdom, Italy and Turkey.
The aim of this work was to make a survey by means of a questionnaire to obtain information about the agricultural activity and past experience in professional training in the context of mobile learning in different countries.
Materials and Methods Instrument for Data Collection
For this survey a questionnaire was used, which is one of the privileged ways of collecting data refereeing to social behaviours. The questionnaire was firstly prepared in English and Portuguese and then it was translated into the languages of the participating countries and applied to people in each of the countries of the ECONewFARMERS partners (Portugal, Spain, Slovakia, Hungary, United Kingdom, Italy and Turkey).
Sampling Procedure
countries included in the study. The target group was composed of people with instruction, preferably, who at some point of their lives decided to start some agricultural activity, owing to several reasons (including personal and/or economic motivations).
The questionnaires were delivered electronically for answering on-line by adults only. The participation of the respondents was voluntary and in the end 133 consented valid questionnaires were obtained.
Data Analysis
In the data analysis basic descriptive statistics was used, for an exploratory evaluation of the data. Also the crosstabs and the chi square test were used to assess the relations between some of the variables under study. For all data analysis the software SPSS, from IBM Inc. (version 22) was used. The level of significance considered was 5%.
Results and Discussion Sample Characterization
Figure 1 shows how the enquired were distributed among the countries included in this preliminary study. The percentages varied from 8% for participants from Italy to 19% for participants from Hungary.
The sample consisted of people aged between 18 and 70 years old, being on average 35±11 years (Table 1). The mean age was higher in Turkey (42±14 years) and lower in the United Kingdom (32±13 years).
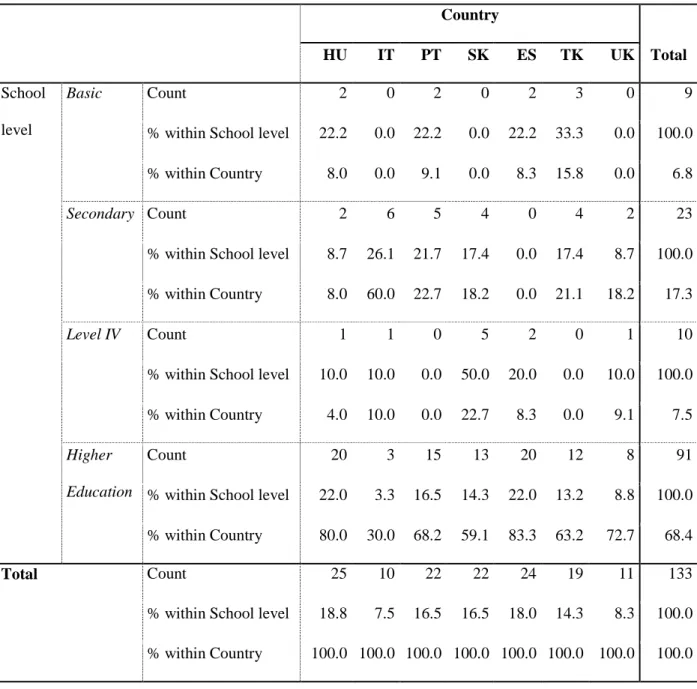
Table 2 shows that most of the participants in the survey have a university degree, 68%, and only 7% had a very low level of education (basic education). This information indicates that the potential interested in training in organic food production already had
some education, although in many cases it was in an area quite different from agriculture (73%). While in Spain was registered the highest percentage of participants with higher education (83%) in Italy only 30% had a degree.
Past Experience in Agricultural Practices
More than half (56%) of the participants presently have some agricultural activity, while 30% are thinking about starting one the future. Regarding the number of years of past experience in agriculture, 50% had less than 10 years, 28% between 10 and 20 years, and a very small percentage had more than 30 years of experience (4%) (Results not in Table format).
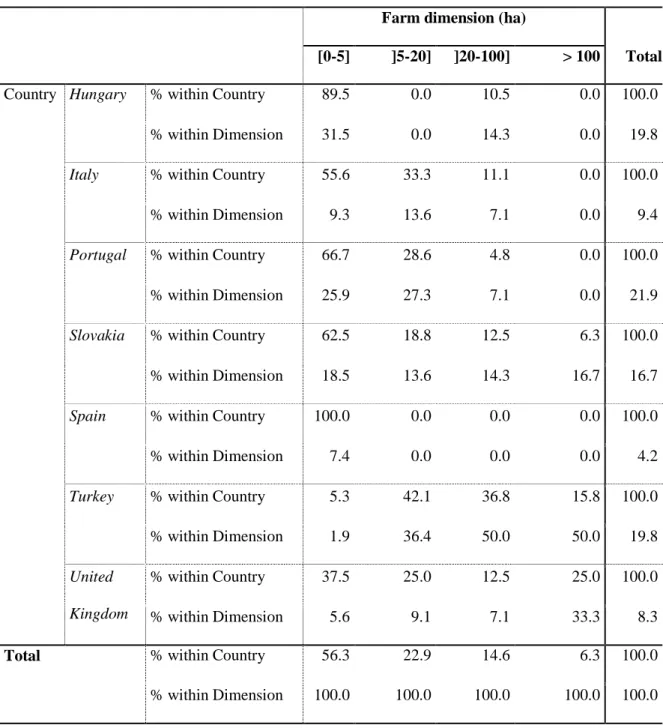
Table 3 presents the dimension of the farms across countries. For those who already had a farm, in 56% of the cases these were very small farms, with less than 5 ha, and only 6% had farms bigger than 100 ha. The largest farms were situated in United Kingdom and Turkey (70 and 64 ha on average, respectively), followed by Slovakia (average 27 ha), while the smallest (lower than 10 ha on average) were in Portugal, Italy, Hungary and Spain (9, 7, 6 and 1 ha on average, respectively). The low average area found for Spanish farms may be related to the fact that the target group was situated in the North, in the province of Galicia, with a reality different from the south of Spain, where farms are typically bigger.
Regarding the production system adopted, 72% wanted to produce foods in organic mode, 18% intended to adopt integrated pest management and a minority still preferred conventional farming (11%) (Results not in Table format).
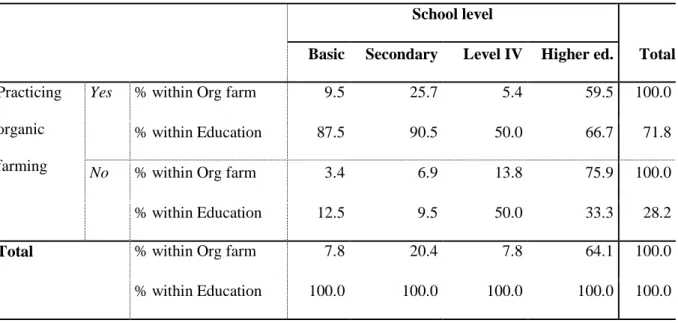
education. The percentage of participants who practiced organic farming was higher than those who did not for all levels of education, except for level IV, in which case was equal. However, the Chi square test did not confirm the relation between school level and organic farming as being statistically significant at the level of 5% (χ2 = 7.335, p = 0.062). The Cramer’s V was 0.267, also indicating that the relation between these variables is very weak, since the coefficient is closer to the value 0 than to the value 1.
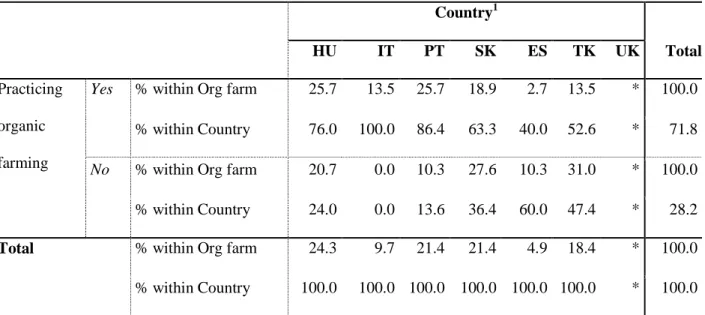
Table 5 presents the relation between organic farming and country, indicating that in all countries, except Spain, the majority of the participants practiced organic farming. Hence, there was an association between practicing organic farming and country, as confirmed by the Chi square test (χ2 = 13.132, p = 0.022). However, the Cramer’s V was 0.357, indicating that the relation between these variables is weak.
Similar tests were made to the relations between integrated pest management or conventional farming and the variables school level and country (Tables not presented). The results obtained by the Chi square test indicate that for integrated pest management no significant differences were found according to the different levels of education (χ2 = 3.568, p = 0.312, Cramer’s V = 0.186). With regard to the country, it was found that there were significant differences among countries as to the use of integrated pest management, although the association between these variables was weak (χ2 = 14.628, p = 0.012, Cramer’s V = 0.377). Turkey showed the highest percentage of participants using integrated pest management (36.8%), followed by Slovakia (31.8%), then Portugal (13.6%), Hungary (4.0%) and in Italy and Spain none of the participants adopted this technology.
conventional agriculture (χ2 = 4.542, p = 0.210, Cramer’s V = 0.210). However, it was found an association between country and the practice of conventional agriculture, as indicated by the results of the Chi square test (χ2 = 21.985, p = 0.001, Cramer’s V = 0.462). Spain showed the highest percentage of participants practicing conventional agriculture (60.0%) followed by Hungary (20.0%), Turkey (85.3%) and Slovakia (4.5%), and in Portugal and Italy none of the participants adopted conventional agriculture (Results not shown in Table format).
Experience in Agricultural Training
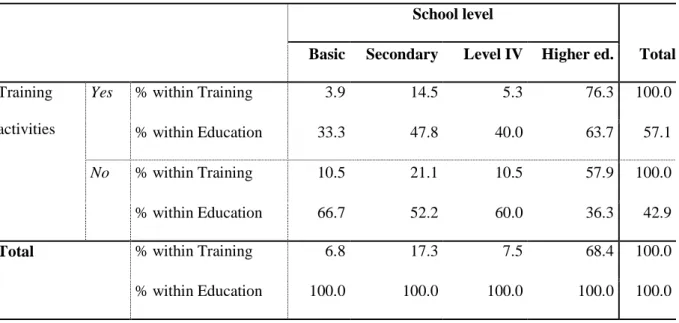
Regarding the participation in training activities in agriculture or other related areas, 57% said they participated in such actions while 43% did not (Table 6). The results in Table 6 also show that the participants with higher education seem to have participated more often in training activities when compared to the other levels of education. However, the results of the Chi square test did not confirm the association between these variables as being significant (χ2 = 5.714, p = 0.126, Cramer’s V = 0.207).
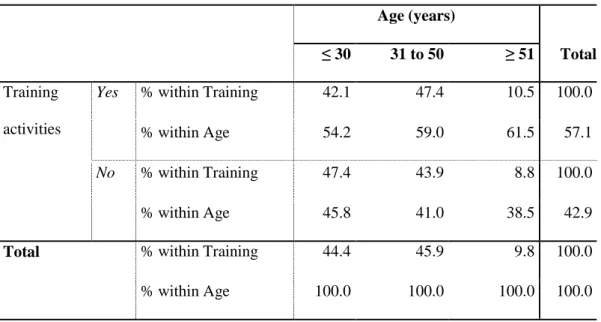
Table 7 shows the relation between the participation in training activities and the age group, and the results indicate that the percentage of participants who enrolled in training activities related to agriculture was relatively similar in all age groups, between 54.2% and 61.5%, with a very slight trend to increase with ageing. The Chi square test confirmed that the association of these variables was not statistically significant (χ2 = 0.393, p = 0.821, Cramer’s V = 0.054).
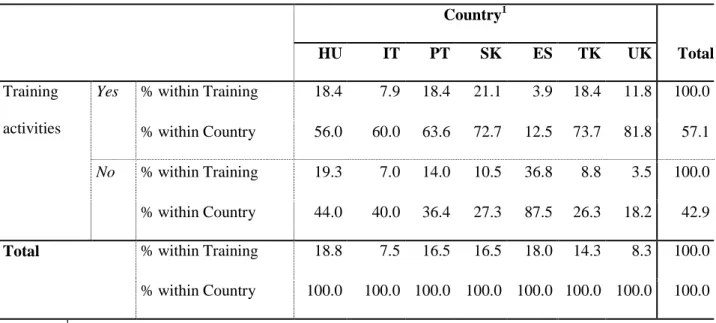
The participation in training activities showed highly significant differences between countries, as the result of the Chi square test demonstrate (χ2 = 26.996, p = 0.000, Cramer’s
V = 0.451). Table 8 reveals that among the participants from the United Kingdom a very high percentage were involved in training activities related to agriculture (81.8%) in contrast with the participants from Spain, from which only 12.5% did participate in such training.
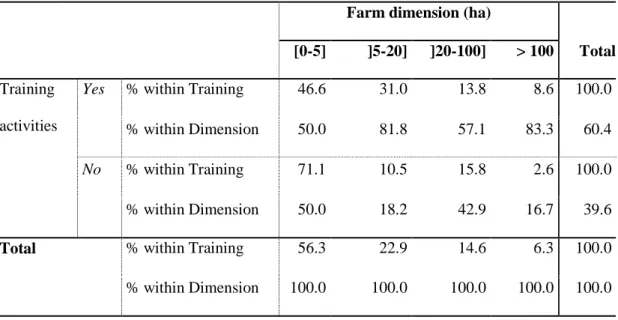
Also the participation in training activities was found associated with the dimension of the farms, although the intensity of this association was weak (Chi square test: χ2 = 8.044, Cramer’s V = 0.289). The results of the Chi square test indicate significant differences as the p-value (p = 0.045) was lower than the level of significance considered (α = 0.05). The results in Table 9 show that for owners of smaller farms (up to 5 ha) the percentage of those who participate in training activities is the same as that of those who do not, but for farmers bigger than 20 ha, the interest in training is higher and the percentage of participants involved is considerably higher. For those who participated, in 15 times they participated as teachers, 68 times as students and 9 times as coordinators (Results not in Table).
The results in Table 10 show that the engagement in training activities in the role of teacher was statistically different whether the participant did or did not practice agriculture (Chi square test: χ2 = 4.282, p = 0.039, Cramer’s V = 0.251). Interestingly, the participants who practiced agriculture acted as teachers more often (28.6%) than those teachers without agricultural practice (7.7%).
The participation as teacher was not found related to the age of the participant, according to the results of the Chi square test (χ2 = 5.093, p = 0.078, Cramer’s V = 0.259). Still, the results in Table 11 reveal a trend, although not statistically confirmed, for the teachers to be aged between 31 and 50 years old.
results of the Chi square test (χ2 = 1.857, p = 0.603, Cramer’s V = 0.156). However, the frequency of teachers with lower levels of education (up to secondary school) seems to be lower when compared to that of teachers with a level IV course or higher education (Table 12).
Table 13 presents the relation between farm dimension and the role of teacher, and it shows that the differences were not high among the classes of farm size, with the percentage of teachers ranging from 11.1% to 22.2%. The Chi square test confirmed that there were no statistically significant differences (χ2 = 1.096, p = 0.778, Cramer’s V = 0.137).
Similar tests were made to the relations between the role of student or that of coordinator and the variables: practicing agriculture, farm dimension, age group or school level (Tables not presented).
The results of the Chi square test indicated that there was no statistically significant association between the practice of agriculture and participating in training activities in the role of student (χ2 = 0.002, p = 0.964, Cramer’s V = 0.006), and the percentage of students with agriculture experience was similar to those without (88.1% and 88.5%, respectively). The Chi square test demonstrated that the variables farm dimension and student in training activities were not associated (χ2 = 3.696, p = 0.296, Cramer’s V = 0.252). In fact, the percentage of students enrolled in training activities did not vary much with farm dimension, from 77.8% in the case of farms between 5 and 20 ha to 100% in the case of farms between 20 and 100 ha. The age of the students involved in training activates showed statistically significant differences, according to the results of the Chi square test (χ2 = 9.935, p = 0.007, Cramer’s V = 0.362). The percentage of students involved in training
activities in agriculture was higher for the participants under 30 years old and for those aged over 51 years, when compared to the participants aged between 31 and 50 years, probably because these last might not have so much free time to participate in training courses due to their professional activities. The level of education, on the other hand, was not found to influence the participation in training activities as student (Chi square test: χ2 = 0.994, p = 0.803, Cramer’s V = 0.114). Among the participants in this study, the percentage of students who participated in training activities was similar regardless of the school level, varying from 87.4% for participant with higher educations to 100% for participants with basic school (Results not presented in Table format).
The participation as coordinator in training activities in agriculture was not found related to any of the variables tested: practice agriculture, farm dimension, age group or school level. The results of the Chi square tests indicated in all cases that no statistically significant differences were found. Although the coordinators appeared to be more frequent among those who practice agriculture (66.7%), this trend was not confirmed statistically by the results of the Chi square test (χ2 = 0.106, p = 0.745, Cramer’s V = 0.039). A slightly higher percentage of the coordinators had farms between 5 and 20 ha, followed by the farms between 20 and 100 ha. Once again, this difference was not statistically significant (Chi square test: χ2 = 2.932, p = 0.402, Cramer’s V = 0.225). The coordinators were mostly aged between 31 and 50 years, with a very low percentage among the participants aged less than 30 years (3.1%). However, this observation can’t be generalized, because the results of the Chi square test did not confirm an association between these two variables (χ2 = 4.326, p = 0.115, Cramer’s V = 0.239). The participants in the present study who acted as coordinators in training activities had at least the level IV of education. Still, this does not
imply an association between these variables, according to the results of the Chi square test (χ2 = 2.755, p = 0.431, Cramer’s V = 0.190) (Results not presented in Table format).
The participants in this study showed to have participated more in training activities in classroom (68 times), when compared to e-learning (12 times), b-learning (8-times), m-learning (4 times) or practical activities (3 times) (Results not presented in Table format). The percentage of participants who frequented training in classroom was 87.7% (Table 14), and this was not influenced by the level of education, as indicated by the results of the Chi square test (χ2 = 7.081, p = 0.069, Cramer’s V = 0.311), thus confirming that there were no statistically significant differences among the levels of education considered.
The participants who frequented training in classroom were evenly represented in the different age groups, with percentages varying from 82.9 to 100% (Table 15). These differences were not statistically significant as demonstrated by the results of the Chi square test (χ2 = 2.026, p = 0.363, Cramer’s V = 0.167).
Table 16 show the relation between classroom learning and country and in this case the differences between countries were statistically significant (Chi square test: χ2 = 12.915, p = 0.044, Cramer’s V = 0.421). The participants from countries such as Italy, Spain, Portugal or United Kingdom participated always in classroom training, differing from Slovakia, where the percentage was considerably lower (64.3%).
The participants in the study who did training in the format of e-learning all had higher education. However, no statistically significant association was found between these variables, as indicated by the results of the Chi square test (χ2 =4.013, p = 0.260, Cramer’s V = 0.236). The association between participating in training in e-learning format and age is not statistically significant (Chi square test: χ2 =2.271, p = 0.321, Cramer’s V = 0.178).
However, in the sample at study none of the participants aged over 50 did training by e-learning. Regarding the participation in e-learning training across countries, Spain lead with 66.7% of the participants having used it, followed by the United Kingdom (22.2%) and with the lowest percentage came Turkey (7.1%). Still this results can´t be generalized, because the results of the Chi square test indicated that no association between e-leaning and country can be inferred (χ2 =7.769, p = 0.255, Cramer’s V = 0.328) (Results not presented in Table format).
Similarly to what was observed for e-learning, also m-learning training was used essentially by people with more education (Level IV: 9.1% or higher education: 25.0%). However, the results of the Chi square test did not confirm the association between these variables (χ2 =2.678, p = 0.444, Cramer’s V = 0.193). Also in this case, the participants who used m-learning were aged under 50 years, but the results of the Chi square test did not allow inferring a statistically significant association between these variables (χ2 =3.517, p = 0.172, Cramer’s V = 0.221) (Results not presented in Table format).
Regarding the participation in b-learning training activities, the participants from Hungary lead (15.4%) followed by Slovakia 14.3% and United Kingdom (11.1%) (Table not shown).
The participants from Italy, Spain or Turkey never have used m-learning in their training activities. Again, this trend was not confirmed by statistical analysis (Chi square test (χ2 =3.684, p = 0.719, Cramer’s V = 0.226). As seen previously for other distance learning formats, also for m-learning the participants had a greater level of education (level IV or higher education). Nevertheless, the associations between these variables was not confirmed statistically (Chi square test (χ2 =4.952, p = 0.175, Cramer’s V = 0.262). The
profile of participants in the survey using m-learning refers to people under 50, but no statistically significant association was found between using m-learning and age (Chi square test: χ2 =0.651, p = 0.722, Cramer’s V = 0.095). Finally the use of m-learning by the participants from the different countries showed that only participants from Slovakia and United Kingdom used it, whereas in the other countries none of the participants was enrolled in training in the format of m-learning. However, no statistically significant association could be inferred between these variables as the results of the Chi square test indicate (χ2 =6.807, p = 0.339, Cramer’s V = 0.307).
Conclusions
This work allowed characterizing a specific target group for training in organic farming in m-learning context in seven European countries. The majority of the participants had a higher degree and from those, although in most cases in areas other than agriculture.
More than half of the participants presently have some agricultural activity and one third are thinking about starting one the future. The average farm dimension is relatively small for the participants included in the study.Regarding the production system adopted, most of the participants are interested in producing foods in organic mode, showing significant differences among the countries at study.
Regarding training activities in agriculture or other related areas, most of the survey participants were enrolled in such actions, and especially those with higher levels of education. The participation in training activities showed significant difference between countries, but also according to the dimension of the farms owned by the participants. The role in which they participated was mainly student, followed by teacher and then coordinator. A significant association was found between being a teacher in forming
activities related to agriculture and being a farmer.
With respect to the typology of the training activities, the participants in this study participated more frequently in training activities in classroom, when compared to distance learning. A significant association was found between classroom learning and country, with differences among the countries included in the study.
Discussion
In this survey, the respondents who participated in training activities related to agriculture slightly increased with age until 50 years, which might be related to their need to update their levels of knowledge. In general, people present different education necessities relating to their areas of interest, professional or intellectual development or even diverse needs along the life cycle. Furthermore, because the social environments change at a high rate and the amounts of new information and knowledge available increase very rapidly in this developing world, the “Life-long Learning” practices become more and more a reality and a necessity (Ozdamli and Ozdal, 2015).
The owners of bigger farms (over 20 ha), seem to demonstrate a higher interest in participating in training activities as compared to those with smaller farms. This might be owing to the responsibilities involved, since for bigger farms the quantities produced are higher and therefore the money involved is greater, either in terms of profits or losses. Factors such as insects and other pests, climate and irrigation, soil fertility among others, seriously affect crop yields, with consequent economic losses for farmers (Liang et al., 2016; Supit et al., 2012). Therefore, knowledge about how to adequately manage and run the farms and the crops is pivotal for the success of the farmer.
when compared to those with lower levels of education. This might be related to the more developed learning habits and necessities of those who completed university graduation (Swaggerty and Broemmel, 2017).
The results from the present study indicated that mostly the participants in training activities did so in classroom environment, with higher expressions for lower levels of education. Alternatively, the e-learning format was used by people with higher education. People who frequented higher education institutions are more frequently engaged in on-line supported complementary activities to support practical learning, and therefore are more used to them and better understand their importance (Dean and Levis, 2016). The success of adult learning is related to the use of motivational tools, instructional media and adequate evaluation tasks (Sung, 2015; Tse et al., 2017). Studies comparing online and face-to-face educational courses have proved that learning effectiveness is similar in both environments (Swaggerty and Broemmel, 2017). Hence, there integration of e-learning used in formal education into non-formal or informal education is presently a reality for adult learners (Sung, 2015).
Implications and limitations
The present study allowed obtaining important information to help understanding the profile of the potential clients for training programs for adults who need to complement their knowledge about Organic Farming. In this way it would be possible to try fit the programs so as to meet their expectations and in that way incentive then to participate more actively in training activities through mobile learning. In fact, this is a challenge given that in the 7 countries included in the study, the preferences clearly seems to go for classroom courses, either because of cultural and/or professional reasons or because the offer in those
programs is still in the traditional form. Hence innovate and offer alternative training programs seems like an opportunity to finds new publics, and increase the level of knowledge of adults who need to complement their education.
Some limitations could however be noticed, namely related to the low number of participants, particularly when analysing by country. The agricultural areas have been traditionally on the hands of people which might not yet understand the importance of studies like this one, and therefore the adhesion to the participation by responding to the questionnaire was not as high as desired. Another limitation relates to a specific target group that was defined in the moment of the planning of the study, for reasons related to the aims of the project in which the study was focused, and specifically young adults who have a high education but need to complement their knowledge about organic farming. Therefore, the results might not necessarily represent with accuracy all possible people showing future interest in mobile training in the area of organic farming.
Acknowledgment
Removed for blindness purposes
References
Aguado-Giménez, F., Gairín, J.I., Fernandez-Gonzalez, V., Moltó, M.B., Cerezo-Valverde, J. and Sanchez-Jerez, P. (2015), “Application of ‘taxocene surrogation’ and ‘taxonomic sufficiency’ concepts to fish farming environmental monitoring. Comparison of BOPA index versus polychaete assemblage structure”, Marine
Andersen, M.M., Landes, X., Xiang, W., Anyshchenko, A., Falhof, J., Østerberg, J.T., Olsen, L.I., et al. (2015), “Feasibility of new breeding techniques for organic farming”, Trends in Plant Science, Vol. 20 No. 7, pp. 426–434.
Bostan, I., Beloiu, R. and Bizon, N. (2015), “Learning Digital Frequency Dividers Through Practical Laboratory Activities”, Procedia - Social and Behavioral Sciences, Vol. 180, pp. 1014–1021.
Dean, M. and Levis, A. (2016), “Does the use of a university lecturer as a visiting tutor support learning and assessment during physiotherapy students’ clinical placements? A survey of higher education institution providers”, Physiotherapy, Vol. 102 No. 4, pp. 365–370.
Groot, J.C., Rossing, W.A.H., Tichit, M., Turpin, N., Jellema, A., Baudry, J., Verburg, P.H., et al. (2009), “On the contribution of modelling to multifunctional agriculture: Learning from comparisons”, Journal of Environmental Management, Vol. 90 No. Sup 2, pp. S147–S160.
Knowles, M.S. (1984), Andragogy in Action: Applying Modern Principles of Adult
Learning, 1st Ed., Jossey-Bass, an Francisco, USA, available at:
http://www.amazon.com/Andragogy-Action-Principles-Jossey-Bass-education/dp/0875896219 (accessed 4 October 2015).
Liang, J., Tang, S. and Cheke, R.A. (2016), “Pure Bt-crop and mixed seed sowing strategies for optimal economic profit in the face of pest resistance to pesticides and Bt-corn”, Applied Mathematics and Computation, Vol. 283, pp. 6–21.
López, C.P. and Requena, J.C. (2005), “Factors related to the adoption of organic farming in Spanish olive orchards”, Spanish Journal of Agricultural Research, Vol. 3 No. 1, pp. 5–16.
Nicolau, A. (2010), “Structural funds and the concept of lifelong learning in Romania”,
Procedia - Social and Behavioral Sciences, Vol. 2 No. 2, pp. 5625–5629.
Oprea, C.L. (2014), “Interactive and Creative Learning of the Adults”, Procedia - Social
and Behavioral Sciences, Vol. 142, pp. 493–498.
Ozdamli, F. and Ozdal, H. (2015), “Life-long Learning Competence Perceptions of the Teachers and Abilities in Using Information-Communication Technologies”,
Procedia - Social and Behavioral Sciences, Vol. 182, pp. 718–725.
Parra-López, C., Calatrava-Requena, J. and de-Haro-Giménez, T. (2008), “A systemic comparative assessment of the multifunctional performance of alternative olive systems in Spain within an AHP-extended framework”, Ecological Economics, Vol. 64 No. 4, pp. 820–834.
Polat, F. (2015), “Organic Farming Education in Azerbaijan, Present and Future”, Procedia
- Social and Behavioral Sciences, Vol. 197, pp. 2407–2410.
Rozman, Č., Pažek, K., Kljajić, M., Bavec, M., Turk, J., Bavec, F., Kofjač, D., et al. (2013), “The dynamic simulation of organic farming development scenarios – A case study in Slovenia”, Computers and Electronics in Agriculture, Vol. 96, pp. 163–172. Slavkovic, N. and Savic, A. (2015), “The Usage of m Learning for Adult Education in
Serbia”, Procedia - Social and Behavioral Sciences, Vol. 174, pp. 2806–2812. Sung, M. (2015), “A Study of Adults’ Perception and Needs for Smart Learning”, Procedia
- Social and Behavioral Sciences, Vol. 191, pp. 115–120.
Supit, I., van Diepen, C.A., de Wit, A.J.W., Wolf, J., Kabat, P., Baruth, B. and Ludwig, F. (2012), “Assessing climate change effects on European crop yields using the Crop Growth Monitoring System and a weather generator”, Agricultural and Forest
Swaggerty, E.A. and Broemmel, A.D. (2017), “Authenticity, relevance, and connectedness: Graduate students’ learning preferences and experiences in an online reading education course”, The Internet and Higher Education, Vol. 32, pp. 80–86.
Tse, A.C.Y., Wong, T.W.L. and Masters, R.S.W. (2017), “Examining motor learning in older adults using analogy instruction”, Psychology of Sport and Exercise, Vol. 28, pp. 78–84.
Tables & Captions
Table 1. Age (in years) of the participants by country.
Country N Minimum Maximum Mean Standard Deviation
Hungary (HU) 25 22 65 32.76 8.90 Italy (IT) 10 18 59 35.60 14.26 Portugal (PT) 22 21 66 37.23 9.56 Slovakia (SK) 22 20 50 32.68 9.77 Spain (ES) 24 23 64 34.04 10.30 Turkey (TR) 19 21 70 41.68 14.41
United Kingdom (UK) 11 18 51 32.36 12.56
Table 2. Crosstabulation between education and country. Country Total HU IT PT SK ES TK UK School level Basic Count 2 0 2 0 2 3 0 9
% within School level 22.2 0.0 22.2 0.0 22.2 33.3 0.0 100.0
% within Country 8.0 0.0 9.1 0.0 8.3 15.8 0.0 6.8
Secondary Count 2 6 5 4 0 4 2 23
% within School level 8.7 26.1 21.7 17.4 0.0 17.4 8.7 100.0
% within Country 8.0 60.0 22.7 18.2 0.0 21.1 18.2 17.3
Level IV Count 1 1 0 5 2 0 1 10
% within School level 10.0 10.0 0.0 50.0 20.0 0.0 10.0 100.0
% within Country 4.0 10.0 0.0 22.7 8.3 0.0 9.1 7.5
Higher Education
Count 20 3 15 13 20 12 8 91
% within School level 22.0 3.3 16.5 14.3 22.0 13.2 8.8 100.0
% within Country 80.0 30.0 68.2 59.1 83.3 63.2 72.7 68.4
Total Count 25 10 22 22 24 19 11 133
% within School level 18.8 7.5 16.5 16.5 18.0 14.3 8.3 100.0
Table 3. Crosstabulation between country and the dimension of the farms.
Farm dimension (ha)
Total [0-5] ]5-20] ]20-100] > 100
Country Hungary % within Country 89.5 0.0 10.5 0.0 100.0
% within Dimension 31.5 0.0 14.3 0.0 19.8
Italy % within Country 55.6 33.3 11.1 0.0 100.0
% within Dimension 9.3 13.6 7.1 0.0 9.4
Portugal % within Country 66.7 28.6 4.8 0.0 100.0
% within Dimension 25.9 27.3 7.1 0.0 21.9
Slovakia % within Country 62.5 18.8 12.5 6.3 100.0
% within Dimension 18.5 13.6 14.3 16.7 16.7
Spain % within Country 100.0 0.0 0.0 0.0 100.0
% within Dimension 7.4 0.0 0.0 0.0 4.2
Turkey % within Country 5.3 42.1 36.8 15.8 100.0
% within Dimension 1.9 36.4 50.0 50.0 19.8
United Kingdom
% within Country 37.5 25.0 12.5 25.0 100.0
% within Dimension 5.6 9.1 7.1 33.3 8.3
Total % within Country 56.3 22.9 14.6 6.3 100.0
Table 4. Crosstabulation between practicing organic farming and education.
School level
Total Basic Secondary Level IV Higher ed.
Practicing
organic
farming
Yes % within Org farm 9.5 25.7 5.4 59.5 100.0
% within Education 87.5 90.5 50.0 66.7 71.8
No % within Org farm 3.4 6.9 13.8 75.9 100.0
% within Education 12.5 9.5 50.0 33.3 28.2
Total % within Org farm 7.8 20.4 7.8 64.1 100.0
Table 5. Crosstabulation between practicing organic farming and country. Country1 HU IT PT SK ES TK UK Total Practicing organic farming
Yes % within Org farm 25.7 13.5 25.7 18.9 2.7 13.5 * 100.0
% within Country 76.0 100.0 86.4 63.3 40.0 52.6 * 71.8
No % within Org farm 20.7 0.0 10.3 27.6 10.3 31.0 * 100.0
% within Country 24.0 0.0 13.6 36.4 60.0 47.4 * 28.2
Total % within Org farm 24.3 9.7 21.4 21.4 4.9 18.4 * 100.0
% within Country 100.0 100.0 100.0 100.0 100.0 100.0 * 100.0
1 HU = Hungary, IT = Italy, PT = Portugal, SK = Slovakia, ES = Spain, TK = Turkey, UK = United
Kingdom
Table 6. Crosstabulation between participation in training activities and education.
School level
Total Basic Secondary Level IV Higher ed.
Training
activities
Yes % within Training 3.9 14.5 5.3 76.3 100.0
% within Education 33.3 47.8 40.0 63.7 57.1
No % within Training 10.5 21.1 10.5 57.9 100.0
% within Education 66.7 52.2 60.0 36.3 42.9
Total % within Training 6.8 17.3 7.5 68.4 100.0
Table 7. Crosstabulation between participation in training activities and age.
Age (years)
≤ 30 31 to 50 ≥ 51 Total
Training
activities
Yes % within Training 42.1 47.4 10.5 100.0
% within Age 54.2 59.0 61.5 57.1
No % within Training 47.4 43.9 8.8 100.0
% within Age 45.8 41.0 38.5 42.9
Total % within Training 44.4 45.9 9.8 100.0
Table 8. Crosstabulation between participation in training activities and country.
Country1
HU IT PT SK ES TK UK Total
Training
activities
Yes % within Training 18.4 7.9 18.4 21.1 3.9 18.4 11.8 100.0
% within Country 56.0 60.0 63.6 72.7 12.5 73.7 81.8 57.1
No % within Training 19.3 7.0 14.0 10.5 36.8 8.8 3.5 100.0
% within Country 44.0 40.0 36.4 27.3 87.5 26.3 18.2 42.9
Total % within Training 18.8 7.5 16.5 16.5 18.0 14.3 8.3 100.0
% within Country 100.0 100.0 100.0 100.0 100.0 100.0 100.0 100.0
1 HU = Hungary, IT = Italy, PT = Portugal, SK = Slovakia, ES = Spain, TK = Turkey, UK = United
Table 9. Crosstabulation between participation in training activities and farm dimension.
Farm dimension (ha)
Total [0-5] ]5-20] ]20-100] > 100
Training
activities
Yes % within Training 46.6 31.0 13.8 8.6 100.0
% within Dimension 50.0 81.8 57.1 83.3 60.4
No % within Training 71.1 10.5 15.8 2.6 100.0
% within Dimension 50.0 18.2 42.9 16.7 39.6
Total % within Training 56.3 22.9 14.6 6.3 100.0
Table 10. Crosstabulation between being teacher and practicing some agricultural activity.
Practice agriculture
Yes No Total
Role:
teacher
Yes % within Teacher 85.7 14.3 100.0
% within Practicing agriculture 28.6 7.7 20.6
No % within Teacher 55.6 44.4 100.0
% within Practicing agriculture 71.4 92.3 79.4
Total % within Teacher 61.8 38.2 100.0
Table 11. Crosstabulation between being teacher and age group.
Age (years)
≤ 30 31 to 50 ≥ 51 Total
Role:
teacher
Yes % within Teacher 20.0 73.3 6.7 100.0
% within Age 9.4 30.6 12.5 19.7
No % within Teacher 47.5 41.0 11.5 100.0
% within Age 90.6 69.4 87.5 80.3
Total % within Teacher 42.1 47.4 10.5 100.0
Table 12. Crosstabulation between being teacher and level of education.
School level
Total Basic Secondary Level IV Higher ed.
Role:
teacher
Yes % within Teacher 0.0 6.7 6.7 86.7 100.0
% within Education 0.0 9.1 25.0 22.4 19.7
No % within Teacher 4.9 16.4 4.9 73.8 100.0
% within Education 100.0 90.9 75.0 77.6 80.3
Total % within Teacher 3.9 14.5 5.3 76.3 100.0
Table 13. Crosstabulation between being teacher and farm dimension.
Farm dimension (ha)
Total [0-5] ]5-20] ]20-100] > 100
Role:
teacher
Yes % within Teacher 60.0 20.0 10.0 10.0 100.0
% within Dimension 22.2 11.1 12.5 20.0 17.2
No % within Teacher 43.8 33.3 14.6 8.3 100.0
% within Dimension 77.8 88.9 87.5 80.0 82.8
Total % within Teacher 46.6 31.0 13.8 8.6 100.0
Table 14. Crosstabulation between classroom learning and level of education.
School level
Total Basic Secondary Level IV Higher ed.
Classroom
learning
Yes % within Classroom 4.7 15.6 3.1 76.6 100.0
% within Education 100.0 100.0 50.0 87.5 87.7
No % within Classroom 0.0 0.0 22.2 77.8 100.0
% within Education 0.0 0.0 50.0 12.5 12.3
Total % within Classroom 4.1 13.7 5.5 76.7 100.0
Table 15. Crosstabulation between classroom learning and age group.
Age (years)
≤ 30 31 to 50 ≥ 51 Total
Classroom
learning
Yes % within Classroom 42.2 45.3 12.5 100.0
% within Age 90.0 82.9 100.0 87.7
No % within Classroom 33.3 66.7 0.0 100.0
% within Age 10.0 17.1 0.0 12.3
Total % within Classroom 41.1 47.9 11.0 100.0
Table 16. Crosstabulation between classroom learning and country.
Country1
HU IT PT SK ES TK UK Total
Classroom
learning
Yes % within Classroom 18.8 9.4 21.9 14.1 4.7 17.2 14.1 100.0
% within Country 92.3 100.0 100.0 64.3 100.0 78.6 100.0 87.7
No % within Classroom 11.1 0.0 0.0 56.6 0.0 33.3 0.0 100.0
% within Country 7.7 0.0 0.0 35.7 0.0 21.4 0.0 12.3
Total % within Classroom 17.8 8.2 19.2 19.2 4.1 19.2 12.3 100.0
% within Country 100.0 100.0 100.0 100.0 100.0 100.0 100.0 100.0
1 HU = Hungary, IT = Italy, PT = Portugal, SK = Slovakia, ES = Spain, TK = Turkey, UK = United
Figure captions
Figure 1. Distribution of the participants by country.
19% 8% 16% 16% 18% 14% 9% Hungary Italy Portugal Slovakia Spain Turkey United Kingdom