1
2
3
THE MOTIVATIONS THAT DEFINE EATING PATTERNS IN SOME
4
MEDITERRANEAN COUNTRIES
5
6
Raquel P. F. Guiné1*, Ana Cristina Ferrão1, Manuela Ferreira1, Paula Correia1,
7
Ana Paula Cardoso1, João Duarte1, Ivana Rumbak2, Abdel-Moneim Shehata3,
8
Elena Vittadini4, Maria Papageorgiou5
9
10
1CI&DETS Research Centre, Polytechnic Institute of Viseu, Viseu, Portugal. 11
2Faculty of Food Technology and Biotechnology, University of Zagreb, Croatia 12
3Psychology Department, Faculty of Arts, Menoufia University, Shebeen El-Koom, 13
Menoufia, Egypt 14
4Department of Food Science, University of Parma, Italy 15
5Alexander Technological Educational Institute of Thessaloniiki, Dep. of Food 16
Technology, Thessaloniki, Greece 17 18 *Corresponding author: 19 Raquel P. F. Guiné 20
Escola Superior Agrária de Viseu, Quinta da Alagoa, Estrada de Nelas, Ranhados, 3500-606
21 Viseu, Portugal. 22 Tel: + 351 232 446 640; Fax: +351 232 426 536 23 E-mail: raquelguine@esav.ipv.pt 24 25 26
Published article citation:
Guiné RPF, Ferrão AC, Ferreira M, Correia P, Cardoso AP, Duarte J, Rumbak I, Shehata A-M, Vittadini E, Papageorgiou M. (2019) The motivations that define eating patterns in some Mediterranean countries. Nutrition and Food Science, 49(6), 1126-1141.
2 27
Abstract
28
Purpose: This study is part of the international project EATMOT, designed to investigate
29
several issues related to food choice and consumption patterns in different countries, 30
including health related factors; economic and availability aspects; emotional 31
determinants; social, cultural and religious influences; marketing and advertising 32
campaigns and finally environmental concerns. 33
Methodology: The present study was based on a questionnaire that was exclusively
34
prepared for the project, and which was applied to collect data in different countries, in 35
particular Croatia, Egypt, Italy, Greece and Portugal, which are typically associated with 36
the Mediterranean diet. 37
Findings: The results obtained allowed, in general, to conclude that in all 5 countries the
38
motivations related to health as well as environment & politics were the more relevant to 39
determine people’s eating habits (scores varying from 0.3 to 0.7). Women were more 40
influenced by eating motivations than men, and people with moderate exercise were more 41
susceptible to health and environmental motivations and less to emotional, social or 42
marketing motivations (p <0.001 in all cases). It was also observed that people who 43
adopted a special diet were more prone to eating motivations and that the emotional 44
motivations were more pronounced in people with eating disorders (p <0.001). Finally, 45
people without chronic diseases or allergies were even more influenced by health 46
motivations than those who actually suffered from these health problems (p <0.001 in 47
both cases). 48
Originality/Value: This work is important due to the multinational coverage, thus
49
allowing to evaluate the most relevant factors that influenced the food choices of the 50
populations around the Mediterranean Sea, sharing the common link to the Mediterranean 51
3
Diet. The study allowed concluding that, in general, the food choices were primarily 52
determined by health factors, and also by concerns related to the environment and 53
sustainability as well as by political influences. 54
55
Keywords: psychology of eating, questionnaire survey, healthy diet, traditional food
56
57
1. INTRODUCTION
58
The Mediterranean Diet (MD) is a dietary pattern usually followed by the people of 59
some countries situated near to the Mediterranean Sea (Boccardi et al., 2018) and is 60
characterized by a high consumption of vegetables, fruits, whole grains, legumes, nuts, 61
and seeds; by an abundant consumption of olive oil, the privileged source of dietary fat; 62
by a moderate to low consumption of animal products; and by a regular but moderate 63
consumption of red wine at mealtimes (Ostan et al., 2015; Thodis et al., 2018; 64
Trichopoulou et al., 2003). This dietary pattern is also associated with the importance of 65
people eating with company, among family and friends (Boccardi et al., 2018). Moreover, 66
the Mediterranean dietary patterns may vary according to age, gender, ethnicity, culture 67
and other lifestyle factors (Barrea et al., 2018; Park et al., 2005). Scientific evidence has 68
shown that the adherence to the MD is associated with several health benefits, such as, 69
for example, a lower incidence of cancer, cognitive diseases and cardiovascular diseases 70
(CVD) (Grosso et al., 2014; Renzella et al., 2018; Schwingshackl and Hoffmann, 2015; 71
Singh, 2016). However, despite the benefits of this dietary pattern, some people are 72
changing the traditional MD by introducing unhealthier foods, such as low nutrient dense 73
foods (Castro-Quezada et al., 2014). In fact, choosing to adopt a specific dietary regimen 74
involves different factors interrelated with each other (Köster, 2009; Organ et al., 2015). 75
4
A healthy diet helps to protect against malnutrition in all forms, as well as 76
noncommunicable diseases (NCDs), such as diabetes, heart disease, stroke and cancer 77
(World Health Organization, 2018a). Nowadays, people are more aware about the 78
association between the quality of the diet and their personal health (van Buul et al., 79
2017). However, despite this knowledge, even health-conscious consumers often make 80
unhealthy food choices, because the knowledge about a healthy eating not always 81
translates into a dietary change or into better eating habits (Mai and Hoffmann, 2014). 82
During a day, individuals are confronted with several food choices, which are driven by 83
reasons that they are not fully aware. Food choice is a complex system influenced by 84
multiple factors related to the product (such as sensory properties), and also to the 85
consumer (like for example restrictions or preferences) as well as the consumption 86
context (culture, religion, health, convenience and price, biology, emotions, marketing, 87
political and also environmental concerns) (Kaya, 2016; Pelly et al., 2018; Stasi et al., 88
2018). Among the different motivations that influence food choices, culture is one of the 89
most important and explains the differences in food preferences across countries and 90
cultures (Rozin, 2007; Siegrist et al., 2015). In fact, food consumption is closely related 91
to the social context, since food, through its symbolic value, can help to successfully 92
reveal people’s identities and demonstrate who they are and where they belong within 93
society (Barauskaite et al., 2018; Landström et al., 2009). Hence, given the urgency to 94
improve people’s eating habits (Leng et al., 2017), it is crucial to understand their food 95
motivations, so that the policy recommendations can be more effective. 96
The project EATMOT with title “Psycho-social motivations associated with food 97
choices and eating practices” aims to study the different psychological and social 98
motivations that determine people’s eating patterns in relation to their choices or eating 99
habits and the range of the study is multinational. In the frame of the project it was 100
5
developed a questionnaire that compiled different perspectives provided by existing 101
research about the motivations on eating behaviour, but also extended them by including 102
other motives identified by the project team members. 103
This particular study intended to characterize the motivations that could define eating 104
patterns in the Mediterranean region, more specifically in 5 Mediterranean countries 105
(Croatia, Egypt, Italy, Greece or Portugal), which are typically associated with the 106
Mediterranean diet, and that define a region with characteristic food habits. The factors 107
investigated include aspects related to health, emotions, budget, availability, society, 108
culture, environment, politics, marketing and commerce. These allowed to characterize 109
the food choice determinants of the populations of the targeted region: countries 110
distributed around the Mediterranean Sea under the influence of the Mediterranean Diet, 111
recognized by UNESCO as a cultural heritage of humanity. 112
113
2. DESCRIPTION OF OBSERVATIONAL STUDY
114
2.1. Questionnaire used for assessment of eating motivations
115
For the EATMOT project a questionnaire was developed to investigate the psycho-116
social motivations that influence food choices and eating habits. The questionnaire was 117
first prepared in English and then translated into the native languages of the participating 118
countries, following a double sided translation-checking methodology. The questionnaire 119
was structured in ten different parts: Part I – Sociodemographical data; Part II – 120
Anthropometric data and behavioural and health related elements; Part III – Attitudes 121
relating to healthy food; Part IV – Sources of information about a healthy diet; Part V – 122
Healthy motivations; Part VI – Emotional motivations; Part VII – Economic and 123
availability motivations; Part VIII – Social and cultural motivations; Part IX – 124
Environmental and political motivations; Part X – Marketing and commercial 125
6
motivations. These types of motivations were chosen because many different studies 126
somehow have indicated that eating habits and/or food choices are dependable on factors 127
such as the ones investigated through this questionnaire. The questionnaire was developed 128
and firstly validated on a sample of Portuguese people (Ferrão et al., 2018, 2019) and was 129
than extended into other countries as described in this work, after proper translation. 130
In order to measure the participants’ opinions about the statements that were related 131
to the different types of motivations, they were asked to state their agreement measured 132
on a 5-point Likert scale varying from 1 (totally disagree) to 5 (totally agree) (Likert, 133
1932). Globally, 55 statements related to eating habits and the choice of a certain food 134
were compiled according to different motivations, as indicated: Healthy motivations – 11 135
items; Emotional motivations – 10 items; Economic and availability motivations – 8 136
items; Social and cultural motivations – 11 items; Environmental and political 137
motivations – 8 items; Marketing and commercial motivations – 7 items. 138
139
2.2. Data collection
140
For the present study about the motivations in countries of the Mediterranean area, a 141
descriptive cross-sectional study was performed on a non-probabilistic sample with 4708 142
participants living in Portugal (28%), Greece (11%), Egypt (17%), Croatia (33%) and 143
Italy (11%). The questionnaire was approved by the Ethical Committee (Reference nº 144
04/2017) before being applied. The data collection occurred between September 2017 145
and June 2018, and was addressed only to adults (aged 18 or over), after informed consent 146
was obtained and guaranteeing the confidentiality of the individual answers registered, 147
thus complying with all ethical issues necessary. 148
149
2.3. Statistical analysis
7
The exploratory analysis of the data was made by basic statistical tools. For each of 151
the six types of eating motivations considered, an average value was calculated from the 152
scores obtained in all the items included in that motivation category. The scores of the 153
original scale were recalculated so as to eliminate the effect of the middle point, which 154
became zero instead of 3. Hence the scale for motivations varied from -2 to +2, in which 155
the negative values meant “no influence” and the positive ones meant “influence”. 156
So as to verify whether the mean values were statistically different between groups a 157
statistical analysis was applied. For comparisons between two groups the t-test for 158
independent samples was used, while for comparisons between three groups, was used 159
the Post-Hoc Tukey HSD (Honestly Significant Difference) coupled to an analysis of 160
variance (ANOVA). The use of parametric tests was possible because the conditions were 161
verified, namely the normality of the distribution and equality of variances according to 162
Levene’s test. The analysis of the data was made by using SPSS software from IBM Inc., 163
Version 25 (Armonk, New York, USA) and in all tests the level of significance considered 164 was 5%. 165 166 3. RESULTS 167 3.1. Sample characterization 168
The sample was composed of 4708 participants, aged between 18 and 90 years old, 169
being on average 34.81 ± 14.66 years, from which 68.1% were female and 31.9% were 170
male. As it can be observed in Table 1, the participants were classified into age categories 171
according to: young adults (18 ≤ age ≤ 30), corresponding to 49.3%; average adults (31 172
≤ age ≤ 50), accounting for 32.7%; senior adults (51 ≤ age ≤ 64), representing 15.4%; and 173
finally elderly (≥ 65), which accounted for 2.6% of the sample. 174
8
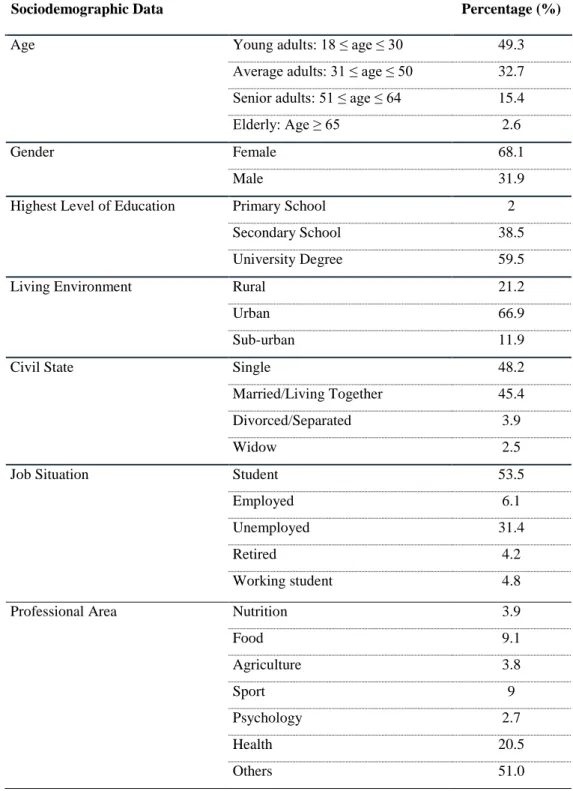
Table 1. Sociodemographic characterization.
176
Sociodemographic Data Percentage (%)
Age Young adults: 18 ≤ age ≤ 30 49.3
Average adults: 31 ≤ age ≤ 50 32.7 Senior adults: 51 ≤ age ≤ 64 15.4
Elderly: Age ≥ 65 2.6
Gender Female 68.1
Male 31.9
Highest Level of Education Primary School 2
Secondary School 38.5
University Degree 59.5
Living Environment Rural 21.2
Urban 66.9
Sub-urban 11.9
Civil State Single 48.2
Married/Living Together 45.4
Divorced/Separated 3.9
Widow 2.5
Job Situation Student 53.5
Employed 6.1
Unemployed 31.4
Retired 4.2
Working student 4.8
Professional Area Nutrition 3.9
Food 9.1 Agriculture 3.8 Sport 9 Psychology 2.7 Health 20.5 Others 51.0 177
Most of the participants (59.5%), had a university degree and only 2.0% of them had 178
the primary school as the highest level of education achieved. As for the civil state, 48.2% 179
of the participants were single, 45.4% were married or lived together as a marital couple, 180
3.9% were divorced or separated and 2.5% were widowed. Regarding the living 181
9
environment, the majority of the participants (66.9%) lived in an urban environment, 182
followed by the participants who lived in rural areas, 21.2%, and finally the ones who 183
lived in sub-urban surroundings, 11.9% (Table 1). 184
Concerning the job situation, most of the participants were students (53.5%), 31.8% 185
were unemployed, 6.1% were employed, 4.8% were working students and 4.2% were 186
retired (Table 1). As for the participants’ professional activity or field of studies, the 187
majority of the participants, 51%, did not have a professional activity or field of studies 188
related to any of the options suggested in the questionnaire (nutrition, food science, 189
agriculture, sport, psychology, activities related to other health areas), 20.5% had a 190
professional activity or field of studies related to other health areas, 9.1% had a 191
professional activity or field of studies related to food, 9% had a profession or studies 192
related to sports, 3.9% had a professional activity or field of studies related to nutrition, 193
3.8% had a professional activity or field of studies related to agriculture and 2.7% had an 194
activity or studies in the psychology area. 195
Regarding the anthropometric data for the sample at study, the height was for the 196
whole sample on average 1.7 ± 0.1 meters (1.65 ± 0.07 m for women and 1.79 ± 0.08 m 197
for men), and the weight was on average 68.64 ± 14.34 kg (63.60 ± 11.49 kg for women 198
and 79.22 ± 13.87 kg for men). The Body Mass Index (BMI) was calculated as weight 199
(kg) divided by the square of height (m2) and then classified according to the standards
200
of the International Classification: underweight (BMI < 18.5 kg/m2), normal weight (18.5 201
≤ BMI ≤ 24.99 kg/m2), overweight (25 ≤ BMI ≤ 29.99 kg/m2) and obese (BMI ≥ 30.00
202
kg/m2) (World health Organization, 2006). The results showed that the BMI for the whole 203
sample was on average equal to 23.71 ± 4.07 kg/m2, which means that in general the 204
participants had a normal weight. When analysed by gender, it was observed that the 205
10
average values for women were lower (23.28 ± 4.12 kg/m2) than those for men (24.64 ± 206
3.81 kg/m2). 207
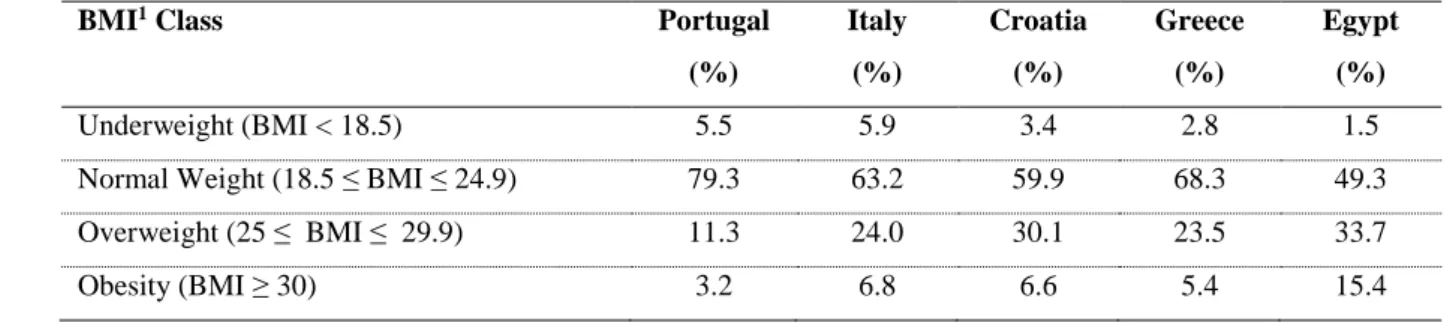
Table 2 presents the BMI class according to country and it shows that, regardless of 208
the country, most of the participants had a normal weight. The results further showed that 209
Egypt had a considerable higher percentage of participants with overweight and obesity, 210
when compared to the other countries. Moreover, Portugal was the country with the 211
lowest percentage of participants classified as overweight or obese. 212
213
Table 2. Frequencies according to BMI Class.
214
BMI1 Class Portugal
(%) Italy (%) Croatia (%) Greece (%) Egypt (%) Underweight (BMI < 18.5) 5.5 5.9 3.4 2.8 1.5
Normal Weight (18.5 ≤ BMI ≤ 24.9) 79.3 63.2 59.9 68.3 49.3
Overweight (25 ≤ BMI ≤ 29.9) 11.3 24.0 30.1 23.5 33.7
Obesity (BMI ≥ 30) 3.2 6.8 6.6 5.4 15.4
1BMI = Body Mass Index
215
216
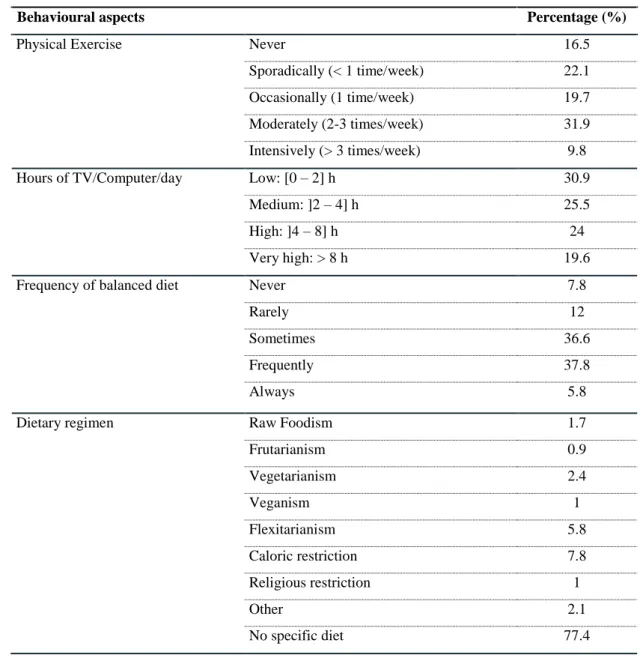
Table 3 presents some of the behavioural aspects that characterize the sample at 217
study. According to the World Health Organization (WHO) (2018b), an inadequate level 218
of physical activity is one of the leading risk factors for death worldwide. In this study, 219
31.9% of the participants answered that they practiced physical exercise moderately and 220
only 9.8% of them practiced physical exercise intensively. On the other hand, a 221
reasonable percentage of the participants, 16.5%, answered that they never practiced 222
physical activity, which is preoccupying attending to the importance of physical activity 223
to promote health at various levels. 224
As for the number of hours per day that the participants spent watching TV or at the 225
computer, it was observed that 30.9% spent between 0 to 2 hours on TV/computer per 226
11
day, which is considered low, while 19.6% of the participants indicated that they spend 227
more than 8 hours per day watching TV or at the computer, and in this case it is considered 228
a very high utilisation of these screen technologies (Table 3). Nevertheless, these results 229
must be interpreted with care, because no distinction was made in que questionnaire as to 230
the use of screens for leisure purposes and for work, in which case it cannot be avoided. 231
A balanced diet is fundamental for the maintenance of health (Schwingshackl et al., 232
2018). Therefore, the participants were asked about how often they believed they 233
practiced a balanced diet, and as it can be observed in Table 5, 37.8% considered that 234
they do it frequently, 36.6% sometimes, 12% rarely, 7.8% never while 5.8% of the 235
participants considered that they always practice a balanced diet. This questions intended 236
to make a self-evaluation of their own eating patterns, but it was based on each one’s 237
individual perception of what they consider to be a healthy diet. Therefore, the results 238
must be read as defining an approximation to a heathy diet. 239
The results in Table 3 further showed that most of the participants, 77.4%, did not 240
follow any specific food regimen. It is interesting to highlight that more women, 8.6%, 241
followed a dietary regimen based on a caloric restriction, when compared to men, 6%. 242
These results are not surprising, since women are more likely to be dissatisfied with their 243
body image than men and therefore they have a greater tendency to adopt dietary 244
regimens that stimulate weight loss (Germov and Williams, 2017). 245
246
12 248
Table 3. Behavioural aspects.
249
Behavioural aspects Percentage (%)
Physical Exercise Never 16.5
Sporadically (< 1 time/week) 22.1
Occasionally (1 time/week) 19.7
Moderately (2-3 times/week) 31.9
Intensively (> 3 times/week) 9.8
Hours of TV/Computer/day Low: [0 – 2] h 30.9
Medium: ]2 – 4] h 25.5
High: ]4 – 8] h 24
Very high: > 8 h 19.6
Frequency of balanced diet Never 7.8
Rarely 12
Sometimes 36.6
Frequently 37.8
Always 5.8
Dietary regimen Raw Foodism 1.7
Frutarianism 0.9 Vegetarianism 2.4 Veganism 1 Flexitarianism 5.8 Caloric restriction 7.8 Religious restriction 1 Other 2.1 No specific diet 77.4 250
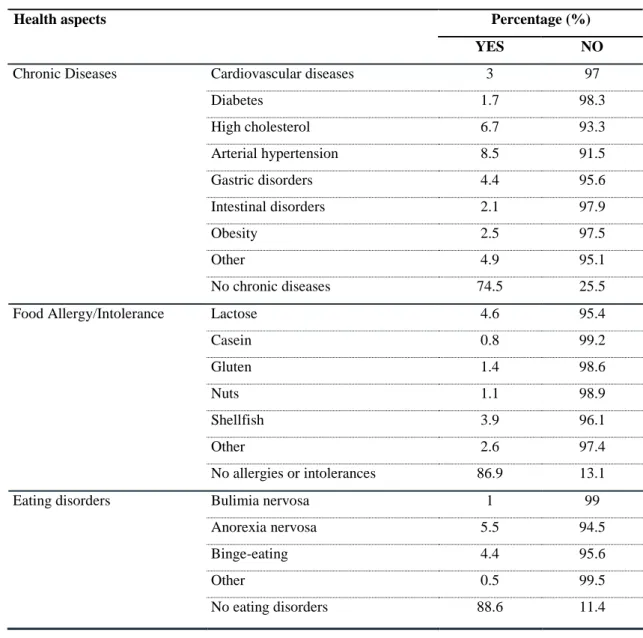
Table 4 presents some health conditions that characterize the sample at study. The 251
results indicate that the majority of the participants, 74.5%, did not have any chronic 252
disease. The fact that most of the participants were aged under 50 years old certainly is 253
one of the factors explaining this result, allied to a possible adherence to the 254
Mediterranean Diet, whose benefits to prevent and fight chronic diseases are documented 255
(Dohrmann et al., 2018; Ndlovu et al., 2018; Serra-Majem et al., 2019). As for the 256
13
participants’ food allergies or intolerances, it was observed that the majority (86.9%) did 257
not suffer from any food allergy or intolerance. 258
259
Table 4. Health aspects.
260
Health aspects Percentage (%)
YES NO
Chronic Diseases Cardiovascular diseases 3 97
Diabetes 1.7 98.3 High cholesterol 6.7 93.3 Arterial hypertension 8.5 91.5 Gastric disorders 4.4 95.6 Intestinal disorders 2.1 97.9 Obesity 2.5 97.5 Other 4.9 95.1 No chronic diseases 74.5 25.5
Food Allergy/Intolerance Lactose 4.6 95.4
Casein 0.8 99.2 Gluten 1.4 98.6 Nuts 1.1 98.9 Shellfish 3.9 96.1 Other 2.6 97.4 No allergies or intolerances 86.9 13.1
Eating disorders Bulimia nervosa 1 99
Anorexia nervosa 5.5 94.5
Binge-eating 4.4 95.6
Other 0.5 99.5
No eating disorders 88.6 11.4
261
From the sample at study, 88.6% of the participants answered that they never had an 262
episode of any eating disorder (Table 4). As for those who had experienced one, the most 263
frequent was anorexia nervosa, at least once by 5.5% of the participants. When seen by 264
gender, it was observed that a higher percentage of women already suffered from at least 265
one eating disorder (bulimia nervosa: 1.4%; anorexia nervosa: 6.4%; binge-eating: 4.8%; 266
14
other: 0.6%) when compared to men (bulimia nervosa: 0.3%; anorexia nervosa: 3.5%; 267
binge-eating: 3.4%; other: 0.2%). In fact, eating disorders are reported to be more 268
common among women than men (Murray et al., 2017). 269
One other important factor related to food choice is depending whether people are 270
responsible for buying their own food. In this study, 83.3% of the participants bought 271
their own food while only 16.79% did not, being this percentage higher for women (87%) 272
than for men (75.6%). 273
274
3.2. Eating motivations
275
Table 5 presents the participants’ eating motivations by country and, in general 276
regardless of the country, the participants’ food choices were not heavily influenced by 277
any of the considered types of motivations. For Portugal and Italy, the participants’ food 278
choices were more influenced by environmental and political motivations, while in 279
Croatia and Egypt the most important motivation was health, and in Greece the 280
participants’ were more influenced by health, as well as environmental and political 281
motivations. The results of the ANOVA test showed that those differences between 282
countries were statistically significant (Health: F = 113.577, p <0.001; Emotional: F = 283
82.377, p <0.001; Economic and availability: F = 66.832, p <0.001; Social and cultural: 284
F = 174.475, p <0.001; Environmental and political: F = 193.268, p <0.001; Marketing 285
and commercial: F = 238.103, p <0.001). These results are not surprising since health is 286
an important determinant for people’s food choices (Birkenhead and Slater, 2015). 287
Additionally to health motivations, consumers’ are more conscientious about the impact 288
of their diets on the environment and also about the importance of adopting diets that are 289
more sustainable from an environmental point of view (Hoek et al., 2017). In a study by 290
Markovina et al. (Markovina et al., 2015) it was found that the most important food choice 291
15
motivation in Portugal and Greece was the price, which does not agree with the finding 292
in this work. However, it is worth mention that the cited study was dated from 2015 and, 293
due to greater alert to the consequences of climate change and pollution effects, the 294
environmental factors may be overcoming those of commodity or even price, because 295
people attribute value to intangible values linked to the preservation of the natural 296
biosystems. Furthermore, the differences between countries could be partially explained 297
by the variations in the climate, geography, socioeconomic factors, culture and history of 298
the countries involved in the study (Hoffman and Gerber, 2013). 299
300
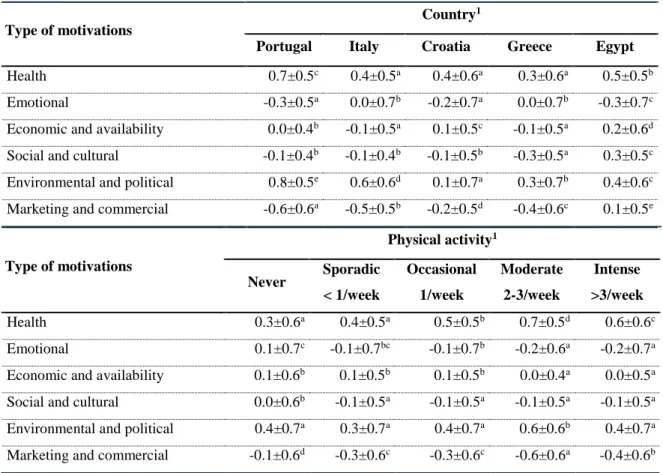
Table 5. Motivations by country and physical exercise.
301
Type of motivations
Country1
Portugal Italy Croatia Greece Egypt
Health 0.7±0.5c 0.4±0.5a 0.4±0.6a 0.3±0.6a 0.5±0.5b
Emotional -0.3±0.5a 0.0±0.7b -0.2±0.7a 0.0±0.7b -0.3±0.7c
Economic and availability 0.0±0.4b -0.1±0.5a 0.1±0.5c -0.1±0.5a 0.2±0.6d
Social and cultural -0.1±0.4b -0.1±0.4b -0.1±0.5b -0.3±0.5a 0.3±0.5c
Environmental and political 0.8±0.5e 0.6±0.6d 0.1±0.7a 0.3±0.7b 0.4±0.6c
Marketing and commercial -0.6±0.6a -0.5±0.5b -0.2±0.5d -0.4±0.6c 0.1±0.5e
Type of motivations Physical activity1 Never Sporadic < 1/week Occasional 1/week Moderate 2-3/week Intense >3/week Health 0.3±0.6a 0.4±0.5a 0.5±0.5b 0.7±0.5d 0.6±0.6c Emotional 0.1±0.7c -0.1±0.7bc -0.1±0.7b -0.2±0.6a -0.2±0.7a
Economic and availability 0.1±0.6b 0.1±0.5b 0.1±0.5b 0.0±0.4a 0.0±0.5a
Social and cultural 0.0±0.6b -0.1±0.5a -0.1±0.5a -0.1±0.5a -0.1±0.5a
Environmental and political 0.4±0.7a 0.3±0.7a 0.4±0.7a 0.6±0.6b 0.4±0.7a
Marketing and commercial -0.1±0.6d -0.3±0.6c -0.3±0.6c -0.6±0.6a -0.4±0.6b 1Scale from -2 (no influence) to +2 (very high influence); all values stand for mean ± standard deviation;
302
values in the same line with the same superscript are not statistically different, ANOVA with Tukey HSD 303
post-hoc test (level of significance 5%). 304
16 306
As it can be observed in Table 5, which relates also eating motivations with physical 307
activity, the motivation with a higher average score was health, 0.7±0.5, for the 308
participants who practiced physical activity moderately (2-3 times per week). Moreover, 309
the results also showed that the participants who practiced physical activity moderately 310
seemed to have more environmental and political concerns when choosing their food 311
(0.6±0.6). On the other hand, the participants who practiced physical activity moderately 312
were less influenced by emotional, social & cultural or marketing & commercial 313
motivations. The results of the ANOVA test showed that the differences between groups 314
were statically significant (Health: F = 98.949, p <0.001; Emotional: F = 24.870, p 315
<0.001; Economic and availability: F = 16.336, p <0.001; Social and cultural: F = 9.339, 316
p <0.001; Environmental and political: F = 45.606, p <0.001; Marketing and commercial: 317
F = 112.735, p <0.001). Another interesting result is the fact that the food choices of the 318
participants who practiced physical activity moderately or intensively were less 319
influenced by emotional concerns, when compared to the other groups of physical 320
activity. In the study of Loprinzi and his colleagues (Loprinzi et al., 2014)it was found 321
that the participants who practiced physical activity according to the guidelines provided 322
by the authors of that study were more likely to adopt a healthy diet. 323
Table 6 shows the participants’ eating motivations according to gender and, as it can 324
be observed, for women the most important motivation was health, while men’s food 325
choices were mainly influenced by health as well as environmental and political concerns. 326
The results of the T-test showed that those differences between genders were statistically 327
significant for almost every type of motivation, with the exception of social and cultural 328
motivations (p = 0.21). Nevertheless, since the average scores were always lower than 329
1.5, for both men and women, their food choices were not much influenced by none of 330
17
the considered types of motivation. These results are in line with previous research, where 331
it was also found that, in general, women are more concerned with their diet, weight and 332
health control (Johansen et al., 2011) and therefore they have a greater tendency to have 333
strong positive motivations towards eating a healthy diet (Naughton et al., 2015). 334
335
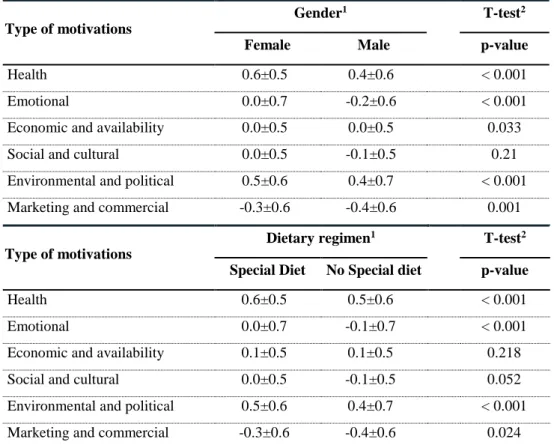
Table 6. Motivations by Gender and dietary regimen.
336
Type of motivations
Gender1 T-test2
Female Male p-value
Health 0.6±0.5 0.4±0.6 < 0.001
Emotional 0.0±0.7 -0.2±0.6 < 0.001
Economic and availability 0.0±0.5 0.0±0.5 0.033
Social and cultural 0.0±0.5 -0.1±0.5 0.21
Environmental and political 0.5±0.6 0.4±0.7 < 0.001
Marketing and commercial -0.3±0.6 -0.4±0.6 0.001
Type of motivations
Dietary regimen1 T-test2
Special Diet No Special diet p-value
Health 0.6±0.5 0.5±0.6 < 0.001
Emotional 0.0±0.7 -0.1±0.7 < 0.001
Economic and availability 0.1±0.5 0.1±0.5 0.218
Social and cultural 0.0±0.5 -0.1±0.5 0.052
Environmental and political 0.5±0.6 0.4±0.7 < 0.001
Marketing and commercial -0.3±0.6 -0.4±0.6 0.024
1Scale from -2 (no influence) to +2 (very high influence); The values stand for mean ± standard
337
deviation. 2T-test for independent samples (level of significance 5%).
338 339
Since people’s dietary regimen is one of the determinants that affects their food 340
choices (Hoefkens et al., 2011), it was also analysed if there were differences in the 341
participants’ food choices according to their dietary regimen. Table 6 also presents the 342
participants’ motivations for food choices by dietary regimen and, in general, the food 343
choices of the participants who followed a special diet were more influenced by different 344
factors when compared with people with a regular diet. The major motivation for the food 345
18
choices of the participants who followed a special diet was health (0.6±0.5), being this 346
significantly higher than for who did not follow any special diet (0.5±0.6). This finding 347
indicates that the participants were aware of the impact of dietary patterns on the 348
development or prevention of diseases, so much that those who followed a special diet 349
did it strongly motivated by health concerns. Many published studies associate special 350
diets with health issues (Braha et al., 2017; Coelho et al., 2019; Guallar-Castillón et al., 351
2012; Lavallee et al., 2019; Satija and Hu, 2018; Yu et al., 2018). The results of the T-352
test showed that the differences in the food choice motivations according to the 353
participants’ dietary regimen were statistically significant, with the exception of the 354
economic & availability motivations (p = 0.218), as well as social & cultural motivations 355
(p = 0.052). 356
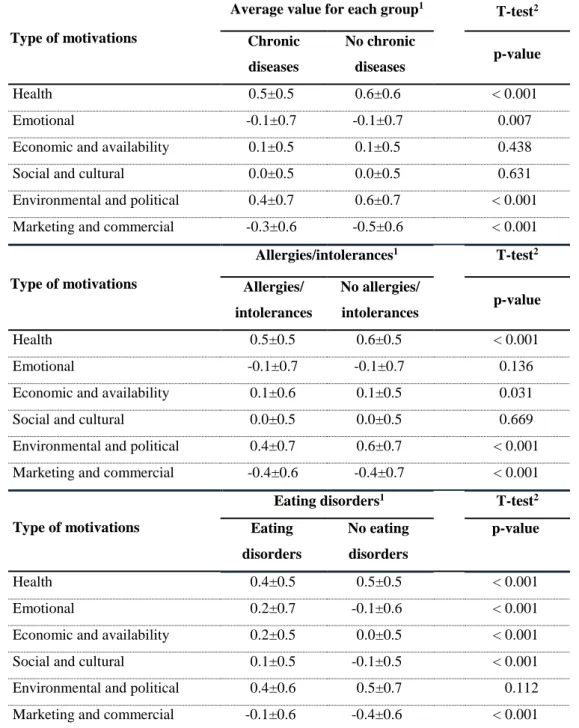
As it can be observed in Table 7 the food choices of the participants who had chronic 357
diseases were more influenced by health motivations (0.5±0.5), followed by the 358
environmental and political motivations (0.4±0.7). For the participants who did not have 359
any chronic disease, the major determinants for their food choices were health (0.6±0.6) 360
and also environmental & political concerns (0.6±0.7). Furthermore, the average score 361
for the health motivations among the participants who did not have any chronic disease 362
was higher when compared to those who suffered from chronic diseases, meaning that 363
having a health problem might not be motivating enough to eat healthier. Therefore, it 364
might be due to inappropriate food choices that these diseases arise and progress in these 365
individuals, who are reckless regarding their health. Again there were found significant 366
differences in the food choice motivations of the participants who had chronic diseases 367
and those who had not, with the exception of economic & availability motivations (p = 368
0.438), as well as environmental & political motivations (p = 0.631). According to other 369
studies, having a chronic disease is a factor that may change people’s eating habits and 370
19
prompt them to eat healthier. For example, in the study developed by Ghelfi et al. (Ghelfi 371
et al., 2018), cancer patients and long-term survivors are known to be more sensitive to 372
health-related information and dietary changes. 373
374
Table 7. Motivations by chronic diseases, allergies/intolerances and eating disorders.
375
Type of motivations
Average value for each group1
T-test2 Chronic diseases No chronic diseases p-value Health 0.5±0.5 0.6±0.6 < 0.001 Emotional -0.1±0.7 -0.1±0.7 0.007
Economic and availability 0.1±0.5 0.1±0.5 0.438
Social and cultural 0.0±0.5 0.0±0.5 0.631
Environmental and political 0.4±0.7 0.6±0.7 < 0.001 Marketing and commercial -0.3±0.6 -0.5±0.6 < 0.001
Type of motivations Allergies/intolerances1 T-test2 Allergies/ intolerances No allergies/ intolerances p-value Health 0.5±0.5 0.6±0.5 < 0.001 Emotional -0.1±0.7 -0.1±0.7 0.136
Economic and availability 0.1±0.6 0.1±0.5 0.031
Social and cultural 0.0±0.5 0.0±0.5 0.669
Environmental and political 0.4±0.7 0.6±0.7 < 0.001 Marketing and commercial -0.4±0.6 -0.4±0.7 < 0.001
Type of motivations
Eating disorders1 T-test2
Eating disorders No eating disorders p-value Health 0.4±0.5 0.5±0.5 < 0.001 Emotional 0.2±0.7 -0.1±0.6 < 0.001
Economic and availability 0.2±0.5 0.0±0.5 < 0.001
Social and cultural 0.1±0.5 -0.1±0.5 < 0.001
Environmental and political 0.4±0.6 0.5±0.7 0.112
Marketing and commercial -0.1±0.6 -0.4±0.6 < 0.001
1Scale from -2 (no influence) to +2 (very high influence); The values stand for mean ± standard
376
deviation. 2T-test for independent samples (level of significance 5%).
377 378
20
According to Sommer et al. (2012), approximately 35% of the population modify 379
their diet because of adverse reactions to food. In the present study, not surprisingly, there 380
were found significant differences between the food choices of the participants who had 381
food allergies or intolerances and those who had not, regarding the health motivations (p 382
<0.001), economic & availability motivations (p = 0.031), environmental & political 383
concerns (p <0.001) and marketing & commercial motivations (p <0.001) (Table 7). The 384
results further showed that the food choices of the participants who had food 385
allergies/intolerances were primarily affected by health motivations (0.5±0.5), while the 386
food choices of those who had not were more affected by health (0.6±0.5), as well as 387
environmental & political determinants (0.6±0.7). However, it is important to refer that 388
the food choices of the participants who did not have allergies or food intolerances were 389
affected by health concerns to a higher extent, when compared to those who suffered from 390
them. This is a surprising result and, up to our knowledge, no previous works were found 391
that could explain this, since people with problems motivated by the ingestion of certain 392
types of food should be more careful as to what they eat and the impact on their wel-393
being. 394
Table 7 further shows the participants’ eating motivations according to their eating 395
disorders and, for those who already suffered from an episode of any eating disorder, the 396
main motivations for their food choices were health (0.4±0.5), as well as environmental 397
& political concerns (0.4±0.6), this trend being similar for the participants who never 398
suffered from any eating disorder (health motivations: 0.5±0.5; environmental and 399
political motivations: 0.5±0.7). With the exception of environmental & political 400
motivations, there were found significant differences in the eating motivations of the 401
participants who already had an episode of an eating disorder and those who never had. 402
Moreover, the participants who already had an eating disorder were more influenced by 403
21
emotional motivations (0.2±0.7), when compared to those who never had (-0.1±0.6). 404
These results are in line with previous studies, where it was also found that eating driven 405
by emotional reasons is more common among those who already suffered from an eating 406
disorder (Boggiano et al., 2017). 407
408
4. CONCLUSION
409
In general, regardless the variable analysed, the participants’ food choices were more 410
strongly influenced by health and environmental & political motivations. The 411
participants’ eating motivations varied across countries and while in Portugal and Italy 412
the participants’ food choices were more influenced by environmental & political 413
concerns, in Croatia and Egypt it was health the major determinant and in Greece the 414
participants’ food choices were more influenced by health, as well as environmental & 415
political motivations. These results highlighted the importance that the Mediterranean 416
countries attribute to health and the sustainability of their diets. In addition, it was also 417
possible to perceive that those differences in the eating motivations between countries 418
were statistically significant. 419
Factors such as gender, level of physical activity, dietary regimen, absence of a 420
chronic disease, presence of food allergies or intolerances and the fact that the participants 421
had already experienced an episode of an eating disorder, were proved to influence the 422
participants’ food choices. This research has also shown that women tended to be more 423
influenced by eating motivations than men, with significant differences between genders, 424
and that the participants who practiced physical activity moderately were more concerned 425
about the health and sustainability of their diets than with emotional, social, or even 426
marketing issues. There were also observed significant differences between the 427
participants who adopted a special diet and those who did not, so that the food choices of 428
22
those who followed a specific dietary regimen were more influenced by eating 429
motivations. Moreover, the participants who already suffered from an eating disorder 430
tended to be more influenced by emotional motivations than those who had not, with 431
significant differences between the two groups. The absence of chronic diseases or food 432
intolerances/allergies also showed to have an influence on the participants’ food choices, 433
so that those who did not have any chronic disease or food intolerance/allergy were more 434
influenced by health motivations, when compared to the participants who had them. 435
One of the limitations of this study was the low number of countries included in the 436
study as a sample of the Mediterranean Countries, which are far more. Five was the 437
possible number of countries, even though more countries were invited but chose not to 438
participate in the study. One other limitation was the representability in each of the 439
participating countries, which was not equalitarian in terms of the stratified groups of the 440
population. Also, the number of responses obtained in each of the countries was highly 441
variable, and not proportional to the country size. 442
The results of this study are very important, because they pointed the complexity that 443
is involved in people’s food choices and highlighted different factors that influence those 444
choices. These findings are fundamental to the development of policies and strategies that 445
encourage people to adopt healthier dietary patterns. These actions could be implemented 446
at national levels or even in the ambit of multinational policies aimed to diminish the 447
burden of chronic diseases. 448
Although this work highlights some trends that characterize the general factors 449
influencing the food choices around the Mediterranean, further research is necessary, and 450
in the ambit of the ongoing project some similar studies are being undertaken in other 451
countries, all around Europe and also in America and African countries. 452
23
5. Acknowledgment
454
This work was prepared in the ambit of the multinational project EATMOT from 455
CI&DETS Research Centre (IPV - Viseu, Portugal) with reference 456
PROJ/CI&DETS/CGD/0012, co-financed by Caixa Geral de Depósitos. 457
458
6. References
459
Barauskaite, D., Gineikiene, J., Fennis, B.M., Auruskeviciene, V., Yamaguchi, M. and 460
Kondo, N. (2018), “Eating healthy to impress: How conspicuous consumption, 461
perceived self-control motivation, and descriptive normative influence determine 462
functional food choices”, Appetite, Vol. 131, pp. 59–67. 463
Barrea, L., Muscogiuri, G., Di Somma, C., Tramontano, G., De Luca, V., Illario, M., 464
Colao, A., et al. (2018), “Association between Mediterranean diet and hand grip 465
strength in older adult women”, Clinical Nutrition, available 466
at:https://doi.org/10.1016/j.clnu.2018.03.012. 467
Birkenhead, K.L. and Slater, G. (2015), “A Review of Factors Influencing Athletes’ Food 468
Choices”, Sports Medicine, Vol. 45 No. 11, pp. 1511–1522. 469
Boccardi, V., Calvani, R., Limongi, F., Marseglia, A., Mason, A., Noale, M., Rogoli, D., 470
et al. (2018), “Consensus paper on the ‘executive summary of the international 471
conference on Mediterranean diet and health: a lifelong approach’ an Italian 472
initiative supported by the Mediterranean Diet Foundation and the Menarini 473
Foundation”, Nutrition, Vol. 51–52, pp. 38–45. 474
Boggiano, M.M., Wenger, L.E., Burgess, E.E., Tatum, M.M., Sylvester, M.D., Morgan, 475
P.R. and Morse, K.E. (2017), “Eating tasty foods to cope, enhance reward, 476
24
socialize or conform: What other psychological characteristics describe each of 477
these motives?”, Journal of Health Psychology, Vol. 22 No. 3, pp. 280–289. 478
Braha, K., Cupák, A., Pokrivčák, J., Qineti, A. and Rizov, M. (2017), “Economic analysis 479
of the link between diet quality and health: Evidence from Kosovo”, Economics 480
& Human Biology, Vol. 27, pp. 261–274. 481
van Buul, V.J., Bolman, C.A.W., Brouns, F.J.P.H. and Lechner, L. (2017), “Back-of-pack 482
information in substitutive food choices: A process-tracking study in participants 483
intending to eat healthy”, Appetite, Vol. 116, pp. 173–183. 484
Castro-Quezada, I., Viñas, B., Serra-Majem, L., Castro-Quezada, I., Román-485
Viñas, B. and Serra-Majem, L. (2014), “The Mediterranean Diet and Nutritional 486
Adequacy: A Review”, Nutrients, Vol. 6 No. 1, pp. 231–248. 487
Coelho, M.S., Fernandes, S.S. and Salas-Mellado, M. de las M. (2019), “Chapter 9 - 488
Association Between Diet, Health, and the Presence of Bioactive Compounds in 489
Foods”, in Campos, M.R.S. (Ed.), Bioactive Compounds, Woodhead Publishing, 490
pp. 159–183. 491
Dohrmann, D.D., Putnik, P., Kovačević, D.B., Simal-Gandara, J., Lorenzo, J.M. and 492
Barba, F.J. (2018), “Japanese, Mediterranean and Argentinean diets and their 493
potential roles in neurodegenerative diseases”, Food Research International, 494
available at:https://doi.org/10.1016/j.foodres.2018.10.090. 495
Ferrão, A.C., Guiné, R.P.F., Correia, P., Ferreira, M., Cardoso, A.P., Duarte, J. and Lima, 496
J. (2018), “Perceptions towards a healthy diet among a sample of university 497
people in Portugal”, Nutrition & Food Science, Vol. 48 No. 4, pp. 669–688. 498
25
Ferrão, A.C., Guine, R.P.F., Correia, P.M.R., Ferreira, M. and Lima, J.D. and J. (2019), 499
“Development of A Questionnaire To Assess People’s Food Choices 500
Determinants”, Current Nutrition & Food Science, Vol. (in press), available at: 501
http://www.eurekaselect.com/157301/article (accessed 19 November 2018). 502
Germov, J. and Williams, L. (2017), “Dieting Women - Self-Surveillance and the Body 503
Panopticon”, in Sobal, J. (Ed.), Weighty Issues - Fatness and Thinness as Social 504
Problems, Routledge, p. 16. 505
Ghelfi, F., Tieri, M., Gori, S., Nicolis, F., Petrella, M.C., Filiberti, A., Apolone, G., et al. 506
(2018), “Do cancer patients change their diet in the e-health information era? A 507
review of the literature and a survey as a proposal for the Italian population”, Food 508
Research International, Vol. 104, pp. 59–68. 509
Grosso, G., Mistretta, A., Frigiola, A., Gruttadauria, S., Biondi, A., Basile, F., Vitaglione, 510
P., et al. (2014), “Mediterranean diet and cardiovascular risk factors: a systematic 511
review.”, Critical Reviews in Food Science and Nutrition, Vol. 54 No. 5, pp. 593– 512
610. 513
Guallar-Castillón, P., Rodríguez-Artalejo, F., Tormo, M.J., Sánchez, M.J., Rodríguez, L., 514
Quirós, J.R., Navarro, C., et al. (2012), “Major dietary patterns and risk of 515
coronary heart disease in middle-aged persons from a Mediterranean country: The 516
EPIC-Spain cohort study”, Nutrition, Metabolism and Cardiovascular Diseases, 517
Vol. 22 No. 3, pp. 192–199. 518
Hoefkens, C., Verbeke, W. and Van Camp, J. (2011), “European consumers’ perceived 519
importance of qualifying and disqualifying nutrients in food choices”, Food 520
Quality and Preference, Vol. 22 No. 6, pp. 550–558. 521
26
Hoek, A.C., Pearson, D., James, S.W., Lawrence, M.A. and Friel, S. (2017), “Shrinking 522
the food-print: A qualitative study into consumer perceptions, experiences and 523
attitudes towards healthy and environmentally friendly food behaviours”, 524
Appetite, Vol. 108 No. 1, pp. 117–131. 525
Hoffman, R. and Gerber, M. (2013), The Mediterranean Diet: Health and Science, John 526
Wiley & Sons. 527
Johansen, S.B., Næs, T. and Hersleth, M. (2011), “Motivation for choice and healthiness 528
perception of calorie-reduced dairy products. A cross-cultural study”, Appetite, 529
Vol. 56 No. 1, pp. 15–24. 530
Kaya, I.H. (2016), “Motivation Factors of Consumers’ Food Choice”, Food and Nutrition 531
Sciences, Vol. 07, p. 149. 532
Köster, E.P. (2009), “Diversity in the determinants of food choice: A psychological 533
perspective”, Food Quality and Preference, Vol. 20 No. 2, pp. 70–82. 534
Landström, E., Hursti, U.-K.K. and Magnusson, M. (2009), “‘Functional foods 535
compensate for an unhealthy lifestyle’. Some Swedish consumers’ impressions 536
and perceived need of functional foods”, Appetite, Vol. 53 No. 1, pp. 34–43. 537
Lavallee, K., Zhang, X.C., Michelak, J., Schneider, S. and Margraf, J. (2019), “Vegetarian 538
diet and mental health: Cross-sectional and longitudinal analyses in culturally 539
diverse samples”, Journal of Affective Disorders, available 540
at:https://doi.org/10.1016/j.jad.2019.01.035. 541
Leng, G., Adan, R.A.H., Belot, M., Brunstrom, J.M., Graaf, K. de, Dickson, S.L., Hare, 542
T., et al. (2017), “The determinants of food choice”, Proceedings of the Nutrition 543
Society, Vol. 76 No. 3, pp. 316–327. 544
27
Likert, R. (1932), “A technique for the measurement of attitudes”, Archives of 545
Psychology, Vol. 22 140, p. 55. 546
Loprinzi, P.D., Smit, E. and Mahoney, S. (2014), “Physical Activity and Dietary Behavior 547
in US Adults and Their Combined Influence on Health”, Mayo Clinic 548
Proceedings, Vol. 89 No. 2, pp. 190–198. 549
Mai, R. and Hoffmann, S. (2014), “How to Combat the Unhealthy = Tasty Intuition: The 550
Influencing Role of Health Consciousness”, Journal of Public Policy & 551
Marketing, Vol. 34 No. 1, pp. 63–83. 552
Markovina, J., Stewart-Knox, B.J., Rankin, A., Gibney, M., de Almeida, M.D.V., Fischer, 553
A., Kuznesof, S.A., et al. (2015), “Food4Me study: Validity and reliability of 554
Food Choice Questionnaire in 9 European countries”, Food Quality and 555
Preference, Vol. 45, pp. 26–32. 556
Murray, S.B., Nagata, J.M., Griffiths, S., Calzo, J.P., Brown, T.A., Mitchison, D., 557
Blashill, A.J., et al. (2017), “The enigma of male eating disorders: A critical 558
review and synthesis”, Clinical Psychology Review, Vol. 57, pp. 1–11. 559
Naughton, P., McCarthy, S.N. and McCarthy, M.B. (2015), “The creation of a healthy 560
eating motivation score and its association with food choice and physical activity 561
in a cross sectional sample of Irish adults”, The International Journal of 562
Behavioral Nutrition and Physical Activity, Vol. 12, available 563
at:https://doi.org/10.1186/s12966-015-0234-0. 564
Ndlovu, T., van Jaarsveld, F. and Caleb, O.J. (2018), “French and Mediterranean-style 565
diets: Contradictions, misconceptions and scientific facts-A review”, Food 566
28
Research International, available
567
at:https://doi.org/10.1016/j.foodres.2018.09.020. 568
Organ, K., Koenig-Lewis, N., Palmer, A. and Probert, J. (2015), “Festivals as agents for 569
behaviour change: A study of food festival engagement and subsequent food 570
choices”, Tourism Management, Vol. 48, pp. 84–99. 571
Ostan, R., Lanzarini, C., Pini, E., Scurti, M., Vianello, D., Bertarelli, C., Fabbri, C., et al. 572
(2015), “Inflammaging and cancer: a challenge for the Mediterranean diet”, 573
Nutrients, Vol. 7 No. 4, pp. 2589–2621. 574
Park, S.-Y., Murphy, S.P., Wilkens, L.R., Yamamoto, J.F., Sharma, S., Hankin, J.H., 575
Henderson, B.E., et al. (2005), “Dietary patterns using the Food Guide Pyramid 576
groups are associated with sociodemographic and lifestyle factors: the multiethnic 577
cohort study”, The Journal of Nutrition, Vol. 135 No. 4, pp. 843–849. 578
Pelly, F.E., Burkhart, S.J. and Dunn, P. (2018), “Factors influencing food choice of 579
athletes at international competition events”, Appetite, Vol. 121, pp. 173–178. 580
Renzella, J., Townsend, N., Jewell, J., Breda, J., Roberts, N., Rayner, M. and 581
Wickramasinghe, K. (2018), What National and Subnational Interventions and 582
Policies Based on Mediterranean and Nordic Diets Are Recommended or 583
Implemented in the WHO European Region, and Is There Evidence of 584
Effectiveness in Reducing Noncommunicable Diseases?, WHO Regional Office 585
for Europe, Copenhagen, available at:
586
http://europepmc.org/abstract/med/30091868 (accessed 23 October 2018). 587
Rozin, P. (2007), “How does culture affect choice of foods?”, Consumer-Led Food 588
Product Development, pp. 66–80. 589
29
Satija, A. and Hu, F.B. (2018), “Plant-based diets and cardiovascular health”, Trends in 590
Cardiovascular Medicine, Vol. 28 No. 7, pp. 437–441. 591
Schwingshackl, L., Bogensberger, B. and Hoffmann, G. (2018), “Diet Quality as 592
Assessed by the Healthy Eating Index, Alternate Healthy Eating Index, Dietary 593
Approaches to Stop Hypertension Score, and Health Outcomes: An Updated 594
Systematic Review and Meta-Analysis of Cohort Studies”, Journal of the 595
Academy of Nutrition and Dietetics, Vol. 118 No. 1, pp. 74-100.e11. 596
Schwingshackl, L. and Hoffmann, G. (2015), “Adherence to Mediterranean diet and risk 597
of cancer: an updated systematic review and meta-analysis of observational 598
studies.”, Cancer Medicine, Vol. 4 No. 12, pp. 1933–1947. 599
Serra-Majem, L., Ortiz-Andrellucchi, A. and Sánchez-Villegas, A. (2019), 600
“Mediterranean Diet”, in Ferranti, P., Berry, E.M. and Anderson, J.R. (Eds.), 601
Encyclopedia of Food Security and Sustainability, Elsevier, Oxford, pp. 292–301. 602
Siegrist, M., Shi, J., Giusto, A. and Hartmann, C. (2015), “Worlds apart. Consumer 603
acceptance of functional foods and beverages in Germany and China”, Appetite, 604
Vol. 92, pp. 87–93. 605
Singh, H. (2016), “Nanotechnology Applications in Functional Foods; Opportunities and 606
Challenges”, Preventive Nutrition and Food Science, Vol. 21 No. 1, pp. 1–8. 607
Sommer, I., Mackenzie, H., Venter, C. and Dean, T. (2012), “Factors influencing food 608
choices of food-allergic consumers: findings from focus groups”, Allergy, Vol. 67 609
No. 10, pp. 1319–1322. 610
30
Stasi, A., Songa, G., Mauri, M., Ciceri, A., Diotallevi, F., Nardone, G. and Russo, V. 611
(2018), “Neuromarketing empirical approaches and food choice: A systematic 612
review”, Food Research International, Vol. 108, pp. 650–664. 613
Thodis, A., Itsiopoulos, C., Kouris‐Blazos, A., Brazionis, L., Tyrovolas, S., 614
Polychronopoulos, E. and Panagiotakos, D.B. (2018), “Observational study of 615
adherence to a traditional Mediterranean diet, sociocultural characteristics and 616
cardiovascular disease risk factors of older Greek Australians from 617
MEDiterranean ISlands (MEDIS-Australia Study): Protocol and rationale”, 618
Nutrition & Dietetics, Vol. 75 No. 1, pp. 44–51. 619
Trichopoulou, A., Costacou, T., Bamia, C. and Trichopoulos, D. (2003), “Adherence to 620
a Mediterranean diet and survival in a Greek population”, The New England 621
Journal of Medicine, Vol. 348 No. 26, pp. 2599–2608. 622
World health Organization. (2006), “Global Database on Body Mass Index”, available at: 623
http://apps.who.int/bmi/index.jsp?introPage=intro_3.html (accessed 26 July 624
2017). 625
World Health Organization. (2018a), “Healthy diet”, World Health Organization, 626
available at: http://www.who.int/news-room/fact-sheets/detail/healthy-diet 627
(accessed 29 October 2018). 628
World Health Organization. (2018b), “Physical activity”, World Health Organization, 629
available at: http://www.who.int/news-room/fact-sheets/detail/physical-activity 630
(accessed 7 November 2018). 631
31
Yu, E., Malik, V.S. and Hu, F.B. (2018), “Reprint of: Cardiovascular Disease Prevention 632
by Diet Modification: JACC Health Promotion Series”, Journal of the American 633
College of Cardiology, Vol. 72 No. 23, Part B, pp. 2951–2963. 634
635 636