Beatriz Isabel Manso de Matos
[Nome completo do autor]
[Nome completo do autor]
[Nome completo do autor]
[Nome completo do autor]
[Nome completo do autor]
[Nome completo do autor]
[Nome completo do autor]
Licenciada em Bioquímica
[Habilitações Académicas]
[Habilitações Académicas]
[Habilitações Académicas]
[Habilitações Académicas]
[Habilitações Académicas]
[Habilitações Académicas]
[Habilitações Académicas]
Setembro, 2019
Study of Quantum Dots (CdS, ZnS) toxicity in Danio
rerio, Daphnia magna and HepG2 cell line.
[Título da Tese]
Dissertação para obtenção do Grau de Mestre em
Bioquímica
Dissertação para obtenção do Grau de Mestre em
[Engenharia Informática]
Orientador: Professor Doutor Mário Sousa Diniz
BioTox Lab, Departamento de Química, Faculdade de Ciências e Tecnologia da Universidade Nova de Lisboa
Co-orientadora: Professora Doutora Marta Martins
MARLab, Departamento de Ciências e Engenharia do Ambiente (DCEA), Faculdade de Ciências e Tecnologia da Universidade NOVA de Lisboa
III
S tu d y of Q u ant u m Do ts (Cd S , Zn S ) t o xi city in Dani o r er io and Daph n ia mag n a , Daph n ia mag n a and H epG 2 c el l li n eB
ea
tri
z
M
a
tos
2019
9
V
Beatriz Isabel Manso de Matos
Licenciada em Bioquímica
Study of Quantum Dots (CdS, ZnS) toxicity in Danio
rerio, Daphnia magna and HepG2 cell line
Dissertação para obtenção do Grau de Mestre em
Bioquímica
Orientador: Prof. Doutor Mário Diniz
Co-orientadora: Profª Doutora Marta Martins
VII
Study of Quantum Dots (CdS, ZnS) toxicity in Danio rerio, Daphnia magna and
HepG2 cell line
Copyright ©
Beatriz Isabel Manso de Matos Faculdade de Ciências e Tecnologia Universidade Nova de Lisboa
A Faculdade de Ciências e Tecnologia e a Universidade Nova de Lisboa têm o direito, perpétuo e sem limites geográficos, de arquivar e publicar esta dissertação através de exemplares impressos reproduzidos em papel ou de forma digital, ou por qualquer outro meio conhecido ou que venha a ser inventado, e de a divulgar através de repositórios científicos e de admitir a sua cópia e distribuição com objetivos educacionais ou de investigação, não comerciais, desde que seja dado crédito ao autor e editor
.
IX
“Why it's simply impassible!
Alice: Why, don't you mean impossible?
Door: No, I do mean impassible. (chuckles) Nothing's impossible!”
Lewis Carroll
XI
AGRADECIMENTOS
A minha passagem pela FCT tem sido muito rápida, mas também muito feliz. Rápida porque olho para trás e parece que foi há uns dias que aqui cheguei, e feliz porque sinto que tive a sorte de ao longo do meu percurso terem surgido as pessoas e as oportunidades certas.
Este último ano não foi exceção, passou a voar e esteve repleto de obstáculos mas sobretudo de oportunidades.
No final de mais esta etapa quero começar por agradecer ao meu orientador, Professor Doutor Mário Diniz, pela oportunidade e pela confiança que depositou em mim ainda antes de ter iniciado a minha tese. Quero agradecer-lhe pela paciência, disponibilidade e sobretudo pelo trabalho incansável dos últimos tempos e também por me ter ajudado a crescer como profissional e como pessoa. Muito obrigada!
Depois agradecer à minha co-orientadora, Professora Doutora Marta Martins, pela grande oportunidade de me poder juntar à equipa do MarLab, e principalmente por toda a compreensão para com as minhas ausências enquanto terminava este trabalho! Muito obrigada por toda a ajuda, paciência, motivação e amizade ao longo destes meses.
Agradeço também a toda a equipa do MArLab, por me terem acolhido tão bem e estarem sempre dispostos a ajudar. Um agradecimento especial à Neusa, por tudo o que me ensinou e por ter sido tão flexível comigo na altura de terminar a minha tese.
Quero agradecer também à amiga de laboratório, Mariana, pelos bons tempos que passámos, pela companhia e por nos termos sempre ajudado mutuamente!
Obrigada a vocês, Mãe e Pai, por terem tornado tudo isto possível, por me terem deixado voar até à Caparica e pelo apoio incondicional. Desculpem as idas a casa que ficaram em falta e algumas falhas que possa ter cometido convosco durante este percurso. Nos próximos tempos vou continuar por aqui, mas o meu coração vai estar sempre aí!
Quero agradecer aos “Fixes”, por terem lá estado desde sempre, por me terem ajudado nas várias fases da minha vida e principalmente por darem verdadeiro significado à palavra casa! À Leonor e à Madalena por despertarem a criança que há em mim e não a deixarem desaparecer! Obrigada a ti Bia, por me teres ensinado que há amigos que são família e te teres tornado numa irmã.
Obrigada Inês, Daniela, Bárbara, Gonçalo, Sequeira e Paquete pela vossa amizade, pelo apoio e companhia e por terem contribuído para que eu me sentisse sempre em casa.
Por fim, quero agradecer aos meus amigos de casa, em especial à Carla e à Inês, porque apesar de termos seguido rumos diferentes, continua tudo igual.
XIII
ABSTRACT
The increasing use of nanoparticles in recent decades led to a growing concern about the possible consequences for the environment.
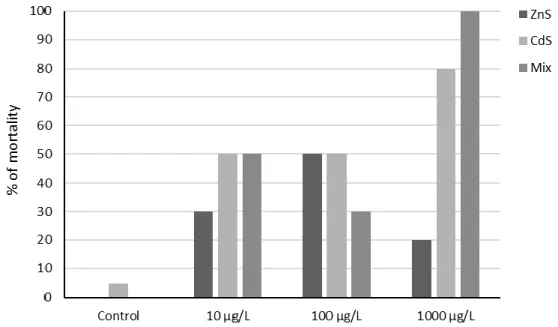
The present study aims to evaluate the toxicity of the Quantum Dots (QDs) (ZnS and CdS), using Danio rerio, Daphnia magna and HepG2 cell line. Both organisms were exposed to different concentrations of QDs (10, 100 and 1000 µg/L), singly and combined, to assess toxicity. Several biochemical analyses were performed: antioxidant enzymes (Catalase, Glutathione-S-transferase and Superoxide Dismutase), total antioxidant capacity (TAC), ubiquitin, heat shock proteins (HSPs) and lipid peroxidation (MDA content). An HepG2 cell line was also exposed to the same QDs concentrations, and cell viability was assessed. QDs were characterized by Scanning Electron Microscopy (SEM), Transmission Electron Microscopy (TEM) and Dynamic light scattering (DLS). The results from exposure assays showed that the concentrations of QDs tested did not cause mortality in fish but resulted in high mortality rates in Daphnia magna exposed to higher QDs concentrations (100 and 1000 µg/L). Regarding HepG2 assay, QDs were not able to cause significant cytotoxicity. Overall, the results from fish and Daphnids assays showed sub-lethal effects following exposure to the different concentrations of QDs. D. rerio exposure assays showed increased levels of antioxidant enzymes, HSP70 and Ubiquitin in fish exposed to 100 µg/L QDs (ZnS). D. magna exposure assays revealed decreased levels of antioxidant enzymes and increased levels of Ubiquitin according to QDs concentrations tested.
Was investigated the trophic transfer of QDs from D. magna (previously exposed to QDs) to
D. rerio. The results from Inductively coupled plasma atomic emission spectroscopy (ICP-AES) analysis indicate that the QDs (and/or their ions released into the aqueous medium) were ingested by Daphnia and then transferred to fish via ingestion as well.
XV
RESUMO
O crescente uso de nanopartículas nas últimas décadas levou a uma crescente preocupação com as possíveis consequências para o meio ambiente.
O presente estudo tem como objetivo avaliar a toxicidade de Quantum Dots (QDs) (ZnS e CdS), utilizando Danio rerio, Daphnia magna e linha celular HepG2. Os organismos foram expostos a diferentes concentrações de QDs (10, 100 e 1000 µg/L), isoladamente e combinados, para avaliar a toxicidade.Diversas análises bioquímicas foram realizadas: enzimas antioxidantes (catalase, glutationa-S-transferase e superóxido dismutase), capacidade antioxidante total (TAC), ubiquitina, proteínas de choque térmico (HSPs) e peroxidação lipídica (conteúdo de MDA). A linha celular HepG2 também foi exposta às mesmas concentrações de QDs para avaliar a viabilidade celular.Os QDs foram caracterizados por Microscopia Eletrónica de Varrimento (SEM), Microscopia Eletrónica de Transmissão (TEM) e dispersão dinâmica de luz (DLS). Os resultados dos ensaios de exposição revelaram que as concentrações de QDs testadas não causaram mortalidade nos peixes, mas resultaram em taxas de mortalidade elevadas em
Daphnia magna expostas a concentrações maiores de QDs (100 e 1000 µg/L).Em relação ao ensaio HepG2, os QDs não causaram citotoxicidade significativa. No geral, os resultados dos ensaios com peixes e dáfnias indicaram efeitos sub-letais após a exposição às diferentes concentrações de QDs. Os ensaios de exposição a D. rerio revelaram níveis aumentados de enzimas antioxidantes, HSP70 e Ubiquitina em peixes expostos a 100 µg/L de QDs (ZnS). Os ensaios de exposição à D. magna revelaram níveis diminuídos de enzimas antioxidantes e níveis aumentados de Ubiquitina de acordo com as concentrações de QDs testadas
Foi também investigada a transferência trófica de QDs de D. magna (previamente expostas a QDs) para D. rerio. Os resultados da análise de espectrometria de emissão atômica por plasma acoplado indutivamente (ICP-AES) indicam que os QDs (e / ou iões libertados no meio aquoso) foram ingeridos por dáfinas e depois transferidos para peixes por ingestão.
Palavras-chave:
Quantum Dots; Danio rerio; Daphnia magna; HepG2; Stress oxidative; ToxicidadeXVII
INDEX
AGRADECIMENTOS ... XI ABSTRACT ... XIII RESUMO ... XV INDEX ... XVII INDEX OF FIGURES ... XXI INDEX OF TABLES ... XXIII ABREVIATIONS ... XXV1 Introduction ... 3
1.1 Nanotechnology ... 4
Nanomaterials ... 4
Quantum Dots ... 5
Quantum Dots Characterization ... 6
Nanotoxicology ... 7
1.2 Biological Models... 8
Zebrafish (Danio rerio)... 8
Daphnia magna ... 9
Human hepatoma cell lines (HepG2) ... 10
1.3 Toxicity Assays ... 12
Catalase ... 13
Glutathione-S-Transferase (GST) ... 14
Heat Shock Proteins (HSPs) ... 14
Lipid Peroxidation ... 15
Superoxide Dismutase (SOD) ... 15
Ubiquitin ... 15
Cell viability assay – MTT ... 16
2 Objectives ... 19
3 Experimental Procedure ... 23
3.1 Quantum Dots (QDs) synthesis ... 23
3.2 Preparation of QDs stock solutions ... 23
3.3 Quantum dots (QDs) characterization ... 23
Scanning electron microscopy (SEM) ... 23
Transmission electron microscopy (TEM) ... 24
Dynamic light scattering (DLS) ... 24
3.4 In vivo assays ... 25
Test Organisms ... 25
Acclimation ... 25
XVIII
Bioassay 1: Exposure of Danio rerio to QDs (ZnS, CdS), singly and combined ... 26
Bioassay 2: Exposure of Daphnia magna to QDs (ZnS and CdS), singly and combined . 27 Bioassay 3: Trophic transfer of QDs: Danio rerio ingestion of exposed Daphna magna to QDs (ZnS and CdS) singly and combined ... 28
Samples collection and processing ... 30
3.4.4.1 Danio rerio ... 30
3.4.4.2 Daphnia magna ... 30
Bradford Assay ... 30
Catalase assay ... 31
Glutathione-S-transferase assay ... 31
Heat Shock Protein (HSP) assay ... 32
Lipid Peroxidation assay... 33
Superoxide Dismutase assay ... 33
Total Antioxidant Capacity (TAC) assay ... 34
Ubiquitin assay ... 34
3.5 In vitro assays ... 36
Culture of HepG2 cells ... 36
Cell viability assay ... 36
3.6 Inductively coupled plasma mass spectrometry (ICP-AES) analysis ... 37
3.7 . Statistical Analysis ... 37
4 Results ... 41
4.1 Quantum Dots Characterization ... 41
TEM analysis ... 41
SEM analysis ... 42
DLS analyses ... 43
ICP analyses ... 43
4.2 Mortality rate and physical and chemical parameters ... 45
4.3 Bioassay 1: Exposure of Danio rerio to QDs (ZnS and CdS), singly and combined . 46 Antioxidant Enzyme Activities ... 46
4.3.1.1 Catalase (CAT) ... 46
4.3.1.2 Glutathione-S-Transferase (GST) ... 47
4.3.1.3 Superoxide Dismutase (SOD) ... 48
4.3.2 Lipid Peroxidation (LPO) ... 49
Total Antioxidant Capacity (TAC) ... 50
HSP70 ... 51
Ubiquitin ... 52
4.4 Bioassay 2: Exposure of Daphnia magna to QDs (ZnS and CdS), singly and combined ... 53
Antioxidant enzymes ... 53
4.4.1.1 Catalase (CAT) ... 53
XIX
4.4.1.3 Superoxide Dismutase (SOD) ... 55
Lipid Peroxidation (LPO) ... 56
Total Antioxidant Capacity (TAC) ... 57
Ubiquitin ... 58
4.5 Bioassay 3: Trophic transfer of QDs assay: Danio rerio ingestion of Daphnia magna exposed to QDs (singly and combined) ... 59
Daphnia magna ... 59
4.5.1.1 Antioxidant Enzymes activities, Lipid peroxidation, Total antioxidant capacity and Ubiquitin content ... 59
Danio rerio ... 61
4.5.2.1 Antioxidant Enzyme Activities ... 61
4.5.2.1.1 Catalase (CAT) ... 61
4.5.2.1.2 Glutathione-S-Transferase (GST) ... 62
4.5.2.1.3 Superoxide Dismutase (SOD) ... 63
4.5.2.2 Lipid Peroxidation (LPO) ... 64
4.5.2.3 Total Antioxidant Capacity (TAC) ... 65
4.5.2.4 HSP70 ... 66 4.5.2.5 Ubiquitin ... 67 4.6 Cell Viability ... 68 5 Discussion ... 71 6 Conclusions ... 81 7 References ... 83 8 ANNEXES ... 89
XXI
INDEX OF FIGURES
Figure 1.1 - Structure of a quantum dot. ... 5
Figure 1.2 Adult zebrafish (Danio rerio). ... 9
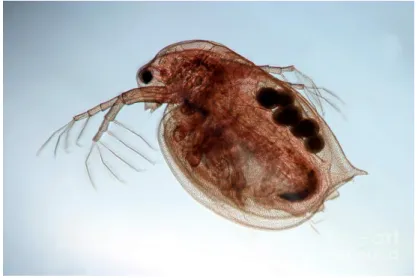
Figure 1.3 Dapnhia magna. ... 10
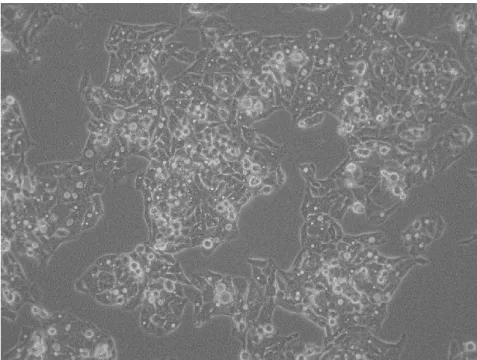
Figure 1.4 Representative image of Human hepatoma cells (HepG2). Image acquired using a inverted phase contrast microscope (Olympus, Japan) Magnification: 100x magnification. ... 11
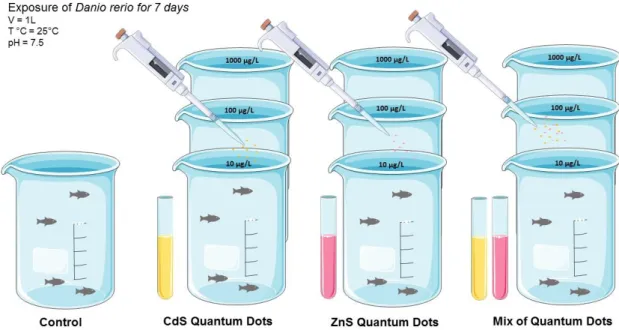
Figure 3.1 Schematic representation of Bioassay 1. ... 26
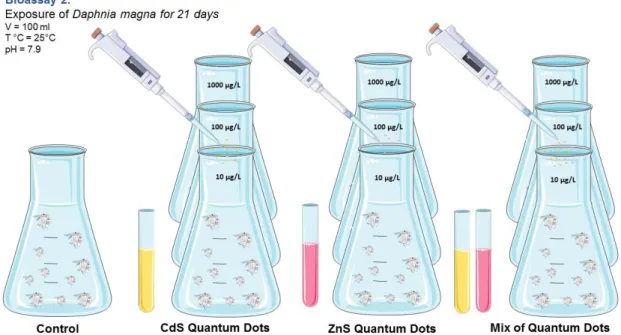
Figure 3.2 Schematic representation of Bioassay 2. ... 27
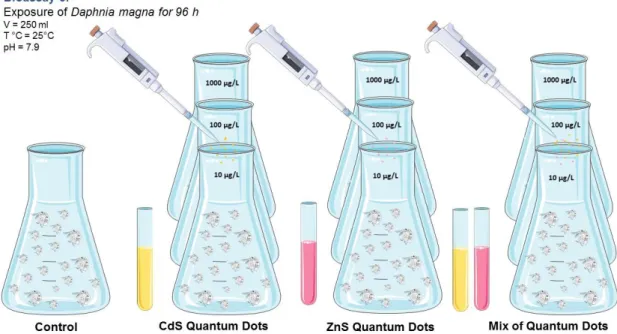
Figure 3.3 Schematic representation of bioassay 3: Exposure of D. magna for 96h. ... 28
Figure 3.4 Schematic representation of bioassay 3: Exposure of D. rerio for 48h ... 29
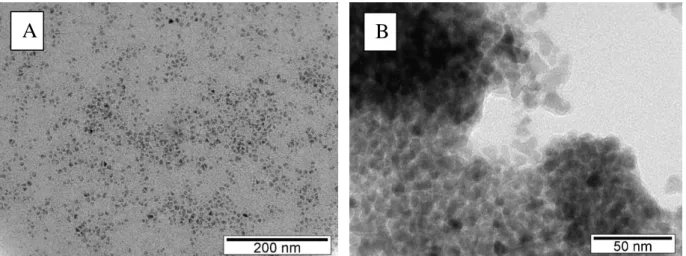
Figure 4.1 Representative TEM images of the tested QDs. Legend: A – ZnS (8 – 12 nm); B – CdS (6 – 10 nm). Note: characterization and images were performed by the researcher David Sousa from CENIMAT. ... 41
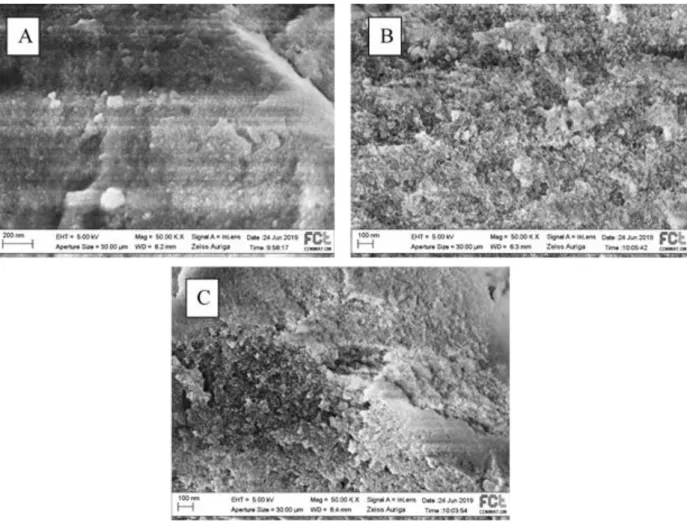
Figure 4.2 Representative SEM images of the QDs tested. Legend: A: ZnS; B : CdS.; C : Mixed QDs. ... 42
Figure 4.3 Mortality rate of D. magna for the bioassay 2. ... 45
Figure 4.4 CAT activity (mean ± SD) determined in D. rerio exposed to the different QDs concentrations, singly and combined. The experiment was performed in duplicate. Asterisk means significant differences (p<0.05) in comparison to the respective controls... 46
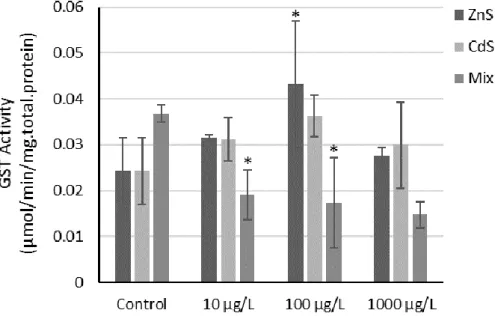
Figure 4.5 GST activity (mean ± SD) determined in D. rerio exposed to the different QDs concentrations, singly and combined. The experiment was performed in duplicate. Asterisk means significant differences (p<0.05) in comparison to controls. ... 47
Figure 4.6 SOD (% inhibition/mg.total.protein) (mean ± SD) determined in D. rerio exposed to the different QDs concentrations, singly and combined. The experiment was performed in duplicate. ... 48
Figure 4.7 MDA concentration determined in D. rerio (mean ± SD) exposed to the different QDs concentrations, singly and combined. The experiment was performed in duplicate. Asterisk means significant differences (p<0.05) in comparison to the respective controls... 49
Figure 4.8 TAC mean ± SD) determined in D. rerio exposed to the different QDs concentrations, singly and combined. The experiment was performed in duplicate. ... 50
Figure 4.9 HSP70 concentrations (mean ± SD) determined in D. rerio exposed to the different QDs concentrations. The experiment was performed in duplicate. Asterisk means significant differences (p<0.05) in comparison to the respective controls... 51
Figure 4.10 Ubiquitin concentrations (mean ± SD) in D. rerio exposed to the different concentrations of QDs, singly and combined. The experiment was performed in duplicate. Asterisk means significant differences (p<0.05) in comparison to the respective controls. ... 52
Figure 4.11 CAT activity (mean ± SD) in D. magna exposed to the different QDs concentrations. The experiment was performed in duplicate. Absence of bars means 100% of mortality rate. Absence of standard deviation means just one individual analysed. ... 53
Figure 4.12 GST activity (mean ± SD) in D. magna exposed to the different QDs Asterisk means significant differences (p<0.05) in comparison to the respective controls. The experiment was performed in duplicate. Absence of bars means 100% of mortality rate. Absence of standard deviation means just one individual analysed. ... 54
Figure 4.13 SOD mean ± SD) expressed as (%) inhibition/mg.total.protein in D. magna (exposed to the different QDs concentrations. The experiment was performed in duplicate. Asterisk means significant differences (p<0.05) in comparison to the respective controls. Absence of bars means 100% of mortality rate. Absence of standard deviation means just one individual analysed. ... 55
Figure 4.14 MDA concentrations (mean ± SD) in D. magna exposed to the different QDs concentrations. The experiment was performed in duplicate. Absence of bars means 100% of mortality rate. Absence of standard deviation means just one individual analysed. ... 56
Figure 4.15 TAC concentrations (mean ± SD) determined D. magna exposed to the different QDs concentrations. The experiment was performed in duplicate. Absence of bars means 100% of mortality rate. Absence of standard deviation means the presence of just one individual. .... 57
XXII
Figure 4.16 Ubiquitin concentrations (mean ± SD) determined in D. magna exposed to the
different QDs concentrations. The experiment was performed in duplicate. Absence of bars means 100% of mortality rate. Absence of standard deviation means just one individual
analysed. ... 58
Figure 4.17 CAT activity (mean ± SD) in D. rerio that ingested D. magna exposed to the
different concentrations of QDs, singly and combined. The experiment was performed in
duplicate. ... 61
Figure 4.18 GST activity (mean ± SD) in D. rerio that ingested D. magna exposed to the
different QDs concentrations, singly and combined. The experiment was performed in duplicate. ... 62
Figure 4.19 SOD (mean ± SD) express as (%) inhibition/mg.total.protein in D. rerio that
ingested D. magna exposed to the different QDs concentrations, singly and combined. The experiment was performed in duplicate. Asterisk means significant differences (p<0.05) in comparison to the respective controls. ... 63
Figure 4.20 MDA concentration (mean ± SD) measured in D. rerio that ingested D. magna
exposed to the different QDs concentrations, singly and combined. The experiment was
performed in duplicate. ... 64
Figure 4.21 TAC concentrations (mean ± SD) determined in D. rerio that ingested D. magna
exposed to the different QDs concentrations, singly and combined. The experiment was
performed in duplicate. ... 65
Figure 4.22 HSP70 concentration (mean ± SD) determined in D. rerio that ingested D. magna
exposed to the different QDs concentrations, singly and combined. The experiment was
performed in duplicate. ... 66
Figure 4.23 Ubiquitin concentration (mean ± SD) determined in D. rerio that ingested D. magna
exposed to the different QDs concentrations. The experiment was performed in duplicate. Asterisk means significant differences (p<0.05) in comparison to the respective controls. ... 67
Figure 4.24 Cell viability (% of control) measured by the MTT assay on HepG2 cells exposed
to 10, 100, 100 µg/L of Quantum Dots (A- ZnS, B- CdS, C- Mix) for 24 h and 48 h. An OD value of control cells (unexposed cells) was taken as 100% viability (0% cytotoxicity). Data were reported as mean ± SD of two independent experiments performed in quintuplicate. The relative cell viability related to control was calculated by [OD] test/ [OD] control ×100. ... 68
Figure 8.1 Graphic representation of the results obtained. ZnS_QDs re-dispersed in chloroform
(black). ZnS_QDs re-dispersing in water, with the aid of SDS (surfactant) and methanol (grey). ... 89
Figure 8.2 Graphic representation of the results obtained. CdS_QDs re-dispersed in
chloroform (black). CdS_QDs re-dispersing in water, with the aid of SDS (surfactant) and methanol (grey). ... 89
Figure 8.3 BSA calibration curve to estimate the total protein concentration for further
XXIII
INDEX OF TABLES
Table 4.1 Size determined from TEM observations and colour of QDs. ... 41 Table 4.2 Dynamic Light Scattering (DLS) results for the QDs concentrations tested. *D.Max.
(nm): diameter of QDs with higher frequency on DLS measurement. ... 43
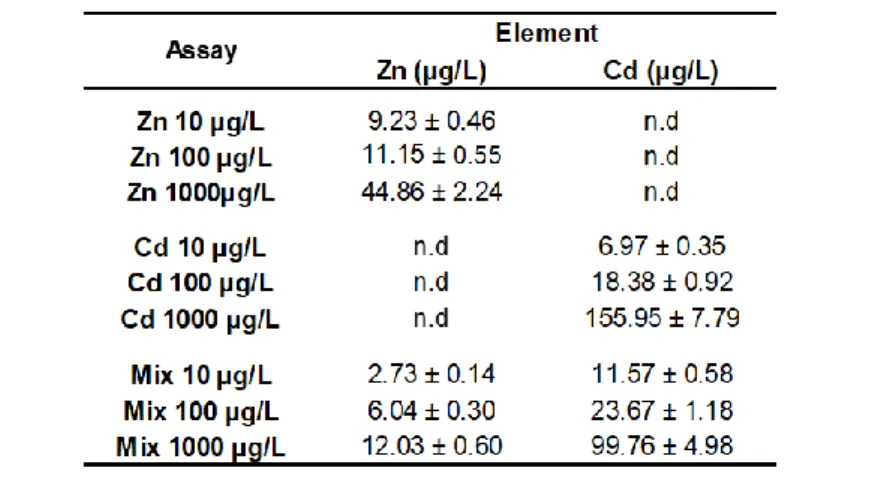
Table 4.3 Results from ICP-AES analysis of QDs (ZnS and CdS) in water samples from
bioassays. ... 43
Table 4.4 Results from ICP-AES analysis of ZnS and CdS (QDs) in tissues from D. rerio that
ingested D. magna exposed to the different concentrations of QDs tested. ... 44
Table 4.5 Antioxidant enzymes activities (CAT, GST, SOD (%inhibition)), Lipid peroxidation
(MDA content), Total Antioxidant Capacity and Ubiquitin (mean ± SD) in D. magna exposed to the different QDs concentrations, singly and combined. * means just one individual analysed. ** means 100% of mortality rate. ... 59
Table 8.1 Biometric data (Weight (g) and size (cm)) of Danio rerio exposed to ZnS QDs
(Bioassay 1). ... 90
Table 8.2 Biometric data (Weight (g) and size (cm)) of Danio rerio exposed to CdS QDs
(Bioassay 1). ... 90
Table 8.3 Biometric data (Weight (g) and size (cm)) of Danio rerio exposed to QDs combined
(Bioassay 1). ... 90
Table 8.4 Biometric data (Weight (g) and size (cm)) of D. rerio that ingested contaminated D.
magna with ZnS QDs (Bioassay 3) ... 90
Table 8.5 Biometric data (Weight (g) and size (cm)) of D. rerio that ingested contaminated D.
magna with CdS QDs (Bioassay 3) ... 90
Table 8.6 Biometric data (Weight (g) and size (cm)) of D. rerio that ingested contaminated D.
XXV
ABREVIATIONS
ABTS
2,2′-Azino-bis (3-ethylbenzothiazoline-6-sulfonic acid)
BSA
Bovine Serum Albumin
CAT
Catalase
CDNB
1-Chloro-2,4-Dinitrobenzene
CdS
Cadmium Sulphide
DLS
Dynamic light scattering
DMEM
Dulbecco's Modified Eagle Medium
DTNB
5,5’-Dithio-bis-2-nitrobenzoic Acid
EDTA
Ethylenediamine Tetraacetic Acid
ELISA
Enzyme-Linked Immunosorbent Assay
FBS
Fetal Bovine Serum
FCS
Fetal Calf Serum
GSH
Reduced Glutathione
GST
Glutathione-S-Transferase
HSP
Heat Shock Protein
ICP
Inductively coupled plasma
LPO
Lipid peroxidation
MDA
Malondialdehyde
MTT
3-[4,5dimethylthiazol-2-yl]-2,5diphenyl tetrazolium bromide
NADPH
Nicotinamide Adenine Dinucleotide Phosphate
NBT
Nitro Blue Tetrazolium
PBS
Phosphate-buffered saline
PNPP
4-Nitrophenyl Phosphate Disodium Salt Hexahydrate
Purpald
4-Amino-3-hydrazino-5mercapto-1,2,4-triazole
QD
Quantum Dot
ROS
Reactive oxygen species
SDS
Sodium Dodecyl Sulphate
SEM
Scanning Electron Microscopy
SOD
Superoxide Dismutase
TAC
Total Antioxidant Capacity
TBA
Thiobarbituric acid
TBARS
Thiobarbituric Acid Reactive Substances
TCA
Trichloroacetic Acid
XXVI
TROLOX
6-Hydroxy-2,5,7,8-tetramethylchroman-2-carboxylic acid
XOD
Xanthine Oxidase
1
Chapter 1
3
1
Introduction
In the last century, the development of technology and industry led to an increase in the human population mostly in large urban areas. This growth resulted in increased pollution, namely aquatic pollution. Sources like atmospheric deposition, wastewater effluents and leaching from soils, contributed to this type of pollution1 . However, one of the most important sources is related
to the use of chemicals that are intentionally or not, released into the environment. Some of these chemicals are heavy metals such as cadmium (Cd) and lead (Pb) 2 or organic compounds (e.g.
PCBs, PAHs, pesticides and herbicides) 3. Thus, the anthropic activities have become a major
threat to aquatic ecosystems, also promoting the degradation of water quality which is a serious ecological problem worldwide. The unknown behaviour and fate of these contaminants are one of the main causes of stress on aquatic ecosystems that are highly vulnerable to external aggression3. Therefore, toxicology studies are fundamental since there are many compounds that
need a toxicity assessment. With the new discoveries in the field of Nanotechnology and the growing use of nanoparticles, it is difficult to avoid exposure to this type of contaminants. In fact, aquatic environments seem to be very vulnerable to nanomaterials due to their ability to mix and disperse in the environment very fast. Moreover, several issues regarding bioavailability, degradability, reactivity and toxicity of nanomaterials are still to understand. In addition, with the global concern about the ecological problem, nanoparticles such as Quantum Dots (QDs) have been the target of several ecotoxicity studies to evaluate if their presence in the ecosystems represents a risk for the biota.
4
1.1 Nanotechnology
Nanotechnology is a new field of science and technology that involves the production and application of new materials operating at a nanoscale range 1,4. A nanoparticle is usually defined
as a type of nanomaterial with at least two dimensions between 1 and 100 nm 5. In the field of
chemistry, this range of sizes is also related with colloids, micelles, polymer molecules, and lately, other structures such as carbon nanotubes, silicon nanorods and QDs-semi-conductors, which have been recently discovered as an interesting class of nanomaterials 6. Furthermore, materials
show a unique behaviour and have different properties when at nanoscale. Some of these properties are their small size, chemical composition, surface structure, solubility and shape, allowing them to be used in many areas such as pharmaceutics, medicine, textile or electronic industries 7.
Nanomaterials
Every year different types of nanomaterials are being discovered for different uses (e.g. drug delivery, cancer diagnosis and therapeutic, optical imaging, antibacterial agents, screens, sunscreen products, textiles, cosmetics, coating, food preservation, and others)4,8 and making
these products more efficient and low-cost. However, the unique properties that make nanomaterials attractive, can also be responsible for adverse effects on organisms (e.g. microorganisms, algae, fish, humans, etc.) 9. Although nanoparticles have always existed in the
environment from natural sources, the anthropogenic sources are becoming an increasing concern.5 For instance, many types of nanoparticles made by natural processes like
photochemical reactions, volcanic eruptions, forest fires, and erosion are present in the environment. 8 These occurrences, even if unintentional, can produce large quantities of materials
which, when dispersed can reach water, soil, and the air compartments where they can stay for long periods of time. If no biodegradation occurs, then they can bioaccumulate in the food chain and be an ecotoxicological hazard. 7
Nanowaste is the term commonly used to refer to the release of nanomaterials into the environment as nanofabrication residues or during their use in biomedical applications, industrial processes, and diverse domestic uses. When nanowastes are released into the environment they can lead to soil pollution and contaminated sludge, water or sediments. An example of nanowaste was the discovery in 2010 of silver nanoparticles (Ag NPs) in wastewater and platinum nanoparticles (Pt NPs) released from automotive exhaust converters. 7,10
A major challenge in the field of nanotechnology is the development of regulatory legislation for the management of environmental and public health implications. Some improvements in this field are the development of instruments for the assessment of contaminated air and water, the development and validation of methods for toxicity evaluation and mathematical models to predict the potential impacts on the environment. 10
5
Figure 1.1 - Structure of a quantum dot.
Source: avsforum. Quantum Dot Structure. [ONLINE] Available at:
https://www.avsforum.com/electroluminescent-quantum-dots-are-coming-sooner-than-you-think/. [Accessed 19 September 2019]
Quantum Dots
The Quantum Dots (QDs) are a type of nanoparticles that have several potential applications in diverse industrial and biomedical areas and are the most used and well-characterized nanomaterials. These nanoparticles are widely used as therapeutic agents and fluorescent dyes and are useful in the electronic field as is used in LED flat panel displays and in photovoltaic solar cells 11,12. QDs are semiconductor crystals with nano dimensions, containing
200-10,000 atoms13, and are composed of semiconductor metals core (e.g. CdSe, CdTe, ZnSe)
of groups II-VI and are often encapsulated by a shell or a “cap”(eg. ZnS, DHLA, BSA, polyacrylate)
1,14 The shell improves their optical and electronic properties and prevent core metal leaching
events, which are a major cause of toxicity. 12,14 QDs shows unique features as luminescence, a
wide and continuous absorption spectrum, narrow emission spectra and high light stability. These properties are easily achieved by modulating their size and chemical composition. Additionally, with only a few hundred atoms, QDs can emit only one wavelength of light when they are excited, and the colour of this emission is determined by the size of the nanoparticle 15. Therefore, QDs
development was one of the first nanotechnologies used in biological sciences. Moreover, an increase in its use in several domains of biological research like cancer detection and targeted drug delivery is expected in the future 16.
6
QDs have unique and remarkable properties, however, little is known regarding their toxicity. Recent studies indicate that the detection of nanoparticles, namely QDs, in wastewater is increasing, mostly in places like hospitals (due to their biomedical applications) and near industries (e.g. electronic and textile). 13 The main concern about the use of QDs are the ionsreleased from the metal core that can induce the generation of reactive oxygen species (ROS)17.
When QDs are released into the environment, several oxidative phenomena may occur, like air or photo-oxidation with UV-light increasing the leaching of metal ions. However, diverse storage and coating strategies can be employed to avoid these events: the shell removal following the release of QDs into the environment by natural phenomena’s or after intake by organisms. If QDs are internalized by cells through endocytosis they are then trafficked to acidic and oxidative environments for degradation resulting in the production of harmful substances or elements like free toxic ions12
Thus, it is still necessary to continue researching in the QDs areas, mainly by conducting more toxicity studies since there are no guarantees that the cap remains intact to prevent the release of metal (e.g. Cd, Zn, Ag, Al) ions which, in elevated concentrations can pose a threat to the ecosystems.
Quantum Dots Characterization
The growing need to study the toxicity of nanomaterials, as QDs, led to the development of novel techniques or the use of various characterization techniques as Scanning Electron Microscopy (SEM), Transmission Electron Microscopy (TEM) or Dynamic Light Scattering (DLS), among others. Due to the small size of nanoparticles, optical microscopy is not used for characterizing nanoparticles. Instead, it is commonly used the electron microscopy18.This
technique uses a microscope with a beam of accelerated electrons as source of illumination and it is capable to achieve higher resolutions (size range: 0.5 nm – 1 mm)19. On the other hand, SEM
is usually used to obtain information regarding size, size distribution and shape of the nanomaterials. TEM uses a more powerful beam of electron being capable to offer more detailed information than SEM, as crystal structure and granularity of the samples. However, the samples are dried for analysis, which is a disadvantage since it doesn’t allow to see nanoparticles dispersed in aqueous solutions. To overcome this difficulty DLS analysis is as a complement to the electron microscopy since this technique works in aqueous solutions. DLS uses a laser light beam that is scattered off the nanoparticle solution and correlates the Brownian diffusion of the nanoparticles and the Stokes–Einstein equation to the hydrodynamic diameter of the nanoparticle (size range: 0.7 nm – 7 µm)18,19. DLS is very useful to assess the state of aggregation of the
nanoparticles in aqueous solution. However, for the characterization of QDs, using both techniques can be helpful to solve ambiguities that may occur when using only one technique.
7
Nanotoxicology
Nanotoxicology is a new interdisciplinary field that combines different areas like chemistry, physics, biology, medicine, and toxicology. This new scientific area goes hand in hand with the development of new nanomaterials, and it operates by developing nanotoxicology studies. 20 To date, the results from several studies were enough to suggest that nanoparticles
present new and unusual risks, however, these same studies give little information on how these risks can be identified, assessed and controlled. Nonetheless, there are many new nanomaterials being manufactured every year and appearing in the environment. 21 The hazard effects of
nanoparticles are likely to occur in very different circumstances and they have greater potential to enter and travel through the organism than other materials or larger particles. 22 The properties
that make nanoparticles so unique are the same that require a closer look to avoid harmful consequences to organisms. In fact, there is no size cut-off below which nanoparticles become unsafe and this is due to the surface area of the nanoparticle and its reactivity. It is easy to comprehend that as smaller is the particle, more atoms are available at the surface increasing the energy to react and consequently rising the toxicity to living organisms. 22,23 It must be noticed
that properties like size, chemical composition, shape, state of aggregation, solubility, and surface properties affect biocompatibility and potentiate harmful effects. 24,25 Exposure of organisms to
nanomaterials can occur in diverse moments as during their development, manufacture, use or following disposal. Nanoparticles can enter the organism mainly by three main routes: inhalation, skin or by ingestion.
The respiratory system is the most usual entrance because nanoparticles can travel great distances in the air. It is known that nanoparticles have a natural tendency to aggregate which can be a reason that limits their entrance in the organisms. Several studies have shown that nanoparticles deposited in the lungs gain access to the rest of the body traveling through the circulatory system into the liver, spleen, heart and secondary organs.This is a cause for concern because these studies prove that there is a direct link between inhaled nanoparticles and several diseases. 24 Other studies have concluded that neuronal translocation via nasal sensory neurons
is a potential route of CNS (Central Nervous System) exposure in humans with hazardous consequences such as loss of cell viability., induction of oxidative stress and dopamine depletion.
24,26
Another route of exposure to nanoparticles is dermal exposure and is mainly due to the increasing uses of new materials containing nanoparticles as sunscreens and cosmetics. However, many studies are inconclusive although particles like QDs and fullerenes seem to enter the skin, depending on their size and surface coatings. 26 Moreover, it is important to refer that
intact skin, when healthy, is an important barrier able to prevent nanoparticles from entering the body. 24
The last route of exposure is ingestion, which can occur in organisms following ingestion of food or water, drugs or direct swallowing of nanoparticles. Subsequently, absorption occurs by the gastrointestinal tract, and it seems to be regulated by the size and surface properties of the
8
nanoparticles. Thus, particles that are small, hydrophobic and with neutral charge are preferably absorbed 24. However, more studies in this scientific area are required to draw more conclusions.After entering the body by these routes, nanoparticles can promote their harmful effects by chemical or physical mechanisms. The chemical mechanisms are commonly the production of reactive oxygen species (ROS), dissolution and release of toxic ions, disturbance of the electron/ion cell membrane transport activity, oxidative damage through catalysis, lipid peroxidation or surfactant properties. All these processes, but mainly the ROS production can lead to secondary processes that can cause cell damage and compromise cell integrity and, in more severe cases can result in cell death. Physical mechanisms are due to particle size or surface properties. These two mechanisms can lead to a biological response that may occur before or after the internalization of the nanoparticles. 26
Thus, researchers and manufacturers are trying to keep the balance between the pros and cons of the nanoparticles regarding their unique properties and their potential toxicity. Therefore, the creation of this new field called “Nanotoxicology” is crucial to help them to follow the developments in these materials and answer the questions that are still unanswered to keep this industrial revolution as safe as possible to human health but also to wildlife.
1.2 Biological Models
Aquatic organisms are widely chosen as biological models since they are more sensitive to exposure to toxic agents than terrestrial organisms including mammals. Besides, many aquatic organisms are easy to maintain and to breed providing a suitable model to evaluate toxicity and other adverse effects of pollutants. 27
Zebrafish (Danio rerio)
The zebrafish (Danio rerio) is the preferred vertebrate model in many scientific studies. Recently, it´s value in toxicology has been recognized and several studies were carried out in different scientific areas such as developmental biology, reproductive studies, teratology, genetics, neurobiology, environmental sciences and behavioural studies.1,28,29 D. rerio is a
freshwater fish native from the asian continent and belongs to the family Cyprinidae and to the order Cypriniformes30,31. Zebrafish can live in water with a temperature ranging from 6.7°C to
41.7°C and it can be classified as eurythermal (tolerance to wide temperature ranges). The ideal temperature value for zebrafish in the wild has not been set, however, for zebrafish culture the ideal temperature is about 28.5°C. The pH value is also an important factor for zebrafish housing. They can tolerate a pH range of 6 to 9.5, however, to meet the best culture conditions and promote good health the pH values must be between 7 to 8. 32 Their diets are based on insects,
9
Figure 1.2 Adult zebrafish (Danio rerio).
Zebrafish is an excellent biological model to compare experimental research performed on vertebrates (it’s more comparable to human than to invertebrate models) and its use has many benefits. 33 Thus, the main advantages in the use of Zebrafish are related to their small size,
husbandry, early morphology, transparent embryo, short life circle, and well-characterized genetics.28,33 Several human genes have homologues in Zebrafish and functional domains of
proteins (Kinase ATP biding domains share 100% of identity, for example). 34 Also,
cardiovascular, nervous and digestive systems of the Zebrafish are similar to human systems. 20
In addition, zebrafish species measure about 3 to 5cm in adults, which minimize costs both for the maintenance of the animals and for chemicals tested (e.g. drugs and pollutants). Moreover, is relatively easy to perform several assays with many fishes. One pair of adult fish can lay about 200-300 eggs in one morning and if properly sustained they can provide this amount of eggs every 5-7 days. 28 The unique optical properties of the transparent embryos allow the study of all
stages of the development in great detail in vivo. 28,29 With all these features is easy to understand
why zebrafish is one of the most successful model and although zebrafish does not replace other mammalian models, represents the first stage experiments and have already contributed for a huge development in the nanotoxicology field. 20,34 Cell culture assay is another approach for the
assessment of toxicity. In fact, there are some zebrafish cell lines that can be used for cytotoxicity assays (e.g. liver, muscle).
Daphnia magna
Daphnia magna, usually referred as water flea, has been used for many years as a
biological model in aquatic tests, more namely in chronic and acute tests which are the most common toxicity tests. 35,36 Daphnia are widely distributed in natural ecosystems and are well
adapted to such fluctuations: low oxygen levels, high pH and wide ranges of salinity and temperatures. This organisms belongs to the family Daphniidae, order Cladocera and measures about 5-6mm in length. 37 It can reproduce asexually or sexually, depending on environmental
factors, but in both cases, eggs are produced in the ovary. The sexual reproduction is mediated by external stimuli (high density of population, scarcity of food), haploid oocytes are fertilized. In
10
Figure 1.3 Dapnhia magna.
Source: Fineartamerica. 2019. Daphnia magna. [ONLINE] Available at:
https://fineartamerica.com/featured/10-water-flea-daphnia-magna-ted-kinsman.html
[Accessed 19 September 2019].
the asexual reproduction, parthenogenic oocytes remain diploid and embryogenesis happens deprived of fertilization. 38,39 In fact, D. magna is a key species in lake ecosystems since they
have a central role in the freshwater food web and because they feed on phytoplankton and are prey to vertebrate and invertebrate predators. Moreover, they are filter feeders and can filter about 400ml of water per day. 40 Several studies used Daphnia as a biological model inareas such as
evolution, ecology, ecotoxicology, predator-induced polyphenisms, and genomics. 38
The main factors that make Daphnia a good biological model are the short life cycle, parthenogenic reproduction, easily cultured in the laboratory using little space and it is sensitive to a broad range of aquatic contaminants35,36. Since Daphnia sp. has a huge contact with the
surrounding medium, it has a great potential to bioaccumulate pollutants (e.g. heavy metals, chemicals, nanoparticles) present in the aquatic medium. The contaminated Daphnia can increase toxicity in the organisms at higher trophic levels if they use the daphnids as food source40.
Human hepatoma cell lines (HepG2)
Another approach in toxicology studies is through in vitro cell models. Since the liver is the principal organ responsible for metabolism, its hepatocytes contain most of the enzymes required for the metabolic reactions. For this reason, hepatocytes and more properly human primary hepatocytes are considered a model for drug metabolism and toxicity of xenobiotics .41
HepG2 ( Fig. 1.4) is a human liver cancer cell line derived from the liver tissue of well-differentiated hepatocellular carcinoma of a young boy. These cells are easy to maintain in an appropriate
11
Figure 1.4 Representative image of Human hepatoma cells (HepG2). Image
acquired using a inverted phase contrast microscope (Olympus, Japan) Magnification: 100x magnification.
culture medium and incubation at 5% CO2, and are widely used for risk assessment since they
12
1.3 Toxicity Assays
The increase in pollution, mainly aquatic, due to anthropogenic activities have become a global concern. Aquatic organisms are exposed to several toxic agents such as pesticides, heavy metals, nanoparticles, and others. These compounds compromise the health of thr marine ecosystems and if biomagnification occurs, the pollutants accumulated in the tissues of aquatic organisms are transferred across trophic levels of the food chain43,44. Thus, the increasing need
for the evaluation of contaminants leads to the study and development of indicators of the biological effect(s) of these compounds in the organisms. When the natural conditions to the welfare of the organisms are compromised or change, they respond by getting sick or in the worst scenario, they can die. These changes can be due to natural or anthropogenic sources and can induce responses at the biochemical, histological, immunological or physiological level. The responses lead us to the concept of biomarker which is defined as a biological response to an environmental compound that can be measured in body fluids, cells, etc. and indicates the presence of contaminants or the magnitude of the host response. 43 Biomarkers can be
antioxidant enzymes (e.g. Catalase, Glutathione-S-Transferase and Superoxide Dismutase), lipid peroxidation (MDA content), Ubiquitin and HSPs production and by measuring of the Total Antioxidant Capacity (TAC), among other markers.
All living organisms are continuously generating, transforming and consuming oxygen reactive species (ROS), which are essential to the physiological control of the cell function. Free radicals are one of the products produced from basic cellular metabolism in aerobic organisms 45.
Several mechanisms such as cellular respiration, exposure to microbial infections and the action of pollutants like cigarette smoke, alcohol, ionizing and UV radiations, pesticides, and ozone produce free radicals. However, if overproduction occurs, it can lead to oxidative stress 27,46,47.
Although reactive species can be harmful, they have essential biological effects as well, and the maintenance of “redox homeostasis” is essential for the good function of the organisms47.
The most biological relevant ROS are molecular oxygen (O2), superoxide anion (O2-),
hydrogen peroxide (H2O2), hydroxyl radical (OH-), nitric oxide (NO-), peroxynitrite (ONOO-) and
ozone. Sometimes, during the metabolic processes, a small amount of those may escape from the protective shield and cause oxidative damage in cells 27,46,47. The formation of these ROS
results from several phenomena. The superoxide anion is a nucleophile oxidizing agent and is generated by various oxidases, and it can also be formed in the mitochondrial electron transport chain for the ATP production. This anion is capable to react with hydrogen donors and dismutate molecular oxygen and hydrogen peroxide. Thus, the hydrogen peroxide comes from superoxide systems and can produce highly reactive radicals when reacting with metal ions, being stable at physiological pH and can cross membranes easily. In order to maintain the balance, hydrogen peroxide is converted in water by catalase and glutathione peroxidase 47,48 The hydroxyl radical
is known to cause oxidative damage to some biomolecules. It is highly reactive but has a short lifetime (nanoseconds). Its main targets are membrane lipids, proteins and DNA. 27 Nitric oxide
13
synthase. Peroxynitrite when occurring in the protonated form is another strong oxidizing agent that has a similar action as hydroxyl by promoting oxidative damage, doing depletion of sulfhydryl groups. Ozone itself is not a reactive species but has the power to oxidize biological components in a direct form. 47,49Thus, there was a growing need, during the organism´s evolution, to develop suitable defence mechanisms against ROS overproduction, ie development of antioxidant mechanisms. Thus, an antioxidant is any substance present in the organism, that intercepts, delays or inhibits the oxidation of the reactive radicals. These antioxidants could be classified by several parameters, as primary and secondary, preventative or repair-systems, non-enzymatic or enzymatic, endogenous and exogenous, hydrosoluble and liposoluble and natural or synthetic 47.
Primary antioxidants are chain breakers which can scavenge radical species by hydrogen donation. The secondary ones are singlet oxygen quenchers, peroxide decomposers, metal chelators, oxidative enzyme inhibitors or UV radiation absorbers. Preventative systems block and capture radicals that are being formed and are present in call compartments. When there are damaged biomolecules, then repair systems intervene to remove damaged compounds or repair them with specific enzymes (phospholipases, peroxidases, acyltransferases). For instance, vitamin E (α-tocopherol), vitamin C (ascorbic acid), flavonoids, glutathione, selenium, chlorophyllin, plasma proteins, and β-carotene belong to the nonenzymatic category of antioxidants. The group of enzymatic antioxidants has as its main characteristic the inducibility of enzymes under oxidative stress conditions. 50 Superoxide dismutases, catalases, ascorbate
peroxidases and glutathione peroxidases belong to this group of antioxidants51. Thus, when
moderate oxidative stress occurs, there is an increase in the amounts of enzymatic antioxidants. It ss this characteristic that makes the enzymatic antioxidants, in many cases, good biomarkers.
27,47.
Catalase
Catalases are ubiquitous enzymes that catalyse the dismutation of hydrogen peroxide (H2O2) to oxygen and water and this way prevent the oxidative damage. Catalases are classified
as oxidoreductases and are mainly located in peroxisomes. Structurally, are a homotetramer, that is, have four subunits and each of one contains a porphyrin heme group at the active site 50,52,53.
The heme groups in a non-polar pocket with hydrophobic strait channels that confers hydrogen peroxide selectivity 48. Are these structural features that allow catalases to react with hydrogen
peroxide as the following reaction (1):
(1) 2H2O2 → 2H2O + O2
As previously referred, catalases are one of the most important enzymes during the oxidative stress because they are the principal scavenger of hydrogen peroxide that can damage cells. When occurs an increase in catalase activity, can be assumed that is an adaptative response to overcome the injury in tissues, reducing toxic levels of hydrogen peroxide.
14
Accordingly, in toxicity assays, a high concentration of the catalase levels can be an indicator of high concentrations of oxygen peroxide levels. 50Glutathione-S-Transferase (GST)
Glutathione Transferases (GST) are a large group of proteins with great importance in detoxification of xenobiotics and endogenous molecules in nature. This enzyme is a dimer composed of two identical subunits that contains the active site (one in each subunit). 54 The
Glutathione-S-Transferase is present in all type of organisms (e.g. mammals, plants, yeast, insects and bacteria) and is usually found in the liver tissues that have an important role in detoxification processes. The reaction catalysed by GST is the conjugation of glutathione (GSH) with a hydrophobic co-substrate with an electrophilic centre. These reactions can be substitutions, additions or isomerizations according to the enzyme and the type of the second substrate. 55
These substrates can be mainly, by-products of oxidative stress and polycyclic aromatic hydrocarbon epoxides that come from actions of phase 1 cytochrome P450. After this reaction, molecules become more soluble and less reactive, which becomes the excretion process easier
54,56,57. In toxicity assays, is common to measure GST activity which indicates the effects of
xenobiotics in the organisms.
Heat Shock Proteins (HSPs)
Heat shock proteins (HSPs) are a family of proteins with an important role during oxidative stress. Under normal physiologic conditions, HSPs are expressed at low levels but in oxidative stress scenarios like hyperthermia, oxidative damage, physical injury or chemical stressors, its expression increases abruptly 58. The main function of HSPs is acting like chaperones preventing
protein aggregation and targeting inappropriately folded proteins to degradation pathways. HSPs are subdividing among five families according to their molecular weight, amino acid sequence homologies and functions 59. The HSP70 family has proteins with a molecular weight between 68
KDa and 75 KDa and is the most well-studied and characterized class of heat shock proteins. Members of this family are usually located in the cytosol, endoplasmic reticulum, and mitochondria and are the first to be induced under stress conditions 59. Thus, HSPs act as a good
biomarker due to its inducibility of expression (relevant increase) during oxidative stress conditions.
15
Lipid Peroxidation
One major concern regarding the overproduction of free radicals is lipid peroxidation. Lipid peroxidation is a harmful chain of reactions that results from oxidative stress. The main targets of these reactions are some components of the biological membranes that become damaged 46,60. Lipid peroxidation gives rise to several products that are unstable and tend to
degrade quickly in toxic secondary products. Malondialdehyde (MDA) is a three-carbon, low molecular weight aldehyde with two or more methylene-interrupted double bonds and is the main product of lipid peroxidation. 46,61 Due to its toxicity it should be considered as more than a
biomarker because it is highly reactive and capable to react with biological molecules inside and outside the cell. As a biomarker, the measurement of the quantity of the MDA is a good indicator of the level of lipid peroxidation. TBARS method is the simplest and most frequently used method for MDA quantification 46,60,61.
Superoxide Dismutase (SOD)
Superoxide dismutases (SOD) are a group of metal-containing enzymes that have an important role in detoxification of reactive oxygen species, more properly, the superoxide anion. SOD catalyses the breakdown of superoxide anion into molecular oxygen and oxygen peroxide. Superoxide dismutases could use copper, zinc or manganese as a cofactor and are widely distributed prokaryotic and eukaryotic cells 62,63. The reaction carried out by SOD is the following
(2):
(2) 2O2- + 2H+ → H2O2 + O2
This reaction is preventive, that is, prevents the formation of a compound more aggressive like peroxynitrite or hydroxyl radical, and after that, the reaction catalysed by catalase can occur.64 Therefore, the action of both enzymes needs to be concerted to maintain balance in
the organism´s body and keep it safe from reactive oxygen species. Therefore, superoxide dismutases are part of the first line of defence against oxidative stress and can serve as an earlywarning biomarker for pollution. 63,64
Ubiquitin
Ubiquitin is a polypeptide with 76 amino acids that can be found in cells either free or covalently bonded with other proteins. 65,66 Ubiquitins are involved in the regulation of cellular
signalization and homeostasis, i.e. ubiquitin marks damaged proteins, through a covalent bond, for degradation in a ubiquitin-proteasome system 67. Proteasome is the preferential machinery for
16
degraded in a selective way. Thus, the ubiquitin-proteasome pathway (UPP) constitutes a secondary defence mechanism against oxidative stress, degrading abnormal proteins. During the oxidative stress, the amount of ubiquitin conjugates increases, and it could be useful as a biomarker. 65Cell viability assay – MTT
MTT
assay is a widely used method to measure viable cells without need the process of counting cells. The principle of this assay is the dehydrogenases reduction of MTT (3-[4,5dimethylthiazol-2-yl]-2,5diphenyl tetrazolium bromide) in MTT formazan according to the reaction (3)(3)
In this reaction, the change of colour (yellow to purple) occurs due to the mitochondrial activity in living cells. This activity, and the change of colour is usually constant, so if any increase or decrease in colour is detected it could be linearly related to its activity. Only living cells are capable to carry this reaction; thus, the number of viable cells can be detected by measuring formazan concentration reflected by the absorvance at 540 nm. When the absorvance at 540nm decreases it reflects a reduction on cell viability.
17
Chapter 2
19
2
Objectives
In recent decades, developments in the technological and industrial fields have raised concerns about exponential production of nanomaterials and the consequent discharge of industrial effluents, containing these materials, into the aquatic environment, posing a serious threat to aquatic ecosystems. Thus, the main objectives of the present study are: (i) evaluation of the sublethal effects in D. rerio, D. magna and human cell lines (HepG2) after exposure to different concentrations of QDs (ZnS and CdS), singly and combined; (ii) the study of trophic transfer through zebrafish ingestion of daphnia previously exposed to different concentrations of QDs.
Therefore, to assess the effects of exposure to QDs and to evaluate the trophic transfer, several biomarkers will be analysed in organism´s tissues: catalase, GST, LPO (MDA content), SOD, HSP70, Ubiquitin and TAC.
An additional goal of the present work is to obtain information on the targeted QDs toxicity to the aquatic biota allowing to adopt future strategies to minimize the risk to aquatic ecosystems.
20
.21
Chapter 3
23
3
Experimental Procedure
3.1 Quantum Dots (QDs) synthesis
The QDs synthesis was carried out in the Cenimat research laboratory by the researcher “David Sousa”. To synthesize the Zinc Sulphide QDs and the Cadmium Sulphide QDs, zinc acetate and cadmium acetate were added, respectively, to 1-dodecanethiol, and heated in a microwave reactor up to the constant temperature of 300ºC for 25 minutes. The suspension was then centrifuged (7,000×g), and the pellet washed with ethanol 96%. Afterwards, the resultant powder was washed with chloroform and stored in the dark
.
3.2 Preparation of QDs stock solutions
The Stock solutions (1 g/L) were prepared by weighing 10 mg of QDs using an Analytical balance (Nimbus, Adam Equipment USA), in a microtube followed by the addition of 1 mL of Chloroform 100% (Panreac, USA). Then the QDs solution was centrifuged (Elmi Centrifuge & Vortex, Latvia) at 2,000 ×g for 1 minute at room temperature, and the supernatant was removed. Then, 1.0 mL of distilled water was added to wash out the chloroform remaining. The washing steps were repeated and then the QDs solution was transferred to falcon tubes and volume adjusted to 10 mL. Finally, the Stock Solutions of each QD type were ultra-sonicated (10 min, room temperature) using an ultrasonic bath (J-P Selecta Ultrasons H-D, Spain). The Stock Solutions were stored in the dark at 4°C until further use
.
3.3 Quantum dots (QDs) characterization
The quantum dots’ size distribution and morphology were analysed by scanning electron microscopy (SEM), transmission electron microscopy (TEM) and dynamic light scattering (DLS).
Scanning electron microscopy (SEM)
For the SEM analysis, dispersions of all the QDs (CdS and ZnS) were applied on a carbon-coated adhesive, dried at room temperature and examined with a 1.00 to 2.00 keV field; scanning electron microscope (Microscope Carl Zeiss AURIGA). SEM images were obtained at the CENIMAT facilities at FCT-NOVA, Portugal.
24
Transmission electron microscopy (TEM)
For transmission electron microscopy (TEM), samples were dispersed in ethanol, dried on a carbon membrane coated grid and examined on a JEOL 100SX instrument at 100 kV using a photographic plate. Then, plates were scanned, and the image analysis was performed using image J software (NIH, USA) after optimizing the parameters (area of analysis = 4–200 nm2;
circularity = 0.4–1). The TEM analyses were performed at Egas Moniz – Cooperativa de Ensino Superior electron microscopy facilities
.
Dynamic light scattering (DLS)
The instrument used for DLS characterization was NANO PARTICLE ANALYZER SZ-100 from HORIBA (Japan). The Laser specifications were: Laser Diode of Showa Optronics Co., Ltd., model JUNO10G-HO with an Output of 10 mW (wavelength: 532 nm) and at 25ºC. Measurements obtained were processed using HORIBA SZ-100 software, furnished by HORIBA (Japan).
The same nominal concentrations of QDs used for conducting the exposure tests (10, 100 and 1000 g/l QDs), were re-dispersed and prepared in a volume of 1.0 ml of Milli-Q. water to directly measure by DLS. Then, ZnS and CdS (QDs), singly and combined were re-dispersed using an ultrasonic bath (Selecta, Spain) to obtain the same dispersions used in exposure tests. In general, all samples showed aggregation behaviour when compared to the sizes determined by SEM and TEM. Due to their surface nature ZnS and CdS (QDs), singly and combined, the analysed QDs tend to aggregation when using water as re-dispersion medium, however, this trend to aggregate was expected.
Other re-dispersion mediums were explored to achieve better characterization such as chloroform, SDS, SDS + methanol, and dilutions of them. Dried samples of both QDs species were weighted and re-dispersed in water:SDS, water:SDS:methanol and chloroform (the synthesis medium). With the aid of the ultrasonic bath Selecta, Spain) for 10 minutes at 25ºC, the samples were re-dispersed and measured by DLS.
25
3.4 In vivo assays
Test Organisms
The selected biological models used to o perform the experiments were a freshwater fish (D. rerio) and a freshwater crustacean (D. magna).
The fish were obtained from commercial suppliers (Aquaplante, Portugal), transported to the laboratory facilities and acclimated before the beginning of the exposure assays.
The daphnids were obtained from Aquário Vasco da Gama (Portugal), transported to the laboratory for acclimation and reproduction before being used in exposure tests.
Acclimation
Before the beginning of the assay D. rerio were acclimated for one week in a closed-circuit system with filtered de-chlorinated tap water, at a pH of 7.4 ± 0.2, temperature of 20 ± 1ºC, photoperiod: 12hL:12hD, with continuous aeration enough for keeping the dissolved oxygen always higher than 6 mg/L. Daphnids were acclimated for one week in a closed system with artificial water with minerals made in laboratory (for 5L of distilled water was added 989.35 mg of CaCl2 (Sigma-Aldrich, USA), 411mg of MgSO4 (LABCHEM, Portugal), 324mg NaHCO3 (Panreac,
Spain), 29mg of KCl (Sigma-Aldrich, USA) and 0.01mg of Na2SeO3 (Sigma-Aldrich, USA)), at a
pH of between 7.5 and 8.2, the temperature of 25 ± 1ºC, photoperiod: 12hL:12hD and with continuous aeration enough for keeping the dissolved oxygen always higher than 6 mg/L. The physical and chemical parameters were checked using an ammonia test kit (API, USA), a dissolved O2 and pH meter (Hanna Instrumentation, USA), and a manual thermometer.
26
Exposure assays
Bioassay 1: Exposure of Danio rerio to QDs (ZnS, CdS), singly and combined
After the acclimation period, D. rerio, (N=50; 0.27 ± 0.15 g; 2.74 ± 0.37 cm standard length), of both sexes, with less than one year of age, were randomly distributed into 1000 mL volume glass containers, in groups of four fishes per tank. Fish were exposed for seven days to different concentrations of ZnS QDs and CdS QDs (10 µg/L, 100 µg/L and 1000 µg/L) singly or combined. A control tank containing filtered and de-chlorinated tap water was used as control. A scheme of the bioassay is shown in figure 3.1.
The fish were tested under a constant temperature of 20 ± 1ºC, pH of 7.5 ± 0.2, photoperiod: 12hL:12hD and continuous aeration. Some physical and chemical parameters as pH, TºC, ammonia and dissolved oxygen were monitored during the assay. The experiment conditions in each tank were renewed every 48 hours, and the assay had a duration of seven days (according to OECD guidelines)68. During the experiment period, fish were daily fed ad libitum with
commercial dry food (Eco vita). Glass containers were monitored constantly for the counting of dead fish.