FORMATH Vol. 19 (2020), DOI:10.15684/formath.19.001
Scientific Category
Modeling Diachronic Cork Oak Dieback–Comparison of Two
Case Studies
Constanca Camilo-Alves
∗, Susana Saraiva-Dias, Cati Dinis, Maria do Rosário Felix,
Carla Varandas, Nuno de Almeida Ribeiro
Abstract: Widespread events of cork oak mortality are disturbing the system and jeopardizing cork production. This research combined techniques to analyze in detail these events on a small scale. To understand the dynamics of cork oak mortality and the factors associated with it, a diachronic study was performed in two farms located in Évora, Portugal. The case studies were two nearby farms suffering from tree dieback since 2000. Aerial images of the area, taken in 2004 and 2012, were processed with GIS in order to detect dead trees and to calculate tree crown cover. Slope and aspect were obtained through cartographic and topographic maps. The intersection of those maps resulted in polygons with unique values for those characteristics. Mortality index and tree crown cover were calculated for each one of them. Maps of the kernel density of tree mortality were generated to select key spots for pests and diseases field survey. Detection of soil pathogens was performed using baiting method and molecular analyses. The analysis showed that both farms had the same predisposing and inciting factors associated with tree decline, such as the soilborne Phytophthora cinnamomi, sunlight exposure or soil disking. However, the relative importance of each factor varied among farms. As a result, the dieback processes also differed, despite their similarity regarding mortality intensity. The diachronic approach associated with field survey resulted in a better comprehension of the tree dieback on a small scale and proved its usefulness in future decision-making regarding tree mortality mitigation. Keywords: Cork oak, diachronic analysis, image processing, mortality, Phytophthora cinnamomi, Quercus suber
1. Introduction
Cork oak (Quercus suber L.) is a mediterranean tree of high conservation and socioeconomic value. Cork is the outer layer that covers tree trunks and branches, and are removed on a cycle of 9 or 10 years for commercial purposes. However, severe events of cork oak mortality have been consistently occurring in the Mediterranean basin since the 1980s (ex: Cabral et al. 1992; Brasier et al. 1993; Moreira, 2001; Sousa et al. 2007). Nowadays, cork oak dieback is considered a complex multifactorial phenomenon which involves the combination of several factors acting together (Camilo-Alves et al. 2013). The previous authors classified them following Manion’s (1981) disease spiral, according to their persistence in time: Factors that predispose cork oaks to decline are permanent site conditions that affect root expansion and water retention, such as soil compaction and soil depth or hydromorphic soils (Brasier et al. 1993; Moreira and Martins 2005; Ribeiro and Surový 2008; Dinis et al. 2016). Inciting factors act temporarily on tree vitality. They can be pests and diseases, climatic events, silvicultural practices, soil nutrients and organic matter. Phytophthora cinnamomi is the most significant pathogen associated with the widespread cork oak decline (Brasier et al. 1993). This soil pathogen destroys the fine roots, particularly in conditions of high soil moisture content. It is not feasible to eradicate P. cinnamomi from the environment, but the inoculum can reach less deleterious levels. Therefore, it can be considered an inciting (temporary) factor. Considering soil nutrients and organic matter, cork oaks are well adapted to poor soils, but in some cases few soil nutrients such as phosphorus may affect tree vitality (Martins et al. 2006). Its effect is either direct or indirect by means of favoring P. cinnamomi antagonistic microbiome along with soil organic matter (ex. Broadbent and Baker 1974; You and Sivasithamparam 1995; Richter et al. 2011). Regarding the role of silvicultural practices on cork oaks vitality, Ribeiro et al. (2011) and Dinis (2014) emphasize the deleterious effect of soil disking practices in cork oak roots survival. Therefore, soil disking and soil nutrients /organic matter may also be inciting factors to cork oak decline. Drought is also an important inciting factor (Cabral et al. 1992; Lloret and Siscart 1995; Peñuelas et al. 2001). In the context of climatic changes, it is expected to have a predominant role on cork oak decline and should be considered in the dieback mitigation actions. Finally, the contributing factor in this silvopastoral system is usually the pathogenic fungus Biscogniauxia mediterranea, the Received Sep. 24, 2018; Accepted Sep. 4, 2019
ICAAM, Universidade de Évora, Évora, Portugal
causal agent of the charcoal disease (Santos 2003). The identification of the factors involved in each case study of cork oak dieback, as well as the relative importance of each factor in the etiology of decline, are essential for the forthcoming mitigation actions.
The purpose of this study was to analyze space-time dynamics of mortality patterns and the factors associated with cork oak mortality in two farms located in southern Portugal. To achieve this objective, appropriate spectral image processing methods were applied. The improvement in digital aerial imagery treatments has provided new tools for the study of forest systems (Ribeiro et al. 2016). Surový et al. (2004a,b) developed an algorithm to identify mediterranean trees from high-resolution remote sensed imagery, using near Infrared (NIR) and visible spectrum (RGB). The procedure enhances the quality and accuracy of the elements of interest. The processed images can be used for diagnosing tree physiological status (dead/ alive) and for mapping tree mortality. Using geographic information systems (GIS) one can perform space-time patterns analysis of dead trees in combination with environmental maps at the landscape level. The spatial-temporal dynamics of mortality can provide a better understanding of the relationship between environment and tree decline (Liu et al. 2007). Tree mortality maps can also be useful for selecting sites for pests and pathogens field survey, thus concentrating efforts in key spots alone. Therefore, with these techniques, the goal was to identify the factors associated with cork oak decline acting in each study site, accessing the relative importance of each one and understanding the dynamics of tree mortality. Only then will it be possible to propose future mitigation actions, adapted to each location.
2. Material and Methods
2.1. Study sites
Located in Évora district of Alentejo region, southern Portugal, both farms were acquired in 1991 by a cork producer. The climate in the region is mediterranean with 15.8◦C average tem-perature and 611 mm average annual rainfall on the climatological normal of 1971/2000 (I.P.M.A. 2017). Separated by 15 km from each other, Farm #1 has approximately 250 ha and Farm #2 has approximately 230 ha. Both farms are predominantly cork oak forests, with no other land use.
Spatial topographic and pedologic characterization of the study sites was carried out using soil type maps and cartographic maps in ArcGIS. The methodology is explained below. A resume of the description of the study sites is detailed in Table 1.
Before the acquisition of the lands, there was no relevant agro-silvo-pastoral management, except for cork extraction, which remained the only holding in these farms. After the acquisition, other cultural practices have been carried out (Table 2). The landowner periodically performs soil analyses to infer the necessity of soil amendments, and to test its efficacy. These results and the significant differences between the study sites are detailed in Table 3. Over the years, the landowner has been observing great mortality in the farms. In farm #1, tree mortality started before 2000, and in farm #2, noticeable events of mortality were detected since 2004.
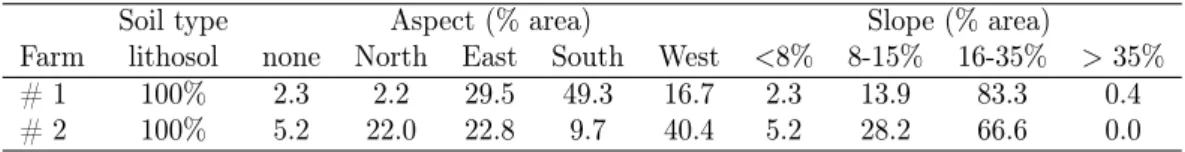
Table 1. Classification and relative percentage of each site attribute, by farm.
Soil type Aspect (% area) Slope (% area)
Farm lithosol none North East South West <8% 8-15% 16-35% > 35%
# 1 100% 2.3 2.2 29.5 49.3 16.7 2.3 13.9 83.3 0.4
# 2 100% 5.2 22.0 22.8 9.7 40.4 5.2 28.2 66.6 0.0
2.2. Image and map procedures
High-resolution aerial orthoimagery of the region with 50 cm resolution, taken in 2004 and 2012, were obtained from the Portuguese Geographic Institute. The aerial photos were processed following Surový et al. (2004a,b) methodology, using ArcGIS: The NIR and RGB spectral procedure contrasted features essential to the visual detection of dead cork oaks. The first step was to visually detect dead trees from 2004 and 2012 processed photos by selecting them manually. Afterwards, living cork oak trees were discriminated from the background using the B-square index. The index transformed the RGB color space to discriminate the cork oaks from the background. Its accuracy
matches with other indexes but its overestimation error is the lowest (Surový et al. 2004b). The thresholding segmentation was calculated from the histogram of grey levels. All image pixels under the threshold were marked as black, and those above the threshold they were marked as white. The results of these procedures were diachronic maps of dead trees and diachronic maps of tree crown cover. The abiotic factors were accessed through soil type maps (Directorate-General for Agriculture and Rural Development, 1:2000) and cartographic maps (Army Geospatial Information Center, 1:25000). Soil characteristics that may limit cork oak survival were identified from the soil type maps, following Ferreira et al. (2001). For example, lithosoils are typically shallow soils, presenting limitations to cork oak root development. Slope and aspect variables were categorized from cartographic maps (Table 4). The intersection of those three maps resulted in a map with single-valued polygons for soil limitation, slope and aspect. Polygons larger than 20 ha were divided into two smaller units. Crown cover density (%) and the number of dead trees were also calculated in each polygon, after overlapping them with the processed photos.
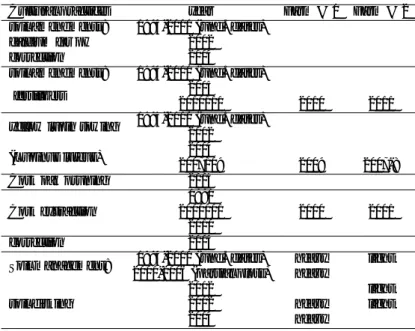
Table 2. Cultural practices performed between 1994 and 2012 (information given by the landowner) by farm.
Cultural practices year Farm # 1 Farm # 2 soil amendments: 1994-2000 (und. dates) ✓ ✓ calcium for pH 2002 ✓ ✓ correction 2004 ✓
soil amendments: 1994-2000 (und. dates) ✓ ✓
fertilizers 2005 ✓ ✓
2010/11 2010 2011 yellow lupin sowing 1995-2000 (und. dates) ✓ ✓
2002 ✓ ✓
(Lupinus luteus) 2004 ✓
2007/09 2009 2007-8 Cork oak pruning 2005 ✓
Cork extraction
1991 ✓ ✓
2000/01 2000 2001
2010 ✓ ✓
correction 2004 ✓
Soil management: 1994-2000 (und. dates) heavy light 2001-2006 (partial plots) heavy
soil disking
2002 light
2002 heavy light 2004 heavy
2.3. Field survey of pests and diseases
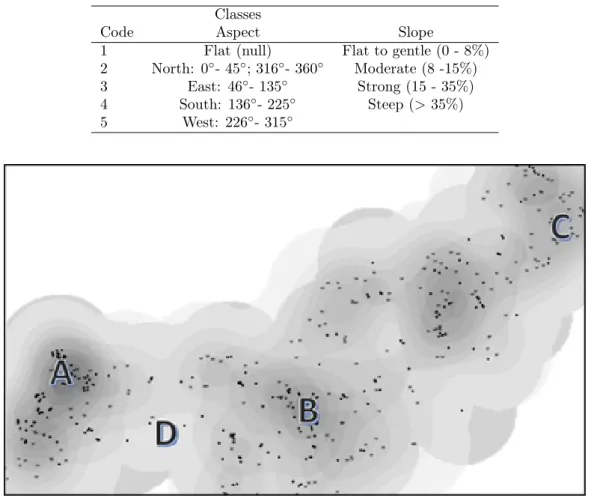
A Kernel density plot of dead trees was performed with ArcGIS. The smoothly curved surfaces of dead trees density maps served as a basis for P. cinnamomi field survey (Figure 1). Criteria for spot selection were: High mortality density in 2004, 2012 and both years; and spots with no mortality. The exact spots for the pests and diseases survey were selected on the edge of the mortality density curves. The probability for P. cinnamomi detection is known to be higher in the edge of mortality patches; pathogen population decreases in the center due to antagonism and interference of fast-growing-associated secondary microflora (Tsao 1983).
Prospection of the soilborne pathogen was performed in June 2015. Negative spots were surveyed again in September 2015. In each plot, four trees were selected. Preferentially ones presenting some symptoms of dieback, such as upper branch dieback. A composite sample was taken in four locations at a 1 m distance from the tree. In the laboratory, P. cinnamomi was isolated from soil samples using baiting and selective medium methodology (Moreira 2001). DNA was extracted from pure fungal cultures growing in PDA plates for ten days, using the DNeasy Plant Mini Kit (Qiagen), in accordance with manufacturer’s instructions. The internal transcribed spacer (ITS) region of nuclear rDNA was amplified through PCR from genomic DNA by using ITS1 and ITS4 primers (White et al. 1990). The PCR reactions were performed using 30‒ 80 ng of genomic DNA, 10 mM Tris‒ HCl (pH 8.6), 50 mM KCl, 1.5 mM MgCl2, 0.2 mM dNTPs (Fermentas), 1 µM of each primer and 2.5 U of DreamTaq DNA polymerase (Fermentas) in a total reaction volume of 50 µL. Amplification was carried out in a Thermal Cycler (Bio-Rad) at 95◦C for 2 min followed by 40
cycles of 95◦C or 30 s, 50◦C for 50 s, and 72◦C for 60 s and a final extension at 72◦C for 10 min. PCR products were purified using GFX Gel DNA Purification Kit (GE Healthcare Biosciences) and sequenced in both directions by Macrogen (The Netherlands). Sequence analysis of the ITS sequences was carried out using BioEdit Sequence Alignment Editor v.7.2.3 (Hall 1999). The search for homologous sequences was done using Basic Local Alignment Search Tools at the National Center for Biotechnology Information and on Fungal Barcode website (http://www.fungalbarcoding.org). In regards to other pests and diseases, exudations or trunk bores were prospected on trees located in the spots. Transects of about 50 m were traced towards the center of mortality spots in search of these conspicuous signs. Charcoal Cankers were ignored since B. mediterranea is an opportunistic disease (Santos 2003).
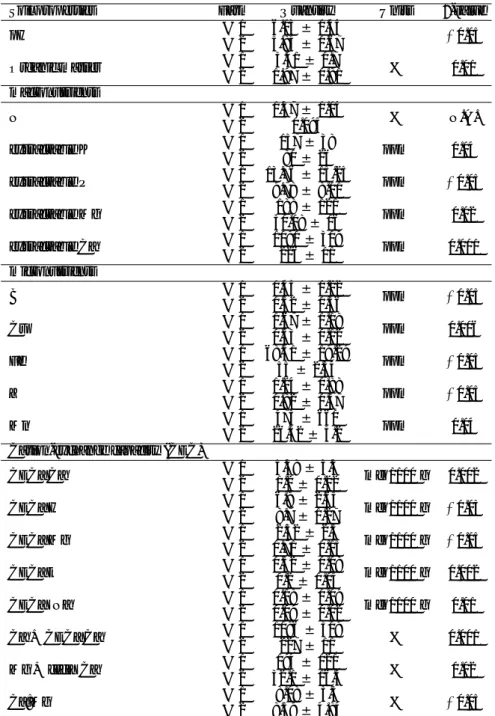
Table 3. Average soil analyses of soil samples taken in 2002, 2005, 2009 and 2012 by farm. Data obtained from the landowner. Each soil property was compared between farms (χ2 test).
Soil properties Farm Quantity Units p-value
pH # 1 6.03±0.44 >0.05 # 2 5.84±0.67 Organic matter # 1 3.41±0.7 % 0.01 # 2 1.97±0.81 macronutrients N # 1 0.37±0.04 % N.A. # 2 0.095 extractable K # 1 137±38 ppm 0.04 # 2 80±26 extractable P # 1 13.76±15.25 ppm >0.05 # 2 9.78±8.01 extractable Mg # 1 188±121 ppm 0.02 # 2 30.08±16 extractable Ca # 1 1090±309 ppm 0.001 # 2 226±11 micronutrients B # 1 0.44±0.22 ppm >0.05 # 2 0.52±0.36 Cu # 1 1.67±1.08 ppm 0.006 # 2 0.53±0.12 Fe # 1 68.51±19.29 ppm >0.05 # 2 55±2.54 Z # 1 1.24±0.88 ppm >0.05 # 2 0.82±0.57 Mn # 1 473±660 ppm 0.04 # 2 26.52±5.2 Cation-exchange capacity (CEC)
CEC_Ca # 1 5.58±3.5 meq/100 g 0.002 # 2 1.2±0.22 CEC_H # 1 6.9±2.65 meq/100 g >0.05 # 2 8.7±1.27 CEC_Mg # 1 2.32±2.5 meq/100 g >0.05 # 2 0.71±0.15 CEC_k # 1 0.32±0.08 meq/100 g 0.002 # 2 0.2±0.04 CEC_ Na # 1 0.18±0.09 meq/100 g 0.01 # 2 0.09±0.02 Ca + CEC_Ca # 1 1096±309 % 0.001 # 2 227±11 Mg + cec_ Ca # 1 194±121 % 0.02 # 2 32.1±16.3 Ca:Mg # 1 8.08±5.3 % >0.05 # 2 8.59±4.84
Table 4. Classification of aspect and slope by farm. Classes
Code Aspect Slope
1 Flat (null) Flat to gentle (0 - 8%)
2 North: 0◦- 45◦; 316◦- 360◦ Moderate (8 -15%) 3 East: 46◦- 135◦ Strong (15 - 35%) 4 South: 136◦- 225◦ Steep (> 35%) 5 West: 226◦- 315◦
Figure 1. Farm #1 Kernell density of dead trees in 2004 (black dots) and 2012 (grey stars). Example of the selection of spots for field survey: A) mortality overlap; B) mortality in 2004; C) mortality in 2012; D) no mortality.
2.4. Statistical analysis
Statistical analysis was performed using the SPSS v.11 software package. A nonparametric z-test was performed to compare the proportion of polygons with or without mortality in each combination of site characteristics (slope and aspect), for 2004. A Mortality Index (MI, Ribeiro and Surový 2008) was calculated for each polygon. That is,
[1] M I = the number of dead trees per hectare
canopy coverage (%)
With MI, mortality is related to tree density, being enhanced in less dense areas. MI may vary from 0 to∞, reaching higher values particularly when crown cover is much reduced. To reduce the range, this variable was ranked using savage score, based on exponential distributions. Diachronic variation of MI (dependent variable) was analyzed using generalized linear mixed models with robust estimation and repeated measures (years), where the target has a Gamma distribution with a log link. The independent variables were: year, slope, aspect, and the interaction between them. Class 4 of the slope was removed from the analyses due to its small area. Only polygons where mortality occurred (in 2004, 2012 or both) were analyzed. The objective was to analyze changes in MI intensity or occurrence from 2004 to 2012. The area (log transformation) of the polygons was considered a random factor. Pearson χ2test was used to analyze the correlation between P. cinnamomi presence and mortality events.
3. Results
3.1. Diachronic analysis of cork oak decline in relation to abiotic factors
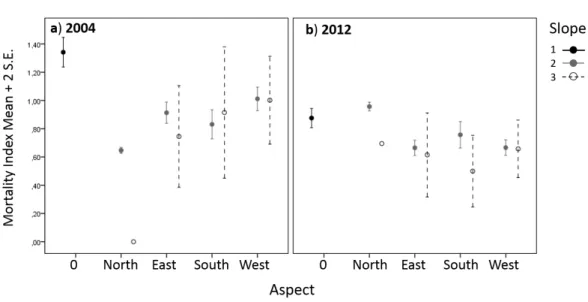
Farm #1: Average tree crown cover on the polygons was 35 ± 16% in 2004. In 2012 polygons were approximately 7% less dense, (28 ± 14%, Figures 2 and 3). In 2004, polygons with dead trees (MI > 0) accounted for 50% of the total area. There were proportionally more mortality events on strongly sloping hills facing south (Table 5). From 2004 to 2012 total mortality area slightly increased (2%): mortality was withdrawn in polygons accounting for 15% of the total area but appeared on other polygons accounting for 17% of the area. In the polygons with mortality in 2004 and 2012, average MI increased between the years (coef. = 0.39, t-value = 1.01). Mortality was much higher on flat to gently sloping terrains (with no aspect) (Table 6). The interaction between “year” and the abiotic variables indicated that the increase in MI was not equal in each category of slope and aspect: Mortality onset was postponed on the strongly sloping hills facing north (Figure 4a) and levelled with other aspects in 2012 (Figure 4b).
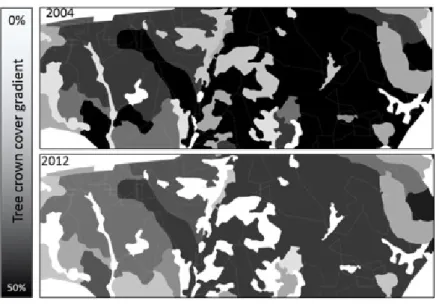
Figure 2. Example of the tree crown cover of farm #1 in 2004 and in 2012. Gray lines are the intersection of the abiotic factors (polygons)
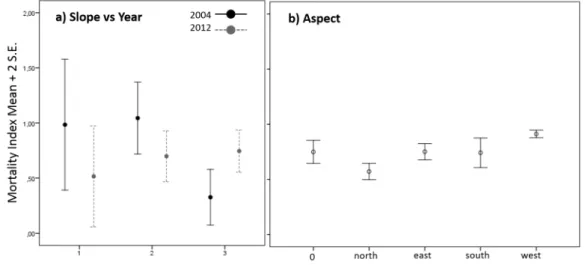
Farm #2: Average tree crown cover on the polygons was 30± 15% in 2004 and polygons became approximately 7% less dense in 2012 (23± 14%, Figure 3). In 2004, polygons corresponding to 60% of the area had dead trees (MI > 0), particularly on the west side of the steepest hills (Table 5).
From 2004 to 2012, there was no increase in the area with mortality. However, there was a shift in mortality from some polygons to other polygons which together, accounted for 26% of the total area. In polygons with mortality (both in 2004 and in 2012), the average MI remained stable over the years, but changed according to slope (Table 6). In 2004, MI was reduced in the steepest hills and, in 2012, mortality was evenly distributed along the slopes (Figure 5a). In both years, mortality was lower in northern aspects and higher in western aspects (Figure 5b).
3.2. Field survey of pests and diseases
During field survey, no relevant signs of pest and diseases were observed on the trunks of the trees located in mortality spots. At the spots selected for the control survey, symptoms of tree dieback were observed. Mortality was widespread in both study sites, requiring local selection of symptomless spots. Farm #2 was almost covered with dieback symptoms, therefore only 6 spots were selected for the control. It was possible to observe that, in general, farm #2 had much thinner soils than farm #1. The causes were not inferred, but this information was then considered in the interpretation of the results. Moreover, in both study sites, most asymptomatic spots were confined
Figure 3. Tree crown cover (%) in 2004 and 2012 from polygons of a) farm #1 and b) farm #2, ordered from the least covered polygon to the most covered one, in 2004. In polygons with only one color (grey), crown cover remained unaltered.
Figure 4. Generalized linear mixed model of mortality index in farm #1 for the interaction between slope and aspect in a) 2004 and b) 2012.
Figure 5. Generalized linear mixed models results of mortality index in farm #2 for a) slope along years and for b) aspect.
Figure 6. Percentage of success in detection of P. cinnamomi field survey in a) farm #1 and b) farm #2, during 2016.
Table 5. Percentage of polygons that had no events of mortality or had positive events of mortality in 2004, within each combination of site attributes, by farm.
Percentage of polygons with
No mortality Mortality No mortality Mortality
Aspect Slope (%) Farm #1 Farm #2
none 0-8 9.0 4.3 13.4 8.5 North 8-15 2.3 2.2 8.8 7.3 16-35 2.5 0.0 6.4 8.8 East 8-15 8.6 6.5 13.8 14.6 16-35 17.7 18.3 12.3 13.4 >35 0.2 0.0 - -South 8-15 12.9 9.7 9.5 3.4 16-35 19.8* 37.6* 9.1 3.7 >35 0.4 1.1 - -North 8-15 11.5 9.7 16.1 20.7 16-35 15.0 10.8 10.5* 9.5* 100% 100% 100% 100%
∗Significantly different at p < 0.05 in the two-sided test of equality for column proportions.
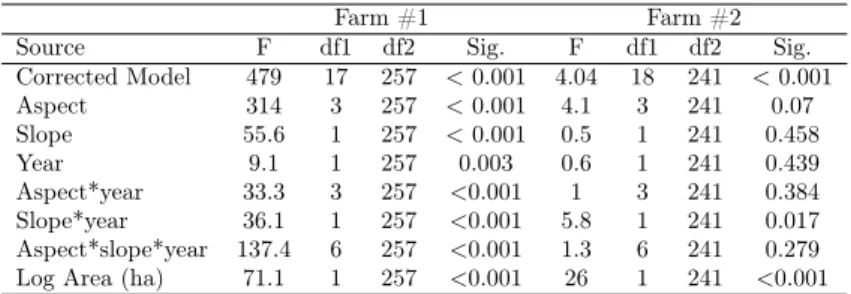
Table 6. Generalized linear mixed model results by farm.
Farm #1 Farm #2
Source F df1 df2 Sig. F df1 df2 Sig.
Corrected Model 479 17 257 < 0.001 4.04 18 241 < 0.001 Aspect 314 3 257 < 0.001 4.1 3 241 0.07 Slope 55.6 1 257 < 0.001 0.5 1 241 0.458 Year 9.1 1 257 0.003 0.6 1 241 0.439 Aspect*year 33.3 3 257 <0.001 1 3 241 0.384 Slope*year 36.1 1 257 <0.001 5.8 1 241 0.017 Aspect*slope*year 137.4 6 257 <0.001 1.3 6 241 0.279 Log Area (ha) 71.1 1 257 <0.001 26 1 241 <0.001
to the north side of the foothills. These spots appeared to retain more humidity. The soils were darker, suggesting more organic matter, and were also less eroded.
Farm #1: Success in P. cinnamomi detection was 11.7%. The pathogen was associated with symptoms of decline (Pearson χ2 test: p = 0.045, Figure 6a), though it was isolated only in 4 (22%) out of 18 declining spots. In the selected 16 asymptomatic plots, there were no positive isolations. In this sample, there was no significant correlation between P. cinnamomi distribution and slope or aspect (Pearson χ2test: p > 0.05). Farm #2: Success in P. cinnamomi detection was 47.8%. However, the pathogen was not associated with symptoms of decline (Pearson χ2 test: p > 0.05, Figure 6b), though it was isolated in 8 (57%) out of 14 declining spots. In the selected 6 asymptomatic plots, there were 3 (33%) positive isolations. In this sample, there was no significant correlation between P. cinnamomi distribution and slope or aspect (Pearson χ2 test: p > 0.05).
4. Discussion
Some of the factors that have been associated with the decline (Camilo-Alves et al. 2013) could be considered in this study. Information related to the independent variables was gathered on maps, with the landowner and on field surveys. Soil type, slope and aspect were the predisposing factors analyzed in this study. The inciting factors considered were P. cinnamomi, cultural practices and soil nutrients plus organic matter. Contributing factors, such as B. mediterranea, were not prospected since they are not relevant for this study. Both study sites presented the same declining factors, however, in different proportions or intensity. Therefore, the relative importance of each factor and their interactions vary between study sites. This was graphically expressed in the adaptation of Manion’s (1981) disease spiral (Figure 7) where relative importance in each main interacting factor is emphasized by the size of its text.
Figure 7. Adaptation of Manion’s (1981) disease spiral with some factors usually associated with cork oak decline, presented in a) farm #1 and in b) farm #2. The relative importance of each factor is indicated by the size of the text. Factors are grouped according to their role in cork oak decline.
4.1. Predisposing factors
Both study sites have predisposing factors to cork oak decline, such as strongly sloping terrains and high sun exposure. Slope gradient usually accelerates soil erosion and limits tree vitality. On the other hand, in these agro-silvo-pastoral systems, it is common that strongly sloping hills undergo less human intervention, which may favor tree survival. Particularly, in the presence of soil pathogens such as P. cinnamomi that are propagated through human activity. Concerning sun exposure, farm #1 is more subjected to extremes temperatures and radiation due to its dominant south aspect (49% vs 10% in farm #2). In the northern hemisphere, particularly under mediterranean climate, south-facing slopes usually become more xeric and warmer, and therefore less conducive to tree growth (Holland and Steyn 1975). Regarding farm #2, there are fewer slopes with south aspect, but 40% are facing west. Solar radiation is less than in the south aspect, but west facing hills are also subjected to high temperatures. This may raise water evaporation, contributing to soil and atmospheric water deficits. High temperature also contributes to the inhibition of net carbon uptake in trees (Berry and Björkman 1980).
4.2. Inciting factors
Soil management has a huge impact on tree vitality. Studies on cork oak roots revealed that soil disking down to 20 cm deep below the crown projection area can destroy about 40% of the roots (Dinis 2014). Furthermore, cork oaks have sinker roots whose main function is water absorption from the groundwater and its redistribution to the tree and superficial roots (Kurz-Besson et al. 2006; Dinis 2014); these roots originate from the horizontal roots found in the top 20 cm soil layer and away from the crown projection (Dinis 2014). Destruction of those roots with soil disking may impair tree water absorption with irreversible consequences on tree vitality, particularly on farm #1. According to the landowner, soil disking for shrub control and soil management was much lighter in farm #2 due to the type of machinery used. Other important difference between farms was the percentage of positive results for P. cinnamomi. This soilborne root pathogen is spread through movements of infected soil, plant material or water. Particularly in these human-made agro-silvo-pastoral systems, spores in the soil are easily spread out by cattle or machinery. In the presence of suitable conditions and susceptible hosts, P. cinnamomi establishes itself. Moreover, installation of yellow lupin pasture - a susceptible host that acts as an inoculum reservoir - may
enhance P. cinnamomi soil levels, exacerbating oak dieback (Serrano et al. 2011). This is a major concern in soils with low microbial activity. In general, soils with high organic matter and /or nutrients ‒ (as in farm #1 instead of farm #2) - the rhizosphere microbiome antagonistic to root pathogens is usually favored, leading to disease-suppressive soils (Broadbent and Baker 1974; You and Sivasithamparam 1995). Considering other cultural practices, both farms were subjected to soil amendments in order to increase fertility and decrease pH. Fertilization and organic wastes are used to improve the quality of agricultural soils. Nowadays they are extended to non-agricultural and forest land to restore degraded soils, improve soil pH and tree productivity (Zasoski et al. 1984). In cork oak montados, soil amendments are a current practice used for pasture and crop installation. However, little is known about the effect on cork oak trees vitality and nutrition, particularly on the long-term. For example, excess fertilization, particularly nitrogen, may eventually predispose cork oaks to water stress by means of reducing root: shoot ratio (Harris 1992; Chaves et al. 2002; Dinis et al. 2016). Moreover, excess nitrogen may affect ectomycorrhizal fungal communities or their interaction with the host plant (Smith and Read 2010), such as cork oaks (Azul et al. 2010). There are considerable published research in the world literature showing the importance of ECM in the development and health of many plants and trees (Smith and Read 2010; Quarles 1999; Marx et al. 2002). Interactions between soil physical and chemical properties, soil microorganisms and plants vitality are very complex and dynamic, whose networks are changed after land management.
4.3. Hypothesis for the etiology of cork oak dieback
Farm #1: The frequent deep soil disking executed on the shallow soils severely affected cork oaks root system across the farm. Mortality onset occurred in half of the area, particularly in stands with more human activity (flat terrains) and was absent from more protected locations (strongly sloping hills facing north). These locations could have better meteorological and soil conditions that reduce the intensity of mortality. Nevertheless, over time mortality intensified in those locations and leveled in all the declining stands. Despite the installation of yellow lupin pastures, the presence of high percentage of organic matter and nutrients may have favored disease-suppressive conditions for P. cinnamomi. The pathogen was present in the soil at low quantities. It was only detectable in symptomatic stands, suggesting a role in the cork oak dieback, but a secondary one given the low proportion of success.
Farm #2: Light soil disking probably affected a smaller proportion of the roots in relation to farm #1. However, low soil organic matter and/ or nutrients, together with the installation of yellow lupin pastures favored the dispersion and establishment of P. cinnamomi. Farm #2 has better topographic conditions than farm #1 and soil disking was light, which may explain the delayed mortality onset regarding Farm #1. Nevertheless, the combination of thinner soils, high pathogen inoculum and soil disking severely affected the root system. Mortality onset was intense and spread out through the study site, with more emphasis on the locations more prone to high temperatures (west hills) and less intensity in locations with difficult access to cultural practices (strongly sloping hills). After mortality onset, the disease was leveled along the slopes, remaining the severity in hills facing west.
4.4. Suggestions for mitigation actions
Actions to mitigate tree dieback can be selected regarding the diagnoses obtained in these case studies: soil disking should be avoided in both study sites in order to preserve tree roots and soil organic matter. Reforestation can take place on farm #1, but tree density should be adapted to the topographic conditions. With regards to farm #2, the high detection of P. cinnamomi suggests the installation of resistant hosts to the disease prior to reforestation with cork oaks. In both study sites, actions to avoid the spread and increase of P. cinnamomi should be taken, such as the avoidance of yellow lupine plantation.
5. Conclusions
The methodology used in this study was suitable to identify significant factors associated with cork oak decline, as well as the topographic attributes favoring or limiting cork oak survival. This approach was also useful to specify mitigation actions for each case-study. Therefore, this research
highlights the importance of the case-studies in the comprehension of tree decline but, above all, their importance in providing decision tools to mitigate the impact of tree mortality.
Acknowledgement
We thank to Manuela Silvestre for the support with the methodology. We thank to the landown-ers of the farms for all the logistic support and information provided, as well as their employees for the valuable assistance in field sampling and shared knowledge. Constança Camilo-Alves and Cati Di-nis received a post-doctoral fellowship from PDR2020 “BI_PhD_UEVORA_ICAAM_PRODER_ 57162”, funded by “Medida 4.1 - Cooperação para a Inovação / ProDeR”. Carla M. R. Varanda re-ceived a post-doctoral fellowship from the Foundation for Science and Technology (FCT): SFRH/BPD /76194/2011, funded by QREN ‒ POPH ‒ Typology 4.1 ‒ co-funded by MES National Funding and The European Social Fund. This work is funded by National Funds through FCT‒ Foundation for Science and Technology under the Project UID/AGR/00115/2013.
References
Azul, A.M., Sousa, J.P., Agerer, R., Martín, M.P., Freitas, H. (2010) Land use practices and ecto-mycorrhizal fungal communities from oak woodlands dominated by Quercus suber L. considering drought scenarios, Mycorrhiza. 20: 73–88.
Berry, J.A., Björkman, O. (1980) Photosynthetic response and adaptation to temperature in higher plants, Ann. Rev. Plant. Physio. 31: 491–543.
Brasier, C.M., Robredo, F., Ferraz, J.F.P. (1993) Evidence for Phytophthora cinnamomi involvement in Iberian oak decline, Plant. Pathol. 42: 140–145.
Broadbent, P., Baker, K.F. (1974) Behaviour of Phytophthora cinnamomi in soils suppressive and conducive to root rot, Aust. J. Agr. Res. 25: 121–137.
Cabral, M.T., Ferreira, M.C., Moreira, T., Carvalho, E.C., Dinis A.C. (1992) Diagnóstico das causas da anormal mortalidade dos sobreiros a sul do Tejo, Sci. Gerund. 18: 205–214 (in Portuguese). Camilo-Alves, C., Clara, M.I.E., Ribeiro, N.A. (2013) Decline of Mediterranean oak trees and its
association with Phytophthora cinnamomi : a review, Eur. J. Forest Res. 132: 411–432.
Chaves, M.M., Pereira J.S., Maroco, J., Rodrigues, M.L., Ricardo, C.P., Osorio, M.L., Carvalho, I., Faria,T., Pinheiro, C. (2002) How plants cope with water stress in the field. Photosynthesis and growth, Ann. Bot-London. 89: 907–916.
Dinis, C.O. (2014) Cork oak (Quercus suber L.) root system: a structural-functional 3D approach, PhD dissertation, Universidade de Évora, Portugal.
Dinis, C., Surovy, P., Ribeiro, N.A., Machado, R., Oliveira, M.R. (2016) Cork oak seedling growth under different soil conditions from fertilisation, mycorrhizal fungi and amino acid application, J. Agr. Sci. 8: 55–67.
Ferreira, A.G., Gonçalves, A.C., Pinheiro, A.C., Gomes, C.P., Ilheu, M., Neves, N. Ribeiro, N.A., Santos, P. (2001) Plano Específico de Ordenamento Florestal para o Alentejo. In: Ferreira, A.G., Gonçalves, C. (eds.), Universidade de Évora. Portugal. (in Portuguese).
Hall, T. (1999) BioEdit a user-friendly biological sequence alignment editor and analysis program for windows 95/98/NT, Nucleic Acids Symp. Ser. 41: 95–98.
Harris, R.W. (1992) Root: shoot ratios, J. Arboriculture. 18: 39–42.
Holland, P.G., Steyn, D.G. (1975) Vegetational responses to latitudinal variations in slope angle and aspect, J. Biogeogr. 179–183.
I.P.M.A. (2017) Alterações climáticas em Portugal, <http://portaldoclima.pt/pt/> (Accessed 5 February 2017).
Kurz-Besson, C., Otieno, D., Lobo-do-Vale, R., Siegwolf, R., Schmidt, M., Herd, A., Nogueira, C., David, T.S., David, J.S., Tenhunen, J., Pereira, J.S., Chaves, M. (2006) Hydraulic lift in cork oak trees in a savannah-type Mediterranean ecosystem and its contribution to the local water balance, Plant. Soil. 282: 361–378.
Liu, Q., Loganathan, P., Hedley, M.J., Grace, L.J. (2007) Effect of mycorrhizal inoculation on rhizosphere properties, phosphorus uptake and growth of pine seedlings treated with and without a phosphate rock fertilizer, J. Plant Nutr. 31:137–156.
Lloret, F., Siscart, D. (1995) Los efectos demográficos de la sequía en poblaciones de encina. Cuader-nos de la Sociedad Española de Ciencias Forestales, (2).
Manion, P.D. (1981) Tree disease concepts, Prentice-Hall,Inc. Inglewood Cliffs, NJ. 399p.
Martins, A., Lousada, J., Branco, I., Caetano, P. (2006) Factores Edafo-Ambientais Associados ao Declínio de Quercus suber em Portugal: Tentativa de Identificação e Dificuldades Encontradas, Silva Lusit. 14:155–167 (in Portuguese).
Marx, D.H., Marrs, L.F., Cordell, C.E. (2002) Practical use of the mycorrhizal fungal technology in forestry, reclamation, arboriculture, agriculture, and horticulture, Dendrobiology 47.
Moreira, A.C. (2001) Aspectos da interacção entre Phytophthora cinnamomi e a doença do de-clínio em Quercus suber e Q. rotundifolia, PhD dissertation, University of Algarve, Portugal (in Portuguese).
Moreira, A.C., Martins, J.M.S. (2005) Influence of site factors on the impact of Phytophthora cinnamomi in cork oak stands in Portugal, Forest Pathol. 35: 145–162
Peñuelas, J., Lloret, F., Montoya R. (2001) Severe drought effects on Mediterranean woody flora in Spain, Forest Sci. 47: 214–218.
Quarles, W. (1999) Plant disease biocontrol and ectomycorrhizae, Integrated Pest Manag. 1: 1–10. Ribeiro, N.A., Surový, P. (2008) Inventário nacional de mortalidade de sobreiro na fotografia aérea
digital de 2004/2006. ICAM, MADRP, AFN, Évora University Publishings (in Portuguese). Ribeiro, N.A., Surový, P., Dinis, C., Camilo-Alves, C., Saraiva Dias, S. (2016) Inventário Nacional de
Mortalidade de Azinheira na Fotografia Aérea Digital de 2004/2006. In: Ribeiro, N.A., Surový, P. (eds.) ISBN, 978-989 (in Portuguese).
Ribeiro, N.A., Surový, P., Pinheiro, A.C. (2011) Adaptive management on sustainability of cork oak woodlands. In: Green technologies: concepts, methodologies, tools and applications (pp. 624-636). IGI Global.
Richter, B.S., Benson, D.M., Ivors, K.L. (2011) Microbial profiling of cultural systems for suppression of phytophthora root rot in Fraser fir, Plant Dis. 95: 537–546.
Santos, M.N. (2003) Contribuição para o Conhecimento das Relações Quercus suber – Biscogniauxia mediterranea (syn. Hypoxilon mediterraneum), Silva Lusit. 11: 21–29 (in Portuguese).
Serrano, M.S., Fernández‐ Rebollo, P., De Vita, P., Carbonero, M.D., Sanchez, M.E. (2011) The role of yellow lupin (Lupinus luteus) in the decline affecting oak agroforestry ecosystems, Forest Pathol. 41(5): 382–386.
Smith, S.E., Read, D.J. (2010) Mycorrhizal symbiosis, Academic Press, Cambridge, UK, 800p. Sousa, E., Santos, M.N., Varela, M.C., Henriques, J. (2007) Perda de vigor dos montados de
so-bro e azinho: análise da situação e perspectivas (documento síntese). M.A.D.R.P., Lisbon (in Portuguese).
Surový, P., Ribeiro, N.A., Oliveira, A.C., Scheer, L. (2004a) Automated aerial imagery analysis system for individual tree identification in cork oak stands, Adv. Geoecol. 37: 287–296.
Surový, P., Ribeiro, N.A., Oliveira, A.C., Scheer, L. (2004b) Discrimination of vegetation from the background in high resolution colour remote sensed imagery, J. Forest Sci. 50:161–170.
Tsao, P.H. (1983) Factors affecting isolation and quantification of Phytophthora from soil. In: Erwin, D.C., Bartnicki-Garcia, S., Tsao, P.H. (eds.) Phytophthora, its biology, taxonomy, ecology and pathology, Am Phytopathol Soc, St. Paul, MN, pp 219-236.
White, T., Bruns, T., Lee, S., Taylor, J. (1990) Amplification and direct sequencing offungal riboso-mal RNA genes for phylogenetics. In: Innis, M.A.G.D.H., Sninsky, J.J., White, T.J. (eds.), Pcr Protocols: a guide to methods and applications, Academic Press, Inc., New York, pp.315–322. You, M.P., Sivasithamparam, K. (1995) Changes in microbial populations of an avocado plantation
mulch suppressive of Phytophthora cinnamomi, Appl. Soil Ecol. 2: 33–43.
Zasoski, R.J., Edmonds, R.L., Bledsoe, C.S., Henry, C.L., Vogt, D.J., Vogt, K.A., Cole, D.W. (1984) Municipal sewage sludge use in forests of the Pacific Northwest, USA: environmental concerns, Waste Manage. Res. 2: 227–246.