THIS REPORT WAS PREPARED EXCLUSIVELY FOR ACADEMIC PURPOSES BY ANA CAROLINA COELHO, A MASTERS IN FINANCE STUDENT OF THE NOVA SCHOOL OF BUSINESS AND ECONOMICS. THE REPORT WAS SUPERVISED BY A NOVA SBE FACULTY MEMBER, ACTING IN
M
ASTERS IN
F
INANCE
European leader seeking opportunities within an
“old fashion industry”
However, investment decisions must be made rationally
▪ Coverage is initiated on “The Navigator Company”, with a SELL recommendation, a price target of 5.11€ and an annualized expected shareholder return of -2,16%.
▪ UWF paper market has stagnated – global CAAGR has
been equal to -0,5%. The segment presents little growth opportunities for the company in developed regions.
▪ Tissue will be the source of growth of the company, as
revenue is expected to increase 23,4% in 2018. However, Navigator is a new player in a very competitive market with well-established players. As more production capacity is entering the market, pressures on profitability increase.
▪ Recent large increases in the Global Pulp and Paper Prices Index, driven by North American suppliers, have provided
great gains to the sector for the past three weeks. However, current price levels will not sustain in the future.
▪ Investments that carry negative returns – both the
Pellets project in the USA and the Forestry project in Mozambique led to substantial losses that destroyed company value.
▪ High CAPEX level – expansion CAPEX has been growing,
totalling €456 million in 2015-2017.
Company description
The Navigator Company, located in Lisbon, Portugal is the European leader in the Uncoated Woodfree Paper market. Other operating activities include pulp, tissue and energy production and forestry management. Products are mainly sold in the national and European market.
“T
HE NAVIGATOR COMPANY
”
C
OMPANY
R
EPORT
“P
ULP AND PAPER INDUSTRY
”
23
MAY
2018
S
TUDENT
:
A
NA
C
AROLINA
C
OELHO
[email protected]
Recommendation: SELL
Vs Previous Recommendation BUY
Price Target FY18: 5.11 €
Price (as of 23-May-18) 5.37 €
Bloomberg: NVG PL 52-week range (€) 3.55-5.44 Market Cap (€M) 3852,98 Outstanding Shares (m) 717.5 Source: Bloomberg Source: Bloomberg (Values in € millions) 2016 2017E 2018F Revenues 1577,4 1633,1 1654,8 EBITDA 393,8 396,6 497,0 Net Profit 216,8 204,1 221,2 EPS 0,237 0,348 0,308 EBITDA margin 25,0% 23,8% 26,7% ROE 17,9% 16,5% 18,7% ROA 8,9% 8,5% 9,1% FCF 199,2 203,2 276,0
Source: Navigator Company
0 1 2 3 4 5 6 0 2000 4000 6000 8000 10000 12000 PSI20 Index NVG PL
“THE NAVIGATOR COMPANY” COMPANY REPORT
Table of Contents
Executive summary……….3
Company Description……….4
Shareholder structure and Share Performance……….5
Dividend Policy………6
Debt………..,7
Competition & Differentiation Strategy……….8
Macroeconomics………10
The Business segment & The sector ... …….11
UWF paper ... 11 Pulp ... 13 Tissue………..14 Energy……….16 Forestry………...16 Mozambique Project……….17 Pellets………..………18
Main Value Drivers………….………20
CAPEX……….20
Revenue………...21
Costs……….22
Valuation ... 23
DISCOUNTED CASH FLOW ANALYS………23
Multiples………..24
Sensitivity Analysis………25
Appendix ... 27
“THE NAVIGATOR COMPANY” COMPANY REPORT
Executive summary
The Navigator Company
Navigator operates in the Pulp and Paper industry, more specifically in the Printing&Writing paper segment. Within this segment, the company is the European leader in the production of UWF paper and the leader in premium paper brands. Navigator has a pulp production capacity of nearly 1,5 million tons and a paper production capacity of nearly 1,6 million tons, being in the top 40 of the world’s largest paper producers. The company is one of the most efficient producers in Europe, as it has one of the lowest cash production costs. Navigator also produces energy that consumes internally and sells to the national grid.
Tissue
Navigator is currently betting in the Iberian tissue sector, as tissue market has been growing at a global AAGR of 3,5%. However, new capacity is entering the market, which can harm Navigator’s profit margins. Total investment in this segment amounted to nearly 145€ million by the end of 2017, which included the expansion of the capacity of production. Navigator has the potential to become the second largest Iberian tissue producer.
Pellets
Navigator sold Colombo Energy, a pellets factory located in Greenwood, USA, in February 2018 for €107,7 million to the largest pellets producer worldwide. Navigator constructed the mill in 2015, however the net operating losses led to the divestiture decision.
CAPEX
Since 2015 that the company has been investing at a faster pace, as it is betting in a business and product diversification strategy. Total CAPEX amounted to €144,7 million in 2017. Investments include, besides pellets and tissue, plantation of a forestry in Mozambique.
Valuation
The Company was valued under a Discounted Cashflow analysis as all operating segments are included in the Paper and Pulp Industry. The enterprise valuation retrieves a share price of 5,11€, which leads to a SELL recommendation, as total annualized return is equal to -1,87%. The market is currently overvaluing Navigator due to the recent increases in global paper and pulp prices.
“THE NAVIGATOR COMPANY” COMPANY REPORT
Company description
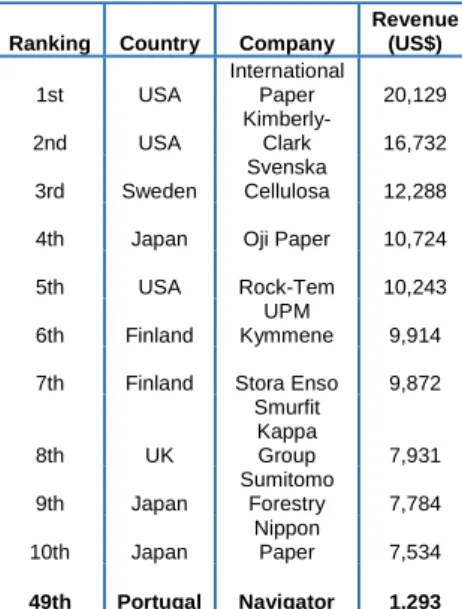
The Navigator Company, former “Portucel Soporcel”, headquartered in Lisbon, Portugal, is the European leading producer of uncoated fine papers - with a market share of 19% in 2017 - and the fourth largest manufacturer worldwide.
The Navigator paper brand is the global leading brand in premium office paper, owning a 50% market share in the European market. Worldwide, within the Paper
and Pulp industry, the company ranks in 49th place in terms of revenue and in 41st place in terms of total production capacity (3,135 million tons of paper, pulp and tissue), according to the latest ranking available (2015 figures).
Other core operations include the production of bleached eucalyptus pulp, of which nearly 80% is integrated in the company’s paper production; the production of tissue paper since 2015; the production of energy, of which nearly 77% is sold to the national grid; and the management of forestry in Portugal and Mozambique. Currently, Navigator operates four mills located in Setúbal, Figueira da Foz, Cacia and Vila Velha do Rodão.
The company was founded in 1953, but it was only established as “Portucel Soporcel” in 2001, after the merger of the two largest Portuguese paper producers - Portucel and Soporcel. In 2016, the company was rebranded “The Navigator Company” as part of the growth strategy that aims to increase the company’s international reach and to expand into new business lines.
In terms of Navigator’s contribution to the Portuguese economy, the company is responsible for about 1% of the GDP and 3% of the exported goods, being the third largest exporter of the country. Furthermore, Navigator generates about 50% of the renewable energy produced in Portugal, which makes it a leader in the use of renewable sources in the country.
In terms of growth, Navigator revenues have been growing at an AAGR of 1,35%
for the past three years, while the industry’s average revenue has been growing at an AAGR of 0,30%. For the next two years, an AAGR of 2,71% is expected for the company, as world prices for UWF paper will remain in a positive trend and the tissue business will “take off”, growing 24% in 2018.
Recently, there have been two main events that have shaped the future of the company. In 2015, Navigator decided to enter the tissue segment as the market is growing at a fast pace. For that purpose, it acquired AMS Star Paper, a small private tissue producer located in Vila Velha do Rodão. In addition, in February 2018, the company sold the pellets business to Enviva, the largest player in the pellets market. In 2015, Navigator saw an opportunity to diversify its business and started the construction of a pellets factory in Greenwood, USA, with a predicted annual
Ranking Country Company
Revenue (US$) 1st USA International Paper 20,129 2nd USA Kimberly-Clark 16,732 3rd Sweden Svenska Cellulosa 12,288 4th Japan Oji Paper 10,724 5th USA Rock-Tem 10,243 6th Finland
UPM
Kymmene 9,914 7th Finland Stora Enso 9,872
8th UK Smurfit Kappa Group 7,931 9th Japan Sumitomo Forestry 7,784 10th Japan Nippon Paper 7,534 49th Portugal Navigator 1,293
Ranking Country Company
Prod.Cap. (M tons) 1st USA International Paper 23,315 2nd China Nine Dragons Paper 12,630 3rd USA WestRock Company 12,487 4th Finland UPM Kymmene 9,115 5th Finland Stora Enso 9,771 6th Japan Oji Paper 9,188 7th South Africa Sappi 7,306 8th UK Smurfit Kappa Group 7,000 9th UK DS Smith 6,802 10th Japan Nippon Paper 6,542 41st Portugal Navigator 3,135 Figure 1 – Producers of paper and pulp by revenue
Source: Pwc Global Forest, Paper&Packaging Industry Survey 2016 (2015 data)
Figure 2 – Producers of paper by total production capacity of pulp and paper (2015 data)
Source: RISI Technology Channels – The PPI Top 100 1 450 000 1 500 000 1 550 000 1 600 000 1 650 000 1 700 000 1 750 000 1 800 000
Figure 3 : Navigator Revenue evolution (thousand €)
“THE NAVIGATOR COMPANY” COMPANY REPORT
capacity of 450 thousand pellets. However, pellets market performance did not meet Navigator’s expectations and the company opted to divest the unit.
In 2016 (latest data available), the company employed 3,111 employees, a number which increased at an AAGR of 15,5% for the past four years. The labour force increase is justified by the growing number of new projects and investments – including, for example, the expansion of tissue production and the plantation of Eucalyptus in Mozambique. The trend will continue in the following years.
The company has a good and experienced management team that has been able to create value for shareholders in the past. However, some of the latest investment decisions, namely the pellets and Mozambique investments have not returned the expected value. The board of directors is composed by 14 elements, whose president is Mr. Pedro Pereira.
The company faces several risks specific to the industry, such as the occurrence of fires and production errors, pressure from competition that can eventually lead to lower margins and disruption of supplier services as Navigator depends on a small number of suppliers for the same service. Sale prices are positively correlated with global pulp and paper prices, therefore a sharp decrease in world prices can impact revenue levels severely and consequently, the value of the enterprise (see Sensitivity Analysis below). As 23% of revenue is sourced outside Europe, the company faces cashflow and exchange rate risks, especially in terms of $US. To mitigate these risks and financial risks – interest rate risk -, the company uses derivative financial instruments – swaps, forwards, caps and floors.
For the upcoming years, Navigator will continue to pursue its current strategy which is focused in organic growth and in improving production efficiency. These includes initiatives such as the expansion of the tissue and pulp production capacity and the development of the M2 cost cutting programme. Furthermore, the company intends to remain environmental-friendly and increase the use of renewable sources to produce energy, while reducing the use of CO2 intensive sources of energy.
Shareholder structure and share performance
The Navigator Company went public in July 2000 in the Euronext Lisbon and is currently a member of the PSI20 index. Over a 10-year period (since 2008), Navigator has registered a CAGR of 9,30%, while the index has registered a CAGR of -7,05%, especially due to Portugal’s financial crisis. Therefore, Navigator’s performance in the stock market has been justified by its intrinsic characteristics. Its strong cashflow generation and profitability measures have been very appealing to investors. Nevertheless, since the beginning of 2017 the Portuguese index has been registering significant improvements, with that year registering a growth of 15,15%, justified by the improvement in the overall economy and in the country’s
0 1 2 3 4 5 77% 9%14% Europe America Other markets Figure 5 – Revenue sourced by regions Source: Navigator Company
0 1 2 3 4 5 6 2009 2010 2011 2012 2013 2014 2015 2016 2017 2018
Figure 6 – Navigator share price evolution (€) Source: Bloomberg
Figure – PSI20 Index evolution (€) Source: Bloomberg 0 2000 4000 6000 8000 10000 12000
Figure 4 – Number of Employees (thousand)
Source: Navigator Company
Figure 7 – PSI 20 evolution (€) Source: Bloomberg
“THE NAVIGATOR COMPANY” COMPANY REPORT
rating. Furthermore, Navigator’s share performance also accompanied this trend during 2017, with the share price improving 30,23%. After the announcement of the pellets business sale in December 29th, 2017, the market
reacted positively with the share price increasing by 4,47% in two days (from €4,27 to 4,44€). An important phenomenon to note is that since the beginning of May this year, the share has valued 22%, going from 4,34€ to 5,34€ in little more than two weeks. This phenomenon is happening to several companies in the industry as world pulp and paper prices have been increasing sharply since last year, with the European BHK pulp and the A4 Copy paper Index reaching in the end of April this year, 847€/ton and 855€/ton, respectively.
The majority shareholder of Navigator is Semapa, owning 69,35% of the shares (of which 35,68% is held directly by Semapa and the remaining is held by Seinpar Investments and other companies of the group). Semapa is a portuguese conglomerate holding company with interests in the cement, pulp and paper and environmental services sectors in Portugal, including interests in companies such as Secil Group and ETSA. Semapa revenue and net income amounted to €2,16 billion and €124 million in 2017, respectively. Navigator contributed to 75% of the revenue and 98,5% of the net income. Therefore, Navigator is a strategically important company for the group. Also, the positive financial performance of the group is almost entirely driven by Navigator’s performance, as the cement segment of the group has been registering losses since 2012 (except for 2014) – Secil net income losses amounted to €1,1 million in 2017 – and the environmental segment is very small (corresponds to 1,3% of total revenue). Consequently, Semapa’s share capital of Navigator is expected to remain at this percentage for the following years. Nevertheless, Semapa used to held a higher percentage of the company – about 81% - until 2015, when it launched an exchange offer of its own shares for Navigator shares with the purpose of increasing
Navigator’s liquidity and reorganize both companies shareholder structures.
The CEO of Navigator is Mr. Diogo da Silveira since 2014, while Mr. Pedro Queiroz Pereira, the chairman of the board of directors and majority shareholder of Semapa, owns directly and indirectly 70,5% of the share capital.
Dividend Policy
Navigator’s dividend policy has consisted of distributing 80% to 120% of the net income of the year to its shareholders. In 2015, the payout ratio was equal to 222%
70% 4% 2% 2% 22% Semapa Banco BPI Zoom Lux Norges Bank Other Figure 9 – Navigator ownership structure (2017) Source: Bloomberg - 100,0 0,0 100,0 200,0 126,5 146,1 112,8 81,5 114,9 124,0 2012 2013 2014 2015 2016 2017
Pulp & Paper Environment
Cement Holding Company
Figure 10 - Semapa revenue by segment (million €) Source: Bloomberg 14,54 3,07 7,49 22,82 5,73 2,53 29,26 137 3,38 0 50 100 150 ROE ROA ROIC EBITDA margin Profit margin Dividend Yield Payout ratio Net Debt/Equity Net…
Figure 11 – Semapa 2017 key ratios (%) Source: Bloomberg
Figure 8 – European pulp and UWF paper price Index evolution
Source: Bloomberg 0 200 400 600 800 1000
FOEX BHK Pulp Index FOEX A4 Copy Paper Index
“THE NAVIGATOR COMPANY” COMPANY REPORT
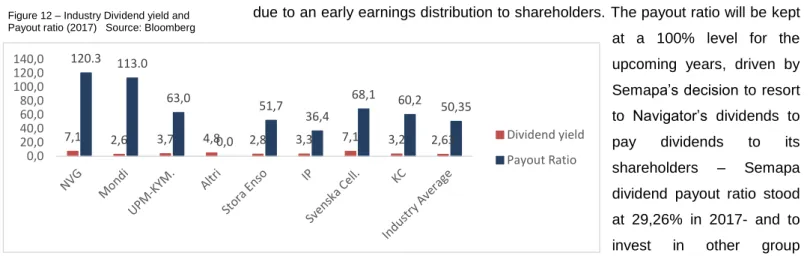
due to an early earnings distribution to shareholders. The payout ratio will be kept at a 100% level for the upcoming years, driven by Semapa’s decision to resort to Navigator’s dividends to pay dividends to its shareholders – Semapa dividend payout ratio stood at 29,26% in 2017- and to invest in other group companies which are not as profitable as Navigator, as mentioned before. Also, Semapa’s net debt to EBITDA is high, standing at a 3,39x level in 2017, which increases dependency on Navigator’s dividend payments. However, forecasts in this valuation include a drop in the dividend payout to a 75%-85% from 2022 onwards, since the company has been using debt, in part to finance the dividends payout, which is not sustainable in the long-term. The dividend yield has been varying between 7,1% and 15,8% in the period of 2012-2017. For 2018, a dividend yield of 5,8% has been considered. As seen in figure 12 ,when compared to direct peers and the industry average (2,89%), it is clear that Navigator pays one of the highest dividend yields.
Debt
As seen in figure 13, from 2014 to 2015, net debt increased from 312,9€ million to 692,4€ million mainly due to the issuance of new commercial paper programmes – in the amount of 225€ million to finance investment projects and dividends payment; and the renegotiation of the maturities of some of the outstanding commercial programmes – in the amount of 125€ million. Also, Navigator resorted to debt to partially finance the buying of AMS Star Paper, which was comprised of two loan agreements and one short term loan, in the total amount of nearly 25€ million. Nevertheless, in 2015, Navigator started a debt restructuring programme with the purpose of extending maturities and reducing interest expenses, which included the early repayment of Portucel Senior Notes 5.375%, in the amount of €350 million in 2015 and 2016. This allowed the company to save €16 million in expense costs. As debt increased, also net debt to equity ratio increased sharply from 22% to 57% in 2015. As mentioned before, Navigator has been contracting more debt to finance its investment projects and pay dividends to shareholders.
In 2017, net debt to equity ratio stood at a 61% level. When compared to direct competitors, Navigator ranks in the middle, as seen in figure 15. Furthermore, as the paper and pulp industry is a capital-intensive industry, we can expect net debt to equity to be at a high level, which is actually true as the industry’s average stood
7,1 2,6 3,7 4,8 2,8 3,3 7,1 3,2 2,63 120.3 113.0 63,0 0,0 51,7 36,4 68,1 60,2 50,35 0,0 20,0 40,0 60,0 80,0 100,0 120,0 140,0 Dividend yield Payout Ratio Figure 12 – Industry Dividend yield and
Payout ratio (2017) Source: Bloomberg
Figure 13 – Net Debt Evolution (thousand €) Source: Navigator Company
0 100 000 200 000 300 000 400 000 500 000 600 000 700 000 800 000
Figure 14 – Net Debt/Equity and Net Debt/EBITDA
Source: Navigator Company
23% 22% 57% 55% 61% 1,01 0,96 1,74 1,72 1,84 0% 50% 100% 150% 200% Net Debt/Equity Net Debt/EBITDA
“THE NAVIGATOR COMPANY” COMPANY REPORT
at 189,09% in 2017. Therefore, Navigator stands on a position of underleverage compared to the sector. However, it is expected that Navigator stays in this position as investment needs will start decreasing from 2019 until 2023 and dividend payout ratio will decrease from 2022 onwards. Consequently, debt will remain at lower levels. Even though net debt to EBITDA will reach 2.23x in 2020, it will drop below 2.0x from 2022 onwards.
Competition & Differentiation Strategy
The Paper and Pulp Industry is a capital-intensive and very competitive industry, in which world prices are defined in the market. Paper related outputs are considered undifferentiated goods, however Navigator has been able to differentiate itself from competitors by following a product and premium brands differentiation strategy based on product quality. Navigator premium goods represent 49% of the output, while the industry’s average is equal to 14%. The paper produced by the company is one of the highest-quality paper available in the market due to the high quality of the raw materials used in the production process. Furthermore, Navigator compares very favourably with its direct peers in terms of cost efficiency. Navigator has one of the highest EBITDA and EBIT margins – 24,3% and 15,5%, respectively – which leads to strong financial key ratios, as seen below in figure 20. Both paper mills are 100% integrated - pulp produced at the mills is immediately incorporated in paper production - which allows the company to save in pulp consumption costs (e.g. Navigator does not have expenses with transporting pulp from one mill to another and only buys 85% of the pulp to other suppliers). As seen in figure 16, integrated mills also require lower quantities of inputs to produce the same quantity of output. Therefore, costs of goods and services consumed – that include chemicals, pulp, energy and fuel consumed – of integrated mills are, on average, 15% lower than non-integrated mills. Another of the metrics used in the industry to benchmark cost efficiency is the “cash production cost”. The metric compares companies’ COGS. As seen in figure 18, Navigator has the lowest average COGS per ton produced – €208,4 - and the second lowest average operating expenses per ton - €440,3 - among its peers, which proves once again the company’s efficient cost structure.
In million € Navigator Mondi
UPM-KYM.
Altri Stora Enso
IP
Total Capacity (million tons) 3,1 9,6 13,7 1,0 22,0 28,4
UWF Paper Prod. Capacity 1,6 1,7 3,1 0,0 1,6 4,5
Pulp Production Capacity 1,4 4,2 3,6 1,0 9,1 3,7
Figure 18 – Paper and Pulp Direct Competitors Source: Bloomberg 19% 16% 12% 12% 10% 31% Navigator Mondi Stora Enso IP UPM-KYM. Other Figure 17 – 2017 European UWF Paper Market Share
Source: Navigator Company 58,7 32,9 3,4 103,2 39,2 155,0 18,0 722,1 189,3 0,0 500,0 1000,0 NVG Mondi UPM-KYM. Altri Stora Enso IP Svenska Cell. KC Ind. Avg.
Figure 15 – Industry Net Debt/Equity (%) - 2017 Source: Bloomberg 11,2 17,9 18,1 0 14 7 640 1280 1640 0 1200 1200 -350 150 650 1150 1650 Pulp UWF Paper Tissue Pulp UWF Paper Tissue
Energy Use (kWh/Adt) Fuel Use (Gj/Adt) Figure 16 – Integrated vs. Non-integrated mills Average Inputs consumption Source: Industrial Efficiency Data Tech base
100% Integrated Mills
“THE NAVIGATOR COMPANY” COMPANY REPORT
Publicly traded direct competitors include Mondi, UPM Kymmene OYJ, Altri, Stora Enso and International Paper in the UWF paper and pulp segments. Svenska Cellulosa and Kimberly-Clark are the competitors considered in the tissue segment. Other important tissue players such as Renova, Goma Camps or Industrie Cartarie Tronchetti could not be included in the comparison since they are private companies and do not disclose financial information. Factors such as the size of the company, position in the market, types of products sold and geographical have been taken into consideration when choosing peers.
Navigator is the number one player in the European fine papers market and the fourth player in the Iberian tissue segment, even though it has the lowest total production capacity among direct competitors – 3,1 million tons. In other regions/continents, Navigator’s market share is not relevant (below 1%).
In million € NVG Mondi UPM-KYM.
Altri Stora Enso IP Svenska
Cel. KC Industry Average Market Cap. 3050,8 10547,5 13818,4 1060,7 10425,6 19900,9 6039,0 35238,5 11456,0 ROE 17,2 18,9 11,5 26,0 10,6 39,5 7,8 43,5 8,96 ROA 8,6 9,2 7,2 7,7 5,2 6,4 3,5 15,3 7,38 ROIC 10,9 13,4 10,3 12,1 7,4 18,1 1,6 33,4 11,37 EBITDA margin 24,3 20,0 17,0 29,1 14,2 17,4 21,9 22,0 15,42 EBIT margin 15,5 14,1 12,5 20,9 9,3 10,8 15,1 18,1 8,92 Profit margin 12,6 9,9 10,0 14,6 7,1 6,6 11,3 12,1 6,34 FCF yield 6,0 4,1 9,1 10,0 6,0 1,5 6,2 5,0 5,71 Net Debt to EBITDA 1,7 1,0 0,2 2,1 1,8 3,6 1,8 1,7 2,7
When analysing key financial ratios, it is clear that Navigator ranks above the industry’s average in every ratio, with the exception of ROIC – 10,9%. When compared to direct peers, Navigator stands in an upper-middle position. All competitors, with the exception of Altri (which is a Portuguese pulp manufacturer), offer a more diversified range of products – including coated papers, paperboard&packaging and care products. Therefore, they are not as exposed to one single market – the UWF paper market – as Navigator, which carries higher
Tissue production capacity
0,1 0,0 0,0 0,0 0,0 0,0
Revenue 1633,1 7096,0 10010,0 656,1 10045,0 19286,1
Average selling price (€) 521,8 738,6 730,7 636,9 455,6 679,1
Operating expenses 1378,1 6139,0 8787,0 518,6 9207,0 18026,6
Cost of goods sold 652,2 3981,0 - 257,0 - 13571,2
Average Op. Expenses per ton
440,3 639,0 641,4 503,5 417,6 634,7
Average COGS per ton 208,4 414,4 - 249,5 - 477,9
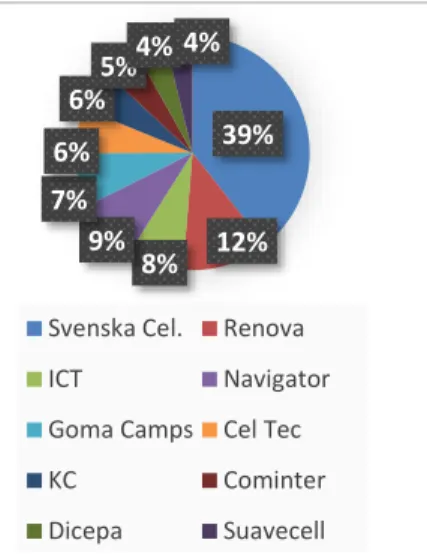
Figure 20 – 2017 Key Financial Ratios for the Industry Source: Bloomberg 39% 12% 8% 9% 7% 6% 6% 5%4% 4%
Svenska Cel. Renova
ICT Navigator
Goma Camps Cel Tec
KC Cominter
Dicepa Suavecell
Figure 19 – 2017 European Tissue Market Share Source: Navigator
“THE NAVIGATOR COMPANY” COMPANY REPORT
risks for the company. This is one of the reasons why Navigator decided to start producing tissue. Furthermore, both IP and KC are USA producers and are more exposed to this market – accounting for 75% and 46% of revenue, respectively – while the others are European producers mainly exposed to the European market. Most of north American mills are completely integrated and the market is well consolidated, with a small number of large players dominating the market. These factors allow producers as IP and KC to have high profit ratios, as seen in ROE, ROA and ROIC presented figures. The European market is highly fragmented. Most producers are small privately held companies.
In terms of capacity utilization rates, only Navigator’s tissue segment has a lower operating rate than the industry average. Navigator only started producing tissue in mid-2015; therefore, it has not yet completely established its market position. Furthermore, there was a fire in the Cacia mill in May 2016, which led to a production stoppage. Both paper and pulp utilization rate have stood at a 100% level for several years, which proves the manufacturing processes efficiency and the high-quality of the machinery used.
Macroeconomics
The Pulp and Paper industry is positively correlated with global cycles. As seen in figure 23, global real GDP growth has been at a 3,2% level, as economies recover from the latest financial crisis. Developing countries have a higher real growth rate than developed economies – 4,8% vs. 2,3%. The trend is expected to continue in the following years. Private consumption is positively correlated with GDP, with global and European consumption growing at an average 2% and 2,15%, respectively, since 2014.
A variable that is intrinsically correlated with paper consumption trends is digitalization. As digitalization increases, consumption of paper decreases, especially of printing&writing paper, as documents in paper format are substituted by the digital format. A proxy used for this variable is internet penetration rate. As seen in figure 22 , this rate has been growing fast since 2012, with 52% of world population using internet by 2017. An interesting variable to analyse is the number of computers per capita. Switzerland ranks in first place, with a value of 65; followed by the USA (57) and Sweden (51). On the one hand, real GDP and private consumption growth contribute positively for paper demand, as populations have more income to spend. On the other hand, digitalization contributes negatively for paper consumption. The latter effect will be more felt in developed countries, as seen in figure 24.
1 1 0,81 0,91 0,89 0,89 0 0,5 1 1,5 Paper Pulp Tissue
Capacity utilization rates Industry Average
Capacity utilization rates NVG Figure 21 – 2016 Capacity Utilization rates Source: RISI Info & Navigator Company
3,1% 3,2% 3,2% 3,8% 3,9% 3,9% 3,8% 4,7% 4,3% 4,4% 4,8% 4,9% 5,1% 5,1% 2,1% 2,3% 1,7% 2,3% 3,5% 2,2% 1,7% 0,0% 1,0% 2,0% 3,0% 4,0% 5,0% 6,0% 2014 2015 2016 2017 2018F 2019F 2020F Global Developing regions Developed regions
2,5 2,8 3,1 3,4 3,7 4,2 0,33 0,39 0,424 0,464 0,495 0,54 0 1 2 3 4 5 2012 2013 2014 2015 2016 2017 Number of users % global population 89% 87% 67% 60% 52% 0% 50% 100% North America Western Europe Eastern Europe Middle East Global
Figure 22 – Internet Penetration Rate (billion users)
Source: Internet Statistics
Figure 23 – GDP real growth rate Source: World Bank
Figure 24 – Penetration rate by region (2017) Source: Internet Statistics
“THE NAVIGATOR COMPANY” COMPANY REPORT
The Sector & Business Segments
UWF Paper
Navigator core business is the sale of uncoated woodfree/fine paper sheets, with revenue accounting for 73% of total revenue in 2016 or €1,9 billion (latest official data available). UWF paper is produced from bleached hardwood pulp which is produced using Eucalyptus wood. This type of paper is used primarily for “writing & reading” and properties include good strength and brightness.
Paper revenue has grown at an AAGR of 0,6% from 2012 to 2017. In the following two years, revenue is expected to grow at an AAGR of 4,8% as global paper prices will keep increasing. In the long-term, we expect prices to return to previous levels, with growth being driven by small production increases – AAGR will stand at 0,25%.
Paper is produced in two different mills, one located in Setúbal, with a production capacity of 820 thousand tons of paper and the other one located in Figueira da Foz, with a production capacity of 775 thousand tons. Total production capacity will increase slightly, as seen in figure ,as production processes become more efficient. Navigator owns 9 different brands of paper sheet: Inacopia, Pioneer, Target, Inaset, Soporset, Explorer, Multioffice, Discovery Navigator. Multioffice, Discovery and Navigator are premium brands.
UWF paper sale prices are positively correlated with global paper price indexes, mainly with the FOEX A4 B Copy EUR/ton, that fluctuate according to demand and supply. For the past years, Navigator has been selling paper at a discount, charging between 91% to 101% of the index value. Since the beginning of 2017, the index has been gradually improving, as seen in figure 27, as capacity has been closing all around the globe. The trend is expected to continue until the end of 2019.
Since 2008, the printing&writing paper market has been suffering major drawbacks due to the spread of digital contents and, consequently, the replacement of printed documents by the digital format. In 2016, global output amounted to 95 million. From 2012 to 2016, the global market slowed down at a CAGR of -1,9%, driven by the decrease in paper consumption in developed regions, with UWF paper slowing down at a more modest rate of -0,5%. Nevertheless, the growing popularity of 3D printing technology is one of the key trends for the future of the UWF paper market, valued at €2.4 billion in 2016 and expected to reach €11,2 billion by 2021. 1 150 000 1 200 000 1 250 000 1 300 000 1 350 000 1 400 000 2015A 2016A 2017A /F 2018F 2019F 2020F 2021F 2022F
Figure 25 – UWF paper revenue evolution (thousand €) 1555 1587 1578 1605 1618 162116231617 1520 1540 1560 1580 1600 1620 1640 2015A 2016A 2017F 2018F 2019F 2020F 2021F 2022F
Figure 26 – UWF paper production evolution (thousand €) 823 824 814 850 871 854 837 838 832 774 779 813 834 817 801 802 700 750 800 850 900 2015A 2016A 2017F 2018F 2019F 2020F 2021F 2022F
NVG sale price FOEX A4 Copy Paper Index Figure 27 – NVG paper price and FOEX A4 Copy
Index evolution (Eur/ton)
71% 17%
12%
Europe MEA America
Figure 28 – NVG’s UWF Paper Revenue by region
“THE NAVIGATOR COMPANY” COMPANY REPORT
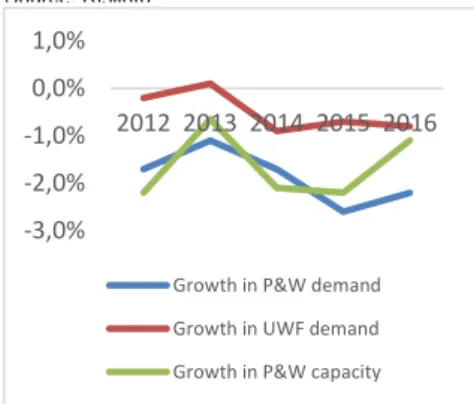
Between 2012 and 2017, not only UWF European paper demand decreased at a CAGR of -1,0%, with 2017 registering a slightly higher demand, but also production capacity decreased at an CAGR of -2,0%. Small suppliers have been exiting the market due to the latest consumption trends and exploring more promising markets, such as the Paperboard & Packaging market, which is estimated to grow at a CAGR of 4,2% until 2024, reaching €315 billion. As seen in figure 29, global capacity is decreasing at a faster rate than global demand, which is not the case for the European market, as seen in figure 30.
Even though projections point out to a global decrease in consumption of 2,2 million tons by the end of this year, there is a disparity between developed and developing regions. North America P&W paper demand has been shrinking at the highest rate, at a constant 4,5%-5% for the last three years, with the sub-segment UWF paper shrinking at an average 4%. This trend is expected to continue in the following 2/3years, with demand decline slowing down afterwards. Latin America demand for UWF paper has been shrinking in the past years going from 3,6 million tons in 2012 to 3,4 million tons in 2016 – a 5,5% decrease - but in 2017 this trend changed, and demand actually increased 1%. Projections point out to a steady increase of 1%-2% for the following 2 to 3 years.
Worldwide paper exports value amounted to €14,2 billion in 2016, which represents a 13,4% decrease from 2012 level. As seen in figure 32, the largest exporter is Germany (12,5% of exports), followed by China (11,8%). China has the highest surplus in the international trade of paper – €12,8 billion – which gives the country a strong competitive advantage. Also, production capacity is concentrated mainly in Asia (10,1 million tons produced annually), Europe (9,3 million tons) and North America (8,4 million tons produced). One of the current main challenges the industry is facing is the rise of global trading barriers and protectionism through the imposition of taxes and export duties. Namely in the USA, as capacity is closing at an YOY 2,8% rate or minus 100 million tons of paper per year, imports have increased sharply. To stop imports volume from exploding, US authorities have been accusing several foreigner suppliers, including Navigator, of dumping practices in the country and have charged them with anti-dumping duties. Figure 34 illustrates the import duty rates charged to foreigner producers.
Figure 29 – Growth evolution of global P&W and UWF paper demand and production capacity Source: Risiinfo 8,3 8,2 8,2 8,1 7,7 7,5 7 7 7 6,9 6,6 6,7 0 2 4 6 8 10 2012 2013 2014 2015 2016 2017
Production Capacity Demand
Figure 30 – European UWF Paper Demand and Supply
Source: Navigator Company -3,0% -2,0% -1,0% 0,0% 1,0% 2012 2013 2014 2015 2016
Growth in P&W demand Growth in UWF demand Growth in P&W capacity
1,74 1,64 1,34 0,75 7,5 0,0 10,0 20,0 Germany China USA Finland Sweden
Figure 32 – Top country exporters of paper by revenue (€ billion) 30,9 31 32 31,6 30,9 14,816,4 14,515,8 15,316,4 14,113,8 14,714,2 0 10 20 30 40 2012 2013 2014 2015 2016
Production (million tons) Globally Traded Quantities (million tons) Globally Traded Quantities (billion €)
Figure 31 – UWF paper global production and international trade Source: FAO United Nations
“THE NAVIGATOR COMPANY” COMPANY REPORT
Pulp
Navigator also produces and sells Bleached Eucalyptus/Hardwood Kraft Pulp, being the European leader and the fifth leading producer worldwide. Total output in 2017 amounted to 1,48 million tons, of which nearly 1,17 million tons or 80% of the output was integrated in the production of paper. The company’s pulp market share in Europe is less than 1% as supply amounted to 311 thousand tons in 2017. As expected, revenue level is relatively low, standing at €151,4 billion in 2016 (latest official data available).
Pulp is produced at three different mills. Setúbal mill - with an annual production capacity of 580 thousand tons - and Figueira da Foz mill - with an annual production capacity of 550 thousand tons - are completely integrated. The third mill, located in Cacia, has an annual production capacity of 340 thousand tons. A portion of the latter’s output is sold to other European paper producers (93% of pulp revenues).
Sale prices are also correlated with the respective European Index – the FOEX BHK Pulp Index (€/ton). For the past years, Navigator charged prices that accounted for 79% to 91% of the index value. Since the beginning of 2017 there has been an upward trend in global pulp prices that is expected to continue until the end of 2019. From that year onwards, the index prices are expected to go back to previous values and Navigator’s pulp revenue will decrease, as seen in figure 35. From 2012 to 2016, the global BHK pulp market grew from 129,5 million tons to 139,0 million tons – at an CAGR of 1,8%, as seen in figure 38.
China has been the largest producer of pulp – 99,3 million tons of output in 2016 – and the largest consumer of pulp worldwide accounting for nearly 34% of global demand. From 2006 to 2016, China’s
Australia Paper 222% Suzano 22% Navigator 8% APRIL Indonesia 23% APP Indonesia 13% Asia Symbol 91% APP China 156% UPM China 326% Sun Paper 326% 1,47 1,21 0,7 0,46 0,36 0,0 10,0 20,0 USA Germany France Italy China
Figure 33 – Top country importers of paper by
import value (€ billion) Figure 34 – Imports duty rates charged by USA authorities
0 50 000 100 000 150 000 200 000 250 000 2015A 2016A 2017F 2018F 2019F 2020F 2021F 2022F
Figure 35– Pulp revenue (thousand €)
1 171 1 179 1 169 1 270 1 3361 410 1 413 1 415 253 291 311 245 210 141 141 142 0 500 1 000 1 500 2 000 2015A 2016A 2017F 2018F 2019F 2020F 2021F 2022F
Pulp used by Navigator Pulp sold Figure 36 – Pulp production (thousand tons)
706 628 724 814 871 711 676 662 557 520 619 696 745 608 578 566 0 100 200 300 400 500 600 700 800 900 1 000 2015A 2016A 2017F 2018F 2019F 2020F 2021F 2022F
NVG's pulp sale price FOEX BHKP Index
“THE NAVIGATOR COMPANY” COMPANY REPORT
demand rised from 7,9 million tons to 21,1 million tons, which represents a 21,7% CAGR. Europe comes in second place, with a demand of 18,9 million tons in 2016. However, consumption in Europe has been falling since 2006 at an CAGR of 2,0%. North America comes in third place, with a consumption of 7,7 million tons in 2016 which represents a decrease of 1,2 million tons when compared with 2015.
In terms of international trade, the largest exporters of paper are South America and Europe; while the largest importers are Asia and Europe. North America has the highest production capacity, followed by Europe. However, given the recent paper capacity closures in Europe and in the USA, we can expect pulp imports from Asia to increase in the medium-term.
Tissue
In 2015, Navigator decided to diversify its business by entering the tissue market. The company acquired AMS Star Paper, a small Portuguese tissue producer located in Vila Velha do Rodão, for €80 million. At the time, the company had a production capacity of 59 thousand tons of tissue and had developed a partnership with one of Navigator’s competitors, Altri. After acquiring AMS, Navigator decided to expand the capacity to 70 thousand tons and by the end of the year output amounted to 68 thousand tons - 33 thousand reels and 35 thousand finished products. The majority of reels produced is used internally in converting goods production. Only 5% to 20% is sold to other tissue producers. Products are included in consumer tissue (sold to supermarkets and stores) or in away-from-home segment (sold to hotel chains), accounting for 75% and 25% of revenue, respectively. In 2016, revenue level stood at €67,45 million. In 2022, tissue revenue will account for 10,9% of total revenue. It is important to note that there are synergies with other core businesses, as tissue is also produced from Eucalyptus wood.
Currently, nearly 99% of revenues are sourced from the Iberian market, however the company intends to expand to other regions, including the Middle East.
129,5 130,3 135,5 136,3 139 47,2 49 50 51,9 54,3 24 23,2 23,2 27,8 27,8 0 50 100 150 2012 2013 2014 2015 2016
Production (million tons) Globally Traded Quantities (million tons) Globally Traded Quantities (billion €)
51,6 26,3 26,5 31,8 5,7 0,92 27,1 18,8 14,3 20,3 4,9 15,1 0 10 20 30 40 50 60 North America South America Asia Europe
Exports Imports Production
Figure 38 – 2916Global pulp production. Imports and Exports Source: FAO United Nations
Figure 39 – 2016 Pulp Production, Exports and Imports by region (million tons) Source: FAO United Nations
0 50 000 100 000 150 000 200 000 250 000
Reels sales Finished goods sales
33 47 56 76 125 127 130 130 35 42 49 69 107 114 124 134 0 50 100 150
Reels Finished goods Figure 40 – Tissue revenue (thousand €)
“THE NAVIGATOR COMPANY” COMPANY REPORT
Tissue has become one of the most promising markets within the Paper and Pulp Industry, as “traditional” paper segments have lost relevance in a more technological world. The segment average annual global growth rate has been equal to 3,5% since 2006, reaching a total amount of 36,4 million tons in 2016. This growth is driven by Eastern Europe and Asia’s increasing demand. Nevertheless, North America is still the largest consumer, accounting for 25% of demand, followed by Western Europe (18,3%) and China (21,3%), as seen in figure 42. These markets, except for the Chinese one, are growing at very modest rates –an AAGR of 1,5% and the second, at an AAGR of 1%. Consequently, in the next decades, developing countries’ demand will surpass developed countries´ demand, since Eastern European market is expected to keep growing at an AAGR of 4,5% and Asia, at an AAGR of 5%, with Chinese demand growing at an AAGR of 8%. Europe’s consumption amounted to 8,65 million tons of tissue with the largest consumer being Germany (17% of consumption), followed by the UK (13%), France (10%) and finally, Iberia (10%). According to Navigator, the UK tissue market could be one of the most attractive markets for the company, as it is one of the largest European markets and most of UK’s tissue producers are non-integrated which means that Navigator has a competitive advantage regarding cost efficiency. In Europe, and particularly in the Iberian Peninsula, supply has been increasing in the latest years due to more aggressive competition and new capacity entering the market – in 2017, capacity increased by 241 thousand tons. In addition, pulp prices are expected to keep increasing at least in the next two years which will lead to further pressure on European tissue producers´ profitability margins.
Navigator faces a competitive market with well-established players. The largest producer within Iberia is Svenska Cellulosa, followed by Renova and Industrie Cartarie Tronchetti. Navigator is currently the 4th largest player in Iberia,
nevertheless, with the implementation of the tissue line at Cacia mill, Navigator’s production capacity will surpass Renova’s, possibly becoming the second largest player.At a global scale, Navigator is a small player, as seen in figure 45. Capacity utilization rates in this segment are relatively low when compared to other segments as they stand at 89% in Europe, mainly because demand has been growing at a slower rate than new capacity is entering the market. In the long term, European producers will have to look for opportunities outside the continent, especially in developing countries where tissue paper consumption per capita is expected to increase in a few years while disposable income and urbanization rates grow and health and hygiene conditions improve.
25% 21% 18% 12% 11% 13%
North America China Western Europe Asia South America Other Figure 42 – 2016 Consumption by Region Source: Risiinfo 2% 8% 1% 6% 6% 6% 0% 5% 10% North America China Western Europe Eastern Europe Asia Africa
Figure 43 – 2006-2016 Consumption AAGR by Region Source: Risiinfo 616 187,0 120 135 115 97,0 90,0 78 67 60 0 200 400 600 800 Svenska Cel. Renova ICT Navigator Goma Camps Cel Tec KC Cominter Dicepa Suavecell
Figure 44 – Iberian Production Capacity in 2017 (thousand tons) Source: Navigator Company
4550 3817 2770 2537 1370 1150 1020 720 700 650 602 0 1000 2000 3000 4000 5000 ESSITY KC APP GP P&G Hengan Sofidel CMPC Tissue WEPA Kruger Metsa
Figure 45 – Production capacity of the Largest tissue producers (thousand tons) Source: European Tissue
“THE NAVIGATOR COMPANY” COMPANY REPORT
Energy
During pulp and paper production process, energy is also produced. Nearly 78% of the energy produced is sold to the national grid and the remaining is used by Navigator. The company has been selling energy at a subsidized price to the national grid, as part of a plan defined by the government to promote the optimization of the energetic resources in Portugal. However, since 2012, due to the economic and political crisis and the presence of Troika in the country, renewable energy regulation regarding energy produced by co-generation plants has changed and the subsidized prices have become lower for plants with a certain age of production activity. This change in the value of subsidized prices has already happened for two of the plants, Cacia and Figueira da Foz plants, which have already changed to a self-consumption basis since it became more expensive for the company to sell energy and buy it back than to consume it directly. In 2020, Setúbal mill will be affected by the change as well, so forecast include the change to a self-consumption basis by that year. Total revenue stood at €115,4 million in 2016, registering a CAGR of – 20% since 2012. Energy revenue accounts for 6% of total revenue.
Total energy produced by Navigator has been reducing since 2013 at a CAGR of -3,4%, as seen in figure In 2017, the quantity amounted to 2226 GWh. However, as explained above, with the decrease in subsidized prices, Navigator has been reducing the quantities sold to the grid, as seen in figure 47, which has a positive impact in costs related to energy consumption. However, the price decrease will have a negative impact in 2018-2022 EBITDA of €22 million.
Energy is generated by seven generation units located in Setúbal, Figueira da Foz and Cacia. Three different generation processes are used - natural gas cogeneration process, biomass cogeneration process and from biomass power plants. In addition, Navigator is increasing the use of renewable sources of energy and decreasing the use of CO2 intensive sources, as seen in figure 48.
Forestry
Navigator manages 118 thousand hectares of forestry through the subsidiary “Viveiros Aliança”, which owns four nurseries located in Pegões, Constança, Penamacor and Eixo. About 74% of the hectares are planted with Eucalyptus and the company uses almost 100% of the wood that can be extracted from this tree in pulp production. However, Navigator still has to buy wood to national and
123 742 115 417 112404 107520 101719 98269 91810 83834 58 60 62 64 66 68 70 72 0 50 000 100 000 150 000
Revenue Subsidized sale price
1961 1641 1653 1654 1615 1404 1350 1290 330 473 573 612 692 936 1019 1099 0 500 1000 1500 2000 2500 3000
Energy sold to the grid Energy used by NVG
12171 2351 3031 3291 3561 3791 4041 428 1074 879 920 934 948 957 962 957 0 500 1000 1500 2000 2500 3000
from biomass from gas natural cogeneration
Figure 46 – Revenue (thousand €) and price (€) evolution
Figure 47 – Quantities produced by destination (tons)
Figure 48 – Quantities produced by source (tons)
Navigator produces 5% of the energy generated in the country
“THE NAVIGATOR COMPANY” COMPANY REPORT
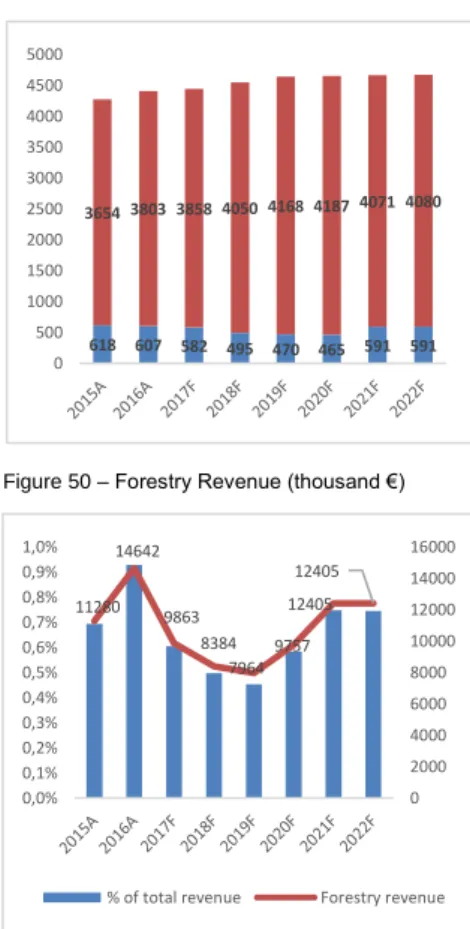
international producers from Spain, Uruguai and Brazil. In 2016, the amount of wood extracted amounted to 607 thousand m3 of a total of 4,5 million m3 needed. Apart from Eucalyptus, there are 12 million species planted. Therefore, forestry sale products included, in 2016 (latest data available), 14 thousand arrobas, 109 thousand litres of wine and 28 thousand tons of softwood. In 2016, revenue amounted to 14,6 million €. Even though forestry revenue varied over the years, as seen in figure 50, it has always been below 1% of total revenue. Therefore, forestry sales are not significant. Only Eucalyptus wood extraction is an important activity for the company, as wood is the main raw material used in pulp production.
Every year, large extents of Portuguese forests are burned down. Only in 2016, a total area of 2,497 hectares was affected by fires, which corresponds to 2.1% of the managed area. In 2017, the situation deteriorated even further due to the quantity of fire occurrences during June and October that destroyed thousands of hectares. Therefore, 2017 and 2018’s forecasted figures are lower than 2016’s, as seen in figure 49. To mitigate the fire risk, the company invests 3 million € in fire prevention, yearly. Furthermore, it has become very difficult for forestry managers to get permission from the ICNF – Institute of Nature Conservation and Forests -, to replant and plant new Eucalyptus areas in Portugal, as a regulation limiting the planted area has been issued by the government in August 2017 (law nº77/2017). Therefore, Navigator’s plantation Eucalyptus in the country is limited to the current managed areas. Consequently, yearly m3 of extracted wood will remain at current levels.
Mozambique Project
One of the constraints of European woodland, specifically the Portuguese one, is that rents are not as productive as in other parts of the world, such as South America or Africa. Wood can only to be extracted from the same “place” with a time lapse of 12 years. In other regions, such as Brazil or Mozambique, this period is usually equal to 8 years. Therefore, Navigator decided to plant an Eucalyptus nursery in Mozambique. Initially, the project included the plantation of 356 thousand hectares of land in Zambezia starting in 2014 and the construction of a pulp factory with an annual production capacity of 1,5 million tons in 2023. The extracted wood would then be used to produce pulp that would be exported to Asia, namely China. However, by the end of 2017, the company had only forested 11,7 thousand hectares of land and the decision to construct the mill had been differed to 2023. The investment is being supported by the World’s Bank International Finance Corporation, which has acquired 20% of Portucel Mozambique share capital so far, even though it has committed to acquire a higher percentage of the capital. Given the current political and economic instability in the
3,0 6,9 11,7 15,6 19,5 23,4 26,4 29,4 32,4 35,4 0,0 5,0 10,0 15,0 20,0 25,0 30,0 35,0 40,0 618 607 582 495 470 465 591 591 3654 3803 3858 4050 4168 41874071 4080 0 500 1000 1500 2000 2500 3000 3500 4000 4500 5000 11280 14642 9863 8384 7964 9757 12405 12405 0 2000 4000 6000 8000 10000 12000 14000 16000 0,0% 0,1% 0,2% 0,3% 0,4% 0,5% 0,6% 0,7% 0,8% 0,9% 1,0%
% of total revenue Forestry revenue
Figure 49 – Wood extracted and wood bought (m3)
Figure 50 – Forestry Revenue (thousand €)
Figure 51 – Eucalyptus Planted area (thousand hectares)
“THE NAVIGATOR COMPANY” COMPANY REPORT
country, due to rising debt levels, rising US interest rates, lower commodity prices, lower demand from international trading partners and fall in investment levels, there has been a delay in the progress of the project. Furthermore, in 2016, the International Monetary Fund and the World Bank have discovered unrevealed public debt in the amount of 1,4 trillion USD$ or nearly 11% of the GDP and decided to stop financing the country. By the end of 2017, the assets related to the Mozambique project had been impaired in 99% of the initial value recorded in the balance sheet (almost in 95€ million), as Navigator considers that given the current country conditions the project will be negatively affected, and Navigator will not be able to recover the initial investment. However, the company has also publicly stated that intends to keep investing in Eucalyptus plantation for the following years, but at a much slower pace. Yearly capital expenditure will be kept at 10€ million. Furthermore, after interviewing the company’s Investor Relations, it is very unlikely (probability below 5%) that Navigator will construct the pulp factory in 2023. Therefore, a conservative approach has been conducted and cashflows related to that part of the project have not been included in the valuation. The project has been valued at book value. Nevertheless, the valuation includes the forestation of the remaining hectares, however at a slower pace, as mentioned before, reaching a total planted area of 35,4 thousand hectares in 2023. Since the mill will not be constructed, Investor Relations has stated the company is evaluating the costs of transporting the wood extracted from Mozambique nursery to Portugal. The wood will then be used to produce pulp in Portuguese mills. This is the most likely scenario to happen since demand for wood is much higher than current extraction level and costs related to wood acquisitions to third parties are very high (between 34% and 37% of the cost of inventories sold and consumed). Furthermore, tissue production will require an increase in pulp production and consequently in wood procurement.
Pellets Project
Pellets are biofuels created by the compression of an organic material or biomass.
Wood pellets are produced from industrial wastes from the manufacturing of wood products. Pellets are used to generate electricity and residential heating.
The pellets market has been growing at a large scale, especially in Western Europe and North America, for both industrial and commercial purposes. The global wood pellet demand amounted to 8,15 billion € in 2017 and forecasts point out to a total market size of 18,6 billion € in a ten-year time, which accounts for a CAGR of 8,7%. The main driver for this phenomenon is the rise in the prices of other fuels/substitutes, such as natural gas and oil for the past years and the uncertainty
292319 346373 400427 454 454 0 100 200 300 400 500 2023F 2024F 2025F 2026F 2027F 2028F 2029F 2030F
Figure 52 – Wood extraction (m3)
73% 9% 8% 10% Western Europe Asia North America Other
Figure 53 – 2017 Pellets consumption, by region
“THE NAVIGATOR COMPANY” COMPANY REPORT
that surrounds both prices in the future. In addition, pellets are an environmental friendly source of energy, so the consumption has been stimulated by governments. Developing countries contribute to only 1% of consumption, as supply is low and environmental issues are not a priority. Therefore, growth in the medium to long term will be driven by demand in developed economies. Furthermore, the Asian market, is expected to grow at a CAGR of 9,9%.
The largest players are located in both South and North America, namely in Chile, Brazil and Canada. The USA is the largest producer worldwide, with a production capacity of 9,2 million tons in 2016 that will increase to 14,6 million in 2020. These countries also play an important role in international trade. Particularly, exports from the USA to Europe amounted to 4,1 million tons or 71% of Europe’s total import volume in 2015, as Europe is the largest importer – imports amounted to 5,8 million tons. Nevertheless, supply has been increasing as wood extraction levels keep increasing and more manufacturers, namely in Sweden, are looking for innovative opportunities within the wood products market.
Navigator decided to enter the pellets segment in 2015 and started building a pellets mill - Colombo Energy - in Greenwood, USA, with a final annual production capacity of 450 thousand of industrial and domestic grade pellets. Initial investment amounted to €112,8 million. Production started in September 2016 and revenue amounted to €1,5 million in 2017. However, Navigator´s expectations regarding the segment performance were not achieved and the company decided to sell the factory in the end of 2017 to Enviva, a Northern American wood pellets producer that is one of the main players in the global market. The sale was finalized in mid- February this year for USD$134,5 million (€107,7 million), generating a gain of €15,2 million in 2018’s EBITDA, as the pellets assets book value were valued at nearly €92,5 million. Navigator will receive the proceeds in two tranches, the first one, in the amount of USD$89,5 million, this year (66,5% of the total value); and the second tranche, in 2023. The net present value of the project has been computed in order to understand how much value the pellets segment has created for Navigator. Therefore, the NPV includes cash inflows and outflows related to the initial investment, recurring investments, revenues, operating costs and disposal proceeds of the segment.
To compute the discount rate, a WACC based on the specifics of the pellets industry has been calculated. Most of the pellets producers are privately held companies, but 18 publicly traded peers specialized in pellets production and located mainly in North America have been chosen. After collecting information regarding the unlevered beta, capital structure and cost of debt of each of the peers, the group variables’ average were computed and used as proxy for Colombo’s Energy
2,2 1,3 0,7 0,5 0,35 0 0,5 1 1,5 2 2,5
Figure 55 – 2017 US largest pellets producers capacity (million tons)
0,4 3 3 10,7 8,5 0 2 4 6 8 10 12 Oceania South America China Western Europe North America
Figure 54 – 2016 pellets production, by region (million tons) -126847,88 19195 -23504 -12477 -6381 -2726 -1919,5 134500 -200000 -100000 0 100000 200000 Investment Revenues Expenses Cost of revenues Payroll costs Enerpar fee Other expenses Disposal
Figure 56 – Cashflows of the pellets project (thousand $US)
“THE NAVIGATOR COMPANY” COMPANY REPORT
variables - 1,91; 42,01% and 4,4% respectively. To compute the cost of equity, the Capital Asset Pricing model was followed. The risk-free rate used was the 10y US government AAA bond yield and the market risk premium was computed as the average of the difference between the monthly return of the MSCI World in US$ and the monthly risk-free yield, from January 2015 to January 2018. The cost of equity was equal to 14,58%. Finally, a WACC of 11,10% was obtained. Afterwards, the Net Present Value of the project was computed at 2015 values, by discounting the cash flows generated between 2016 and 2023 by the WACC, taking into consideration the numbers of years elapsed. Finally, a NPV of USD$-37,29 million was reached, which corresponds to €-36,01 million, taking into consideration yearly exchange rates for the periods. In conclusion, the pellets project has a negative NPV, which means that it destroyed value for Navigator. Furthermore, after the announcement of the sale of the pellets business on the 29th of December,
Navigator’s share price appreciated by 4,47% in two days, going from €4,25 to 4,44€, which shows the market support of Navigator’s divestment decision.
Main Value Drivers
CAPEX
Investment in machinery and in efficient production processes is essential for companies to remain competitive in this industry. Since 2015 that Navigator has been investing at a faster pace, with CAPEX amounting to €455,9 million in 2015-2017. The company has engaged in several projects that require large amounts of capital expenditure, as seen in figure 58. Currently, the company is engaged in a cost cutting programme - M2 -, which aims to reduce variable costs in 100 million €, in 2015-2019.
Projected CAPEX includes the creation of a tissue line in Cacia, in the total amount of 120 million €, from which expenses have been spread between 2017 and 2018. The new line will start operating in mid-2018; and the expansion of pulp production capacity at the Figueira da Foz mill from 580 to 650 thousand tons, which investment amounted to 96 million €.
Furthermore, according to the company, between 2018 and 2022, Navigator will spend a total 200 million € in CAPEX, including both projects mentioned above. On average, depreciation has been higher than investment in capital, which means that Navigator has not been able to “refurbish” its operating assets. By comparing Navigator reinvestment rate with the direct peers’ rate, as seen in figure 59, we can state that only Mondi is in a similar situation, as it has registered a negative reinvestment rate (-2,45%). Other competitors are reinvesting at high rates,
NVG -3,50 Mondi -2,45 UPM-Kym. 4,26 Altri 26,03 Stora Enso 5,11 IP 25,32 Svenska Cell. 256,20 KC 343,85 Mozambique 50,3 Tissue line 34,4 Pellets 114 Pulp 42 0 50000 100000 150000 200000 250000 D&A CAPEX
Figure – 57 CAPEX and depreciation evolution (thousand €)
Figure 58 – Past CAPEX projects (million €)
“THE NAVIGATOR COMPANY” COMPANY REPORT
especially the tissue competitors, with rates of 256,20% and 343,85%. Navigator’s situation is unsustainable in the long term; therefore, from 2023 onwards, projected CAPEX will be higher than depreciation.
Revenue
Revenue key drivers include machines’ capacity utilization rates, quantities produced and sale price. Firstly, for all segments, quantities produced will vary in line with the investments in CAPEX – both expansion and maintenance - within that segment. For both pulp and paper segments, capacity utilization rates are forecasted to remain at 100%. Events that cause lower rates – fire, machines damage - are impossible to predict. For the tissue segment, reels capacity utilization rate will reach 100% in 2020 and finished goods capacity utilization rates will reach 100% in 2022, since as years go by, Navigator
will be able to maximize production.
As seen in figure 60, pulp capacity will increase by 5,2% from 2016 to 2019 due to the investment projects previously mentioned. Paper production capacity will increase slowly, as smaller investments are made to improve production efficiency, reaching 1,617 million tons in 2022. Tons of paper produced per ton of pulp used will be kept at 0,20 for the Figueira da Foz mill and at 0,23 for Setúbal mill. Tissue production will increase from 89 thousand tons in 2016 to 240 thousand tons in 2020, as the new Cacia tissue line will start operations this year.
In terms of pricing strategy, a conservative approach has been followed and forecasts regarding pulp and paper price charged are in line with past figures, with pulp sale price estimated at 85,5% of the FOEX BHK pulp index forecasted; and paper sale price estimated at 95% of the FOEX A4 B Copy index forecasted. For the tissue segment, there is a different price for reels and finished goods, with the latter being higher than the first, as seen in figure 61. As Navigator just entered the market two years ago, increases in both prices are expected to be in line with peers’ pricing strategy. Energy prices will depend on the subsidized price that the government will pay Navigator. As prices will keep decreasing until 2019, reaching a value of 63€ per GWh in that year, they will increase again in 2020 to 70€ per GWh, as Setúbal natural gas cogeneration unit will switch to a self-consumption mode.
In terms of profitability measures, ROE, ROIC and EBITDA margin will reach the highest values in 2018 – 18,7%; 13,5% and 26,5%, respectively -, as global pulp and paper prices are forecasted to increase and Cacia tissue line starts to operate. In the following years, these ratios will return to previous levels.
1424 1470 1480 1515 1546 1550 1554 1557 1571 1587 1608 1605 1618 1621 1623 1617 68 89 105 144 231 240 254 264 0 500 1000 1500 2000 2015A 2016A 2017 2018F 2019F 2020F 2021F 2022F
Tissue Production UWF Paper Production Pulp Production
Figure 60 – Production capacity by segment (thousand tons) 832 774 779 813 834 817 801 802 557 520 619 696 745 608 578 566 63 70 68 65 63 70 68 65 0 100 200 300 400 500 600 700 800 900 2015A 2016A 2017 2018F 2019F 2020F 2021F 2022F
UWF Paper Price Pulp Price Energy price 0 200 400 600 800 1000 1200 1400 1600 2015A 2016A 2017 2018F 2019F 2020F 2021F
Tissue Average Price Reels price Converted goods Price
Figure 61 –Average segments prices (€) and profitability ratios (%) 0,0% 5,0% 10,0% 15,0% 20,0% 25,0% 30,0% 2015A2016A 2017 2018F 2019F 2020F 2021F 2022F ROE ROIC EBITDA margin
“THE NAVIGATOR COMPANY” COMPANY REPORT
Costs
Cost of inventories sold and consumed accounted for 54% of total costs in 2016. Two of the raw materials, wood and chemicals, account for nearly 50% of COGS as they are indispensable to production. Since expenses related to these materials have increased at a fast pace until 2014, Navigator launched a cost cutting programme in 2015 focused primarily on variable costs, especially on wood, chemicals, water and fuels. In2015-2017, Navigator was able to save 48€ million. Wood costs depend on the difference between tons of wood needed and tons of wood extracted from own lands. As in 2023, Navigator will start extracting wood from Eucalyptus planted in Mozambique nursery, wood purchased to suppliers will decrease. Consequently, from 2016 to 2023, wood costs will decrease 6,1%. Energy costs will also decrease since own consumption of energy will increase due to changes in subsidized prices. Therefore, between 2016 and 2020, these costs will decrease by 4,0%.
In addition, operating costs related to personnel expenses – wages, pensions – are expected to increase in the following years as Navigator is recruiting more employees, especially in the tissue and forestry segment. However, as wages are lower in Mozambique, average salary will decrease in 2018 and 2019 and increase slowly in the following years, in line with inflation.
Furthermore, transportation costs have a substantial role in the industry, as products are transported through maritime transport and by road, to all parts of the globe, creating a necessity of having an organized logistics hub around the world. In 2016, maritime transport accounted for 65% and 85% of paper and pulp exports, respectively. Tissue is almost 100% transported by road as consumers are mainly located in Portugal and Spain.
Transportation costs have accounted for 9%-12% of Navigator’s total costs from 2014 to 2016. These costs are highly dependent on fuel world prices. Given the low oil prices since 2014, transportation costs have also decreased. However, in the long-term fuel prices will increase and consequently, transportation costs will increase. Moreover, expenses with advertising have substantially increased in 2016 – growing 18,8% - when the company started selling tissue products. Since tissue is a more “differentiated” and client focused product, advertising starts to gain a relevant role in Navigator’s business model. Advertising costs will grow in the future as Navigator becomes a main player in the Iberian tissue market.
In terms of cost structure, variable costs accounted 118% of fixed costs in 2016. The ratio will steadily decrease, as the company is reducing variable costs, until it reaches 109% in 2022. 47,0% 48,0% 49,0% 50,0% 51,0% 52,0% 53,0% 54,0% 55,0% 56,0% 57,0% 1100000 1150000 1200000 1250000 1300000 1350000 1400000
Total Costs % COGS
0,0% 5,0% 10,0% 15,0% 20,0% 25,0% 30,0% 35,0% 40,0% 600000 620000 640000 660000 680000 700000 720000 740000 COGS Wood
Natural gas Other fuels Chemicals Pulp 0,0 1,0 2,0 3,0 4,0 5,0 0,0 50000,0 100000,0 150000,0 200000,0 250000,0 Payroll costs Average salary Number of employees 0,00 10,00 20,00 30,00 40,00 50,00 60,00 70,00 95000 100000 105000 110000 115000 120000 125000 130000 135000
Transportation costs Brent oil price
Figure 65 – Transportation costs vs oil price Figure 64 – Employee costs (thousand €) Figure 63 – COGS by item (thousand €) Figure 62 – Total costs (thousand €)