i
Implementing a Bank Sales Analytics Solution
and a Predictive model for the Next Best Offer
Ziad El Abbass
Internship Report
Internship report presented as partial requirement for
obtaining the Master’s degree in Advanced Analytics
i
Title: Implementing a Bank Sales Analytics Solution and a Predictive Model for the Next Best Offer
Subtitle: Internship Report
Student
full name Ziad El Abbass
MAA
ii
NOVA Information Management School
Instituto Superior de Estatística e Gestão de Informação
Universidade Nova de LisboaIMPLEMENTING A BANK SALES ANALYTICS SOLUTION AND A
PREDICTIVE MODEL FOR THE NEXT BEST OFFER
by
Ziad El Abbass
Internship report presented as partial requirement for obtaining the Master’s degree in Advanced Analytics
Advisor: Mauro Castelli
iii
DEDICATION
“This document is dedicated to my expired dear Father Abdelhai El Abbass who, despite his illness, always craved to support me endlessly so he can achieve his dream of seeing me shine of success.”
iv
ABSTRACT
In the banking industry, the quantity of information that is processed is huge. Knowing also that clients are doted with changing needs every time, companies must adapt their approaches to attract clients with the best offers. That can be done by various machine lear ning and data mining techniques that enable them to understand better the clients. Also, internally, banks should be equipped with fast and efficient processes that enable them to take quickly the best decision. That is why real-time reporting tools should be implemented as an upper layer of the data sources. In this optic, this internship report is presenting 2 ambitious projects that aim to leverage Millennium BCP bank to a greater level in Analytics and Data Science. The first one is about building a Sales Analytics Solution to track weekly sales of retail products in the bank. The second one is about building a mechanism that will help reach to each client’s best adequate product to recommend.
KEYWORDS
Sales; Marketing Campaign; Recommendation System; Reporting; Next Best Offer; Recommendation System
v
INDEX
1.
Introduction ... 1
2.
Literature review ... 2
3.
The CRM Sales Engine in Millennium bcp ... 4
3.1.
Overview ... 4
3.2.
Comercial Timeframe ... 6
3.3.
The CRM Team and Big Data ... 7
4.
The CRM Sales analytics as a new solution for sales tracking ... 9
4.1.
Technological Presentation ... 9
4.1.1.
SAS® Software ... 9
4.1.2.
Microsoft® Power BI ... 10
4.1.3.
Microsoft® SQL Server ... 11
4.2.
Data sources and elements required for the CRM Sales Analytics Solution ... 13
4.2.1.
MBCP Marketing Campaigns ... 14
4.2.2.
The Commercial Structure ... 14
4.2.3.
Time Line and Contacting Process ... 15
4.2.4.
The final Core-Table metadata ... 16
4.3.
Building the Data Model in Power BI Desktop ... 18
4.3.1.
The main fact tables ... 18
4.3.2.
The Dimension Tables ... 19
4.4.
Results and Reports ... 22
5.
The Next Best Offer: A Gateway to efficient customer-centric relationships in the CRM
Department ... 25
5.1.
The existing solution of the NBO 1.0 ... 26
5.1.1.
Predictive models of the CRM Team ... 26
5.1.2.
From predictive models to the Next Best Offer 1.0 (NBO 1.0) ... 27
5.2.
The Next Best Offer 2.0 (A Theoretical Roadmap) ... 27
5.3.
The Millennium BCP Roadmap for the implementation of the Next Best Offer 2.0
29
5.3.1.
The list of the recommendable products ... 30
5.3.2.
The Communication Profile of the client ... 31
5.3.3.
The Recommendation System using a similarity matrix between products 33
5.3.4.
The Websites Visits of the official website of Millennium BCP ... 44
vi
5.3.5.
The Propensity Models ... 47
5.3.6.
The Rating System for the NBO 2.0 ... 57
5.4.
Summary ... 58
6.
Conclusion ... 60
vii
LIST OF FIGURES
Figure 1 : Table of contact channels ... 5
Figure 2 The Comercial year of Millennium BCP ... 6
Figure 3 : Mechanism of the CRM Team ... 7
Figure 4 : SAS Base - Left pane: Environment, Upper pane: Logs and outputs of statements,
Lower part: Scripts ... 10
Figure 5 : Example of a Dashboard in Power BI ... 11
Figure 6 : Structure of The SAS System ... 12
Figure 7 : Mecanism used to build the data model in Power BI Desktop ... 12
Figure 8 : The CRM Sales Process ... 13
Figure 9 : The Geographical division of Portugal ... 15
Figure 10 : The Sales Funnel ... 15
Figure 11 : Metadata of the core-table ... 16
Figure 12 : The data model of the CRM Sales Analytics solution ... 18
Figure 13 : Human channels dimension table ... 20
Figure 14 : Non-human channels dimension table ... 20
Figure 15 : The commercial cycles dimension table ... 20
Figure 16 : The products' families Dimension Tables... 21
Figure 17 : Contacting purposes for Non-Human channels ... 21
Figure 18 : contacting purposes for Human channels ... 21
Figure 19 : Global View of the CRM Sales ... 24
Figure 20 : The switch from product-centric marketing to client-centric marketing (Andrea
Fabrizi, 2014) ... 25
Figure 21 : Conception of the NBO 2.0 architecture (Andrea Fabrizi, 2014) ... 28
Figure 22 : Millennium BCP roadmap to the Next Best Offer 2.0 ... 30
Figure 23 : Building the List of recommendable products ... 31
Figure 24 : Table of the clients and their communication profile ... 32
Figure 25 : Classes of the communication profile ... 32
Figure 26 : Sparse Matrix ... 37
Figure 27 : Clients Information (MS: Mass | UU: Mass Market+ | PP: Prestige) ... 37
Figure 28 : Similarity matrices between the 10 different product categories in Millennium
BCP per Client's Segment ... 38
Figure 29 : Illustrative Example of a Recommendation Strength ... 39
Figure 30 : Recommendation Strength table for Prestige Clients ... 40
viii
Figure 32 : Recommendation strength for Credit Cards & Habitation loans ... 42
Figure 33 : Recommendation strength for Credit Cards & Personal loans ... 43
Figure 34 : Recommendation strength for Insurances ... 43
Figure 35 : Recommendation strength for Savings & Investments ... 43
Figure 36 : Home page of the Millennium BCP website ... 45
Figure 37 : Visits and clicks in the Millennium BCP Website ... 45
Figure 38 : Summarized website visits table by client ... 46
Figure 39 : Example of Variables per each Variable category ... 48
Figure 40 : Example of a Target Definition ... 49
Figure 41 : Collecting 0s and 1s using the windows timeline ... 50
Figure 42 : Analytical Base Table ... 51
Figure 43 : Benchmark Statistics Versus Model Statistics ... 54
Figure 44 : Back-testing distribution ... 55
Figure 45 : The CRM Scoring table ... 56
Figure 46 : Table of the used models for the NBO 2.0 ... 56
Figure 47 : Outer R.System Results ... 58
Figure 48 : The Millennium BCP implemented process for the Prediction of the Next Best
Offer ... 59
ix
LIST OF ABBREVIATIONS AND ACRONYMS
NBO: Next Best Offer
KDD: Knowledge Discovery in Databases ABT: Analytical Base Table
RS: Recommendation System MBCP: Millennium BCP
1
1. INTRODUCTION
Nowadays in modern companies, it is widely recognized that data has taken an important twist in the recent decade across all economical fields, making it mandatory for the technological infrastructure inside companies to be strongly adapted to support its non-stopping growth along business timeline. However most of the modern companies, specifically the small medium-sized companies were only interested in having powerful storage capacities for statistical purposes. In the other hand, few companies not only they have reached that level, but they are also exploiting this historical accumulation of data using prescription methods to discover underlaying patterns hidden from the actual and previous checkpoints of their business. Based on that, companies constitute a clear roadmap on how to orientate their business to their most profitable clients, thus accomplishing a higher turnover than doing it without data exploitation. In this optic, Millennium BCP which is the largest private bank in Portugal and where the internship has been carried out, is one of the few banks in Portugal, that has succeeded in the field of Big Data and Machine Learning and has been an example of a leader company that exploits Big Data and does prescription studies aiming for a better business. This know-how on both theoretical and practical levels, has been applied in various facets of banking such as retail, funds and investments, insurances, loans, real-estate and private-banking. Millennium BCP, given its important base of clients, a rigorous attention is permanently given to the client’s interactions with his patrimony inside the bank. Each client has a determined profile regarding his purchases which, on a large scale, would help Customer Relationship Management teams inside the bank communicate more adequately with the client about the products and offers he is more likely to have. Overall, this internship which was mainly conducted inside the CRM team of the retail marketing department, was mostly based in data collection, cleaning, analysis, predicting and communicating. There will be launched various trade-offs between a panoply of data mining projects methods and processes based on the specificities of each conducted project. On the other hand, Data visualization also will take a very essential role in understanding the evolution of some indicators quickly avoiding time consuming querying, to get the comparison baselines and thus making the data much more understandable through graphical figures.
2
2. LITERATURE REVIEW
In a world in which internet and technology does not stop from moving forward, Companies must adopt their ways of dealing with massive data in terms of storage and structure. But there is a big part of the companies who behave in a report centric fashion (Kirpes) which leads them take very poor decisions because they haven’t drawn attention to the other facet of the medal. Most of the companies are adopting very powerful containers of data which are called Data Warehouses that contain all the summarized information that users need across various axes of analyses called dimensions. Still, there are some data warehouses who have been built very successfully but still lack in terms of efficiency in providing the information. The reason for this issue is that most Data warehouses are built without giving an importance to the conceptual or reference models that they must follow (Matthias Goeken, 2007). The starting point for building a data warehouse is to put into a list all the eventual questions to which this solution is going to come up with answers. The most widely used reference model that Data warehouses rely on is the Entity Relationship Model proposed by (Chen, 1976). This model represents the different stakeholders in a company’s daily activity as well as the actions involved between each of these participants. Later, these models can easily translate to Relational Models that is a model widely followed by most of the Online Transactions Systems (OLTP) (K.J Raiha, 1992). Few companies have a long-term vision and opted instead for implementing a Lake. Contrarily to a Data warehouse, a Data Lake contains all types of data. Structured, Semi-Structured, and unstructured. It is a repository that has basically no respect for the shape of the data flow. According to (Llave, 2018) There are 3 purposes behind implementing a data lake which are: Multiple Data sources, an experimentation platform for data scientists and data analysts, and the application of self-service Business Intelligence. The main process behind building a Data Warehouse is the ETL (Extract, Transform, Load) process which is according to (Davenport, 2008), is considered the traditional and widely accepted approach. The ELT (Extract, Load, Transform) Processes has also emerged recently which loads the data from the data sources before cleansing and transforming the data. The ELT has been proven to be less risky than the traditional ETL Process in a way that the transformation is isolated which enables easy maintenance and management. However, it lacks a lot of technological tools in comparison with the ETL that has many in the market. Business Intelligence is known to be a strong technique that helps companies through their business decisions. However, it is now considered very traditional with the presence of Data Science and Machine learning techniques that help not only in taking decisions but also to anticipate them. Companies nowadays have a great opportunity to extend their traditional Business Intelligence platform to a more powerful one since they already have massive data in their servers. It is in this optic that (Fayyad, 1996) are inciting on extracting knowledge from the cumulated data using processes of Knowledge Discovery Databases. In brief, the KDD Process aims first to create a targeted data from which one wants to extract useful information. Afterwards, a series of data pre-processing and transformation methods are applied, followed by data mining techniques to extract value and make interpretations. Data mining also has been a field to which research has been giving a lot. (Mark Brown) from SAS suggested the SEMMA Method that is widely used in SAS technological tools. (Shearer, 2000) as well in the Journal of Data Warehousing described a very simple and concise data mining method that starts particularly with business understanding followed by data understanding. These data mining techniques help build very powerful predictive models that can be used to forecast some rare events and consequently act efficiently based on these predictions. In the
3 Marketing and Retail banking, for example, some Machine Learning techniques have proved to have given very good results in terms of making offers to clients for products that might interest them. Recommendation Systems are powerful models that are built based on the behavior of a lot of contributors. The best example would be (FERNÁNDEZ, 2018) with her Movie Recommendation System built for Netflix which was based on over 17000 movies and 500000 Netflix users. (Robin Burke, 2008) distinguishes between 5 different types of Recommendation Systems. collaborative, content-based, utility-based, demographic, and knowledge-based. But the most used ones are collaborative-based which relies on the ratings of each user towards the item, and content-based which considers the features presented by each item. Few companies have used so many data mining techniques and reached a high level of understanding each client’s needs. This made it easy for them to suggest the best deal that they can come up with for each client. This concept is called the Next Best Offer (or Action). (Andrea Fabrizi, 2014) have built a very robust solution for predicting the Next Best Offer stressing out also other companies in the commercial field to transform their old marketing strategy of being product-centric into a new one of being client-centric. Their Next Best Offer model relies on getting all the products’ profiles and the clients’ profile in an information module. This module pushes the information to the Recommendation Engine that comes up with the best offer. The recommendation engine is also trained with the feedback of the clients following this offer. This makes (Andrea Fabrizi, 2014) solution acts always in an efficient manner.
It is with the light of all these research contributions stated above that the following work will be presented.
4
3. THE CRM SALES ENGINE IN MILLENNIUM BCP
3.1.
O
VERVIEWMillennium BCP retail marketing department is composed of several teams that try to find approaches of conveying the sales of specific products. This department has a very compound sales infrastructure that contains various processes, from marketing campaigns to purchased products by the client. Given that the marketing department is composed by teams that are responsible of managing the business of each product category (which mainly are Investment and saving funds team, Solutions team, Bank accounts team, Credit and Debit Cards team, Insurances team, Personal loans and other loans team, and real-estate loans team), a permanent cooperation is held between each of these teams and the CRM team. Core entity that launches the starting point of a marketing campaign chain through which a specific product, service or promotion is being communicated to the client. Clients subject to campaigns are usually chosen by either applying determined criteria that are dealt with between the CRM team and the team concerned by branding its product(s), or by the outcome of a prediction model built also by other team members of the CRM Team.
Contacting clients for branding and selling Millennium BCP products is made through various means of communication called channels. Here below there are stated the most used ones.
• MBCP bank branch (Sucursal): Which are simply small bank branches located all over the country that offer banking face-to-face services to the clients. Moreover, they receive a list of clients by product from the CRM team who should be contacted for eventual offers and services or promotions according to the marketing campaign related to the purpose of the contact.
• Email: Considered as one an important canal due to its free cost. It is usually used to send temporary promotions of discounts to clients.
• Outbound Channels: Contacting approaches launched from the initiative of the bank to the client.
• Inbound Channels: Cases in which the client, by his initiative, reaches the bank directly or indirectly seeking for information or advice about a product.
The following figure illustrates the main channels through which communications between the bank and the client occurs
5 Figure 1 : Table of contact channels
One of the most profitable channels among the ones cited above is obviously the bank branches since they establish close contact with the client. MBCP Branches are equipped with softwares created by the IT team of the bank that are used to track their sales weekly according to their objectives that they must fulfill. Each director of the branch has its own list of clients with whom he is considered the direct contact for any purpose that has to do with any service of pre-sale proposition. This direct contact with the client is the reason behind the success of this marketing channel in comparison to the others cited above
6
3.2.
C
OMERCIALT
IMEFRAMEFrom the time perspective, Millennium BCP organizes its commercial balance of retail banking by dividing the year from January to December into 4 quarters which are called “commercial cycles”. Each cycle contains 13 up to 14 weeks. The division might differ from a year to another so as the number of weeks by cycle. It is made taking into consideration a lot of criteria that have to do with holidays and special events of the bank.
Figure 2 The Comercial year of Millennium BCP
The 1st commercial cycle is considered a very active cycle. As it’s the beginning of the year, it has been noticed that MBCP Clients have more availability to interact with their affiliated branches. Moreover, it is the period known by holidays which make it easy for the bank to target promotion lovers specially during new year’s and the Carnival.
The 2nd commercial cycle is also a good cycle in terms of sales. During this cycle, the CRM team usually focuses on creating marketing campaigns that will retain new clients that have entered during the first commercial cycle. It is also a very active cycle specially in March and April
The 3rd commercial cycle, since it somehow overlaps with summer holidays, attracting new clients becomes a very challenging task during this period. Thus, the sales objectives for this cycle are usually low in comparison to others
The 4th commercial cycle is a period in which business starts to increase from the summer stagnation that is usually occurred in the 3rd commercial cycle. Essentially due to periods such as the school entrance or the new academic year that starts in September.
7
3.3.
T
HECRM
T
EAM ANDB
IGD
ATAThe CRM team is playing a very important role in dealing with big data. It is always very challenging to orientate the most adequate product to a small group of clients among the huge clients’ base in Millennium BCP. For that purpose, the CRM team is dealing with 3 main types of functions which are the following
• Managing and scheduling the marketing campaigns for client contacting • Building predictive models for product acquisition using SAS Technologies
• Managing and updating the data from the information systems and store it into the data mart
This figure will illustrate the CRM Team composition and how each of the cells coordinate efficiently to execute their main functions
Figure 3 : Mechanism of the CRM Team
The data mart in this use case means only a library or a repository of SAS tables that contain structured data according to different business logics with basic transformations and aggregations of the transactional systems conceived by the IT department (Process that is not covered in the current report). The predictive models team use this information to look at the historical data needed, to build accurate predictive models for specific products. After determining the perfect leads, they communicate them to the marketing campaign that, based on a previous demand from the responsible team of the product, will also create the details of the marketing campaign that will
8 appear in the corresponding channels. The big data part is mainly assured by the data mart team that also deals with storage capacities for the other teams to perform their tasks.
The marketing campaigns that are destined to clients who should be contacted by branches (Outbound) and other channels as well are created by the marketing campaigns team using a platform that acts as an automatic software scheduler for these campaigns to their respective channels. As stated previously, bank branches have weekly objectives that should be fulfilled. Those objectives are defined by a department that assesses their performance based on sales made over contacts. The major challenge presented in this workflow is sales tracking. How could the CRM team track their sales on a weekly basis given the challenges this team faces regarding data complexity and the non-stopping growing data size?
9
4. THE CRM SALES ANALYTICS AS A NEW SOLUTION FOR SALES TRACKING
In this part, the sales process will be discussed in much more depth. There will be presented the main stakeholders that participate in the sales process and across which data analysis was applied. There will also be presented the conceptual model that has been used as an input for the final Sales Analytics solution with a panoply of dashboards implemented for sales tracking making the sales process more flexible and optimized for all concerned parts.
4.1.
T
ECHNOLOGICALP
RESENTATIONMillennium BCP possesses a strong technological infrastructure to support the growing amount of data generated by daily banking operations from its clients. As most of the big companies, Millennium BCP since has always opted for the use of the SAS softwares alongside its panoply of powerful components.
4.1.1. SAS® Software
SAS®, which stands for Statistical Analysis System is a software suite developed by the SAS Institute for purposes of Data Science, Statistics, Multivariate data Analysis, Predictive Analysis and Data Mining. Although the SAS Suite contains more than 200 tools that fulfill different business needs in an automated manner, the main function of the SAS Suite is basically to unite data from different data sources and perform statistical studies, predictive, descriptive and prescriptive analytics for a better understanding of the business. SAS Suite provides a wide variety of technologies with a high level of technicity for users who have tendency to program from scratch, as well as other tools which are based on graphics and drag-and-drop actions that are considered more adapted for users with business knowledge than technical skills.
The main component that is going to be used frequently is the SAS Base. SAS Base or SAS Console is an interface in which there can be written SAS code and executed. The SAS Base is a component that relates to the server of the bank which contains different kinds of banking data. Therefore, data retrieving, and data cleaning is going to take major role in this stage, to come up with the best structured data that will serve as the main input for building the conceptual model.
10 Figure 4 : SAS Base - Left pane: Environment, Upper pane: Logs and outputs of statements, Lower
part: Scripts
4.1.2. Microsoft® Power BI
Microsoft Power BI is a Business Intelligence and Business Analytics suite that provides tools for reporting and building dashboards guaranteeing a very simple user-friendly atmosphere for their users aiming for independence from Database Administrators or technical staff.
Power BI contains two main components necessary for supporting, building and sharing reports and dashboards which are the following :
• Power BI Desktop: The only free of cost component in the Power BI suite that enables its users to mainly connect the data sources and make them ready to populate reports and dashboards. Power BI Desktop also offers intelligent capabilities of data editing and data cleansing. It can also be connected to a variety of data sources citing among them excel files, data base management systems (DBMS) as well as other external sources.
• Power BI Services: is a component that is, contrarily to Power BI Desktop, is considered as the web version of Power BI Desktop. It is a cloud-based platform in which dashboards and reports are shared among the rest of the end-users. It has limited editing capabilities as it is much more dedicated for final visualization of the reports and dashboards. However, being connected to a third-party component which is Power BI Gateway, there can be scheduled automatic updates daily, weekly or monthly from the latest version of the data to update the published reports and dashboards without requiring any use of Power BI Desktop.
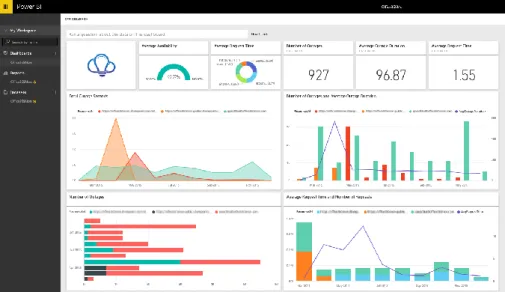
11 We can look at these two components in a very simplistic perspective. Power BI Desktop is usually used as a development environment (Building phase), while Power BI Services is used as a Production environment (Tests and deployment phase). Power BI Services’ automatic refresh is in fact the main feature that will optimize and automatize the sales process in the CRM Department. It has been 1 year and a half that Millennium BCP has acquired full license for the use of Power BI aiming for flexible data flow between different entities inside the bank as well as for simple data sharing and easy access to data presented in the best adequate graphic visualization. Here below is an example of a power BI Dashboard
Figure 5 : Example of a Dashboard in Power BI
4.1.3. Microsoft® SQL Server
4.1.3.1. Why a DBMS (Data Base Management Server) ?
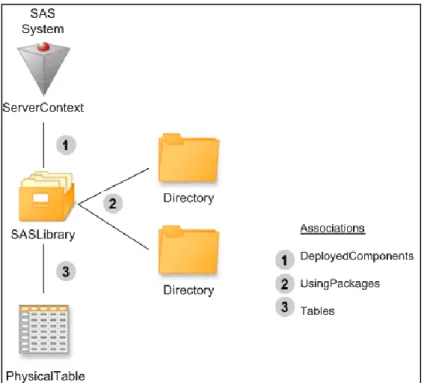
The expected scenario that has been planned for the optimized process of sales tracking was connecting SAS datasets and tables directly to Power BI Desktop after preparing the necessary SAS datasets. Unfortunately, there was no possible way to link the data from SAS to Power BI. The main probable reason is the structure with which SAS was built. In fact, this is due to a SAS concept which is “SAS Library”. A SAS Library is simply a SAS repository of datasets that is linked to a physical repository in which there can be mapped various data sources. These libraries refer to physical folders in the server. As it is illustrated here below.
12 Figure 6 : Structure of The SAS System
Hence, this structure hides the availability of these datasets to other applications including Power BI. Those libraries can contain various datasets which are physically SAS tables having the “.sas7bdat extension”. This framework doesn’t make of SAS a DBMS with which it can be associated to Power BI. It is in this optic that a DBMS is needed to ensure this connectivity between both sides.
4.1.3.2. SQL Server as a Gatewaty
SQL Server is a Data Base Management System used to store data in databases with high security levels. It enables also a very simple interaction for data selection using SQL queries. In this scenario, SQL Server will serve as a gateway between SAS Datasets and Power BI as illustrated below.
13 With this structure, an important part of the work is going to be focused on building a proper data source that is going to gather all the necessary components from the SAS tables required. It has been considered as a best practice, performing the data cleaning, transformation and preparation at the level of SAS Server using multiple tables with which the CRM team works daily. These tables that exist in the Datamart SAS library are updated on a daily, weekly, cyclic (Commercial Cycle) or monthly basis. Some of these tables are going to be used in the process of building the so-called “core table” that will serve as an input in the SQL Server. Later in PowerBI Desktop, the core table will be imported to build the data model
4.2. D
ATA SOURCES AND ELEMENTS REQUIRED FOR THECRM
S
ALESA
NALYTICSS
OLUTIONIn this section, there will be presented the main components from the business logic perspective, that will be inputted in the Core-Table. As a reminder, the process of building the Core-Table in the SAS System is not going to be covered since it was not a part of the internship main functions. Therefore, this section will provide detailed information on the CRM Sales process between main communication channels, Marketing campaigns and client contact schedules
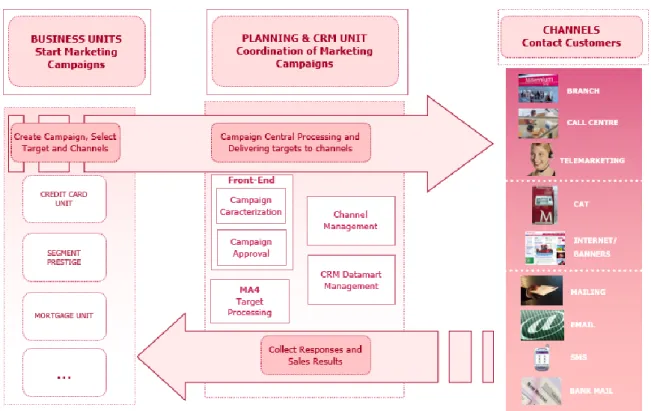
To begin with, the figure below is a general overview of the Sales CRM process Management that shows how the CRM Team is playing a major role between different units responsible for product marketing and the different channels for contacting clients.
14 It is clear how the CRM Team is positioned as a gateway between product units in the aim of managing and preparing the necessary marketing campaigns to increase sales in a way to guarantee the customer experience in profiting from the wide category of MBCP products. The Sales tracking is made weekly as stated before.
Thus, to constitute the core-table, Information is needed about the marketing campaigns, the commercial zone in which the clients are registered, the purpose of contact and the quantity of listed and contacted clients.
4.2.1. MBCP Marketing Campaigns
A marketing campaign is an action that is organized by the bank in the aim of branding a new or an existing product, service or promotion. It can also be made for purposes that are not related to cross-selling such as informative marketing campaigns or other campaigns used to increase client’s loyalty and prevent product attrition (Retention campaigns). Usually marketing campaigns target a big number of clients that are considered accurate clients in tems of their profile. Their goal can be to brand one or multiple products. A marketing campaign can have one or more than one contact channel depending on the nature of the product.
In Millennium BCP, as there have been implemented various marketing campaigns. in the core table there will be needed the code of each campaign, its main title, the channel through which it will be launched and the reason or purpose of this marketing campaign.
4.2.2. The Commercial Structure
In the expected Sales Analytics solution, analyzing the sales across all the country to view the sales performance from a geographical perspective would be a strong feature of the solution. That would enable the commercial responsibles for the sales done by all the branches and centers of each locality in the country to track their own sales. To achieve this goal, Millennium BCP adopted a very detailed division of its branches and call centers according to their location. Every entity charged of reaching out the client belongs to a single point in this division. Usually, a marketing campaign is destined to a contacting area (Balcão). This area is the name of the locality in which this entity exists. For example, if the contacting entity existed in Chiado (a very popular neighborhood in Lisbon) the contacting area will be called Chiado. This contacting area hierarchically belongs to a square (Praça). The square itself belongs to another classification of the national level which is the following.
• Northern Part • Central part
15 The following figure shows this national classification on the map of Portugal :
Figure 9 : The Geographical division of Portugal
4.2.3. Time Line and Contacting Process
As it was stated before in several parts, the marketing campaigns are directed to its concerned clients on a frequent basis (weekly, daily, monthly, cyclic). For this matter, the time dimension will be needed. However, this time dimension will be different than the regular time dimension (Year, quarter, month, day) due to the unique timeframe that Millennium BCP uses to quantify its activity (4 Commercial cycles per year with 12 to 13 weeks each). For each marketing campaign, target clients are selected to contact (using automated processes). Next in the contacting process, usually not all the targeted clients are contacted. Only those who present a high propensity of welcoming the offer are subject of campaign. In the next step, from those contacted clients and based on their answers regarding the marketing campaign, clients with a positive intension or expressed an optimistic feedback regarding the campaign are collected. Finally, from this category of people, clients who bought the product or answered positively to the subject of the campaign are also distinguished. The following figure explains this funnel on which the Sales analytics solution will be based for sales tracking
16
4.2.4. The final Core-Table metadata
In most cases, the number of targeted clients per marketing campaign is very huge. Therefore, if the core-table was made on the client level, the resulted table would contain millions of rows knowing that in average, one marketing campaign can target up to 10000 clients. As a result, the core-table would be very heavy and difficult to process in PowerBI. For this reason, it has been decided from the CRM data mart team that the core-table ought to be built on the level of each marketing campaign in the respective week of the commercial cycle in which it has been launched. Regarding the number of clients, it will be summarized from targeted clients to clients who accepted the offer. In this figure, there will be shown the metadata of the table core-table.
Figure 11 : Metadata of the core-table
Campcode : code of the marketing campaign
Commcode : Specifies the segment or category of clinets to whom the marketing campaign is gonna be added
Campnome : Name of the marketing campaign CodBalcao : code of the contacting area (see page 12) NomeBalcao : name of the contacting area
17 Cod_Zona : Code of the zone
NomeZona : Name of the Zone
Praça : Square to which the zone belongs
Tipologia : is Basically the segment of clients to whom the marketing campaign is addressed. It can be mass market, Prestige or Mass plus for individuals
CCustoGestor : It’s the contacting center in which the client is registered to
NomeGestor : The name of the manager responsible to call and manage the client’s matters directly RazaoDeContacto: The purpose behind the marketing campaign (Acquisition, Fidelity, Inquiry). There are 2 types of contact purposes used both in different types of marketing campaigns
Produto: the family of products to which the product belongs to (Credit Cards, Debit Cards, Mortgage loans…)
Ciclo: Commercial Cycle
Semana: week of the corresponding cycle ListadosCiclo: The selected contacts for the cycle ListadosSemana: The selected contacts for the week PorTratar: The clients to be contacted
Contactado: The contacted clients
Insucesso : Clients who weren’t interested by the offer Sucesso : Clients who expressed an interest about the offer
Aberto : Clients who’s contact plan has been scheduled for next week
NaoContactado : Clients who were listed to be contacted in the week but were not Expirado: Clients who haven’t been contacted in the necessary time in which it should be QtdVendas: Sales that were realized
18
4.3. B
UILDING THED
ATAM
ODEL INP
OWERBI
D
ESKTOP4.3.1. The main fact tables
As the core table above contains all the information required for the needed solution, it can be imported to Power BI. There are 2 data connection modes in Power BI Desktop. The “Direct Query” mode and the import mode. The Direct Query Connection mode enables the Power BI engine to send queries directly to the data source and brings back the results. Manual data refreshes are not required in this mode. The import connection mode imports a copy of the whole data source in the Power BI file (Available only if the Power BI file doesn’t exceed 1GB of memory). As it imports a copy of the data source, manual refreshes are required in this mode. Knowing that the core table is going to increase weekly, using the Direct Query mode on a table that would probably have more than 10 million rows is extremely time consuming at each interaction with the report. Thus, it has been decided to opt for the import mode to connect the core table.
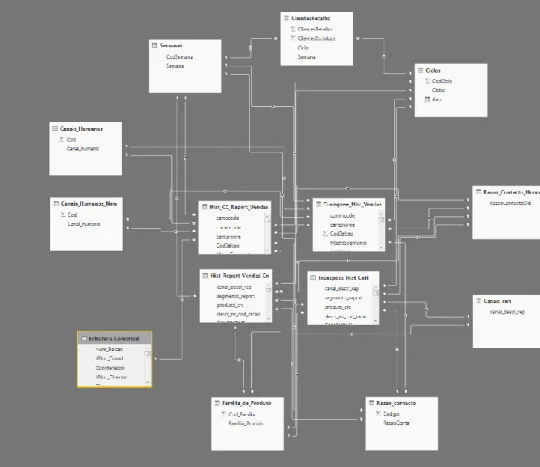
As the table has been imported to the power BI desktop file, it has been built a star schema from it to add more flexibility to our model, especially in terms of interactive filtering. The following figure shows the final data model that was built inside the Power BI Desktop.
19 In this model, the core tables (can be called as fact tables) is the Hist_cc_report_vendas and the Hist_report_vendas_cnh. Both are almost the same. What differs between the two tables is that the first one gathers the marketing campaigns communicated through the human channels and the other contains the marketing campaigns communicated through the non-human channels. From these two core tables, there has been generated two other tables which are the corresponding transposed tables of the two core tables.
The purpose of doing so is to generate the sales funnel (Page 14). The power BI desktop visuals are sophisticated items that take one or various variables from the data source and automatically generate the graph. For generating the funnel graph, the input of its correspondent visual should be a variable containing the values of (“Listed”, “Contacted”, “Not contacted”, “Success”, “Fail”, “Sale”) as many times as the number of these clients.
Below is a small example of a dummy marketing campaign of credit cards that will illustrate the transpose operation applied for both tables to include the funnel graphs for both human channels sales and non-human channels sales in the Sales Analytics Solution.
This is one row from the core table (Either ways which one)
The output of the transposed table would then be the following
One row of the core table would basically correspond to 4 rows in the transposed tables. The category variable will then contain the values wanted in the input of the funnel sales. And their sum would be the values in the “value” variable. From there the necessity of building two transpose corresponding fact tables.
4.3.2. The Dimension Tables
Knowing that the core table is the only data source provided by the data mart team, the dimension tables that will complete the data model were created and deducted from the values of the corresponding variables in the fact tables. In fact, when building a model in Power BI desktop, relationships creation between tables requires that one of the tables’ field should have unique values. This is not a limitation of the software but rather a principle in relational databases (Primary and foreign keys). There will be guaranteed a fast search or filtering when interacting with the report. Therefore, the main dimension tables would contain unique values that would easily ensure the relationship with the fact tables.
20 These are figures about the main dimension tables that were needed for the Sales Analytics Solution.
Figure 13 : Human channels dimension table Figure 14 : Non-human channels dimension table
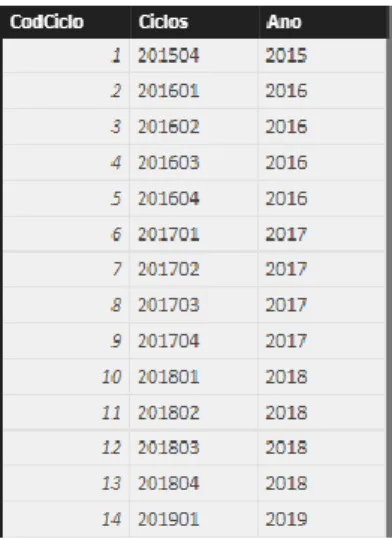
Concerning the time dimension, Commercial managers in branches of the bank are most of the times interested by the weekly sales. Whereas the commercial directors of the entire zone in which branches operate are more interested to analyze the entire commercial cycle. Thus, the Sales Analytics Solution would not drill deeper than the week hierarchy. As each commercial cycle has between 12 and 13 weeks, a cycle table alongside a week’s table have been created with respectively unique values to the periods of the marketing campaigns.
Figure 15 : The commercial cycles dimension table
As the marketing campaigns were promoting a different variety of products, analyzing the sales at the product level is really relevant to the commercial directors and branch managers. Millennium BCP has a fixed classification of all the products. They are grouped into families of products “Familias de produto” or product categories. It is through this classification that commercial directors need to have the information per each product’s family.
21 Figure 16 : The products' families Dimension Tables
Sometimes it might be important to closely analyse the behavior of the clients regarding the marketing campaigns. Knowing that any marketing campaign must have one commercial purpose (Acquisition, Fidelity, Data update…), It is important to track the marketing campaign from various purposes. The hierarchy of the contacting purposes can differ thus it can always be relevant to analyze the sales through this dimension.
Figure 17 : Contacting purposes for Non-Human channels
Figure 18 : contacting purposes for Human channels
22
4.4. R
ESULTS ANDR
EPORTSThere have been implemented various KPIs for the CRM Analytics Solution. KPIs are indicators with which it can be assessed the performance of the CRM Marketing campaigns not only sales wise but also to understand the global interest of the clients of millennium BCP towards each product category. These KPIs were developed using the DAX Language that is integrated in Power BI Desktop. Most of the indicators that were implemented in the solution concerned mainly Sales and Contacted Clients. The ideal situation would always be a greater percentage of sales over contacted clients. Even better if there were few contacted clients which gives an idea about the good accuracy of listed clients.
Here below is a list of the main KPI used for the CRM Sales Analytics Solution (For formulas look at the annexes)
KPI Code KPI Name Description
M_CicloAnterior Previous commercial cycle KPI that is used by other KPIs for comparing the performance of the previous commercial cycle
M_UltimaPassadaSemana Previous week Used to get retrieve KPIs of last week
M_Contactados Total of Contacted Clients which is the sum of all the contacted clients
M_ListadosCiclo Total of Listed Clients (Cycle) Listed clients for the current cycle
M_ListadosSemana Total of Listed Clients (Week) Sum of the clients to be contacted in the week (Portratar) and the clients which contact has been scheduled for next week (Abertos)
M_Sucesso Total of Success Clients Total of the clients with a positive intension towards the marketing campaign
23
M_Vendas Total of sales Sum of the clients who
concretized the sale through the marketing campaign M_tx.Contacto Ratio of Contacted Clients Total of clients contacted divided
by the total of listed Clients
M_Tx.IntCompra Ratio of Success Sum of the success clients / Sum of contacted clients
M_Tx.Venda Ratio of Sale Sum of sales / Sum of
Contacted Clients M_Vendas_CicloAnterior Total of Sales in the previous
Cycle
Total of the sales in the
previous Cycle positioned in the last week of the Cycle
M_Vendas_SemanaPassada Sales of Last week Last week sales in comparison to the current week
Prev_M_Tx.Contacto Contacting Ratio of previous Cycle
Prev_M_Tx.Venda Sales Ratio of the previous Cycle
24 Figure 19 : Global View of the CRM Sales
The upper dashboard presents a global view of the sales in both human canals (Right panel) and non-human canals (Left panel). In both panels, we can see the funnel graph from listed clients to sales that was created using the transpose version of the core-table, the distribution of Listed and contacted clients per channel, the evolution of the contact acceptance rate and the sales rate per cycle and week (each line represents a cycle). On top of the Dashboard there are presented Indicators for the current cycle among them there are, all Clients listed from the Retail Segment, the excluded ones from being listed from marketing campaigns due to high risk or imparity signs, contacted clients, Contacting rate and a comparison of this value with the previous cycle (2.85% less than the previous cycle) and finally both sales rate for both human and non-human canals alongside their difference between the previous cycle.
25
5. THE NEXT BEST OFFER: A GATEWAY TO EFFICIENT CUSTOMER-CENTRIC
RELATIONSHIPS IN THE CRM DEPARTMENT
Nowadays, in a world where clients are becoming more exigent about their needs and expectations from a product, companies must adapt to this sudden twist by investing massively for a marketing with efficient strategies and powerful longstanding customer relationships. It is in this perspective that some companies took advantage and coupled the traditional marketing with Analytics. This component made marketing very precise. However, the predictive models for product acquisition that were designed to give a strong facet to a modern marketing were found to behave very poorly and inadequately in some situations despite the use of significant, powerful and accurate predictive models. At this level, companies started to understand that an attention should be paid more at “the customer level”. Let’s say for example that clients who are more likely to get a mortgage-loan are the ones who have more logins to the banking phone application. There might be an important number of cases in which young clients who access the app various times to only check their balance receive as well offers for acquiring a mortgage-loan. These situations might be rare to happen. But on a larger scale, especially for companies with a clients’ base of more than one million clients, it is having a negative impact on the relationship bank-customer inducing him to decrease his satisfaction due to offers he is not interested in. Therefore, offers should be sent with the certainty that it’s going to be an offer the client is less likely to refuse. Consequently, the transition to an analytical product-centric marketing happened to be inefficient though the successful use of strong machine learning techniques in the implementation of the necessary predictive models.
Being aware of this actual situation, Millennium BCP is intending to take a further to adopt a strategy that is more client-centric. The bank launched the challenging project of The Next Best Offer (or action) that has as main objective determine the most adequate product, service, promotion, or product upgrade for the client at the right moment, the right time and throughout the right channel. This project will be the fruit of various machine learning and data science techniques that will be applied on different sides of the project as the major challenge is to have a 360 degrees client vision from a big amount of data.
Figure 20 : The switch from product-centric marketing to client-centric marketing (Andrea Fabrizi, 2014)
26 In this present chapter, there will be presented a brief overview of the initial simple solution of the Next Best Offer, under the name of NBO1.0 (Next Best Offer 1.0), followed by the methodology adopted to Build a more robust solution that considers other aspects of the clients that are not related to his purchasing profile. Also, there will be explained more in-depth each component of the NBO 2.0 analytics engine as well as the rating grid that enables it to reach the best offer for the client.
5.1. T
HE EXISTING SOLUTION OF THE NBO1.05.1.1. Predictive models of the CRM Team
As stated previously, the CRM has 3 teams. The Data Mart team, The Marketing Campaign team and the predictive models’ team. The predictive models’ team has implemented a panoply of powerful predictive models. Most of them are generally used to study the outcome of clients acquiring a new product. Others are used to calculate the churn rate (Ex Churn rate from becoming a client of Millennium BCP, Churn from acquiring the banking solution “Programa Prestige”). Sometimes during the building of these models, the universe of clients might be restricted only to a segment of clients. (Mass Market clients, Plus Clients, or Prestige Clients which are the 3 categories of retail individual clients) to increase diversification of products possession across other types of clients. Here is a list of the predictive models that were built in the predictive models’ team
• Personal Loans (3 models one for each segment) • Habitation Loans (3 models one for each segment) • Credit Cards (3 models one for each segment) • Millennium GO! (All segments included) • Programa Prestige (All segments included) • Bank Attrition Model (All segments included) • Cliente Frequente (All segments included)
• Mais Portugal + Programa Prestige (Hybrid model for the segment of clients living outside Portugal)
• Móbis
• Cliente Frequente (Segment of Negocios) • Other models for the companies’ segment
27
5.1.2. From predictive models to the Next Best Offer 1.0 (NBO 1.0)
These models provide scores (from 0 to 1) which are themselves classified by the Score category (Low, Medium low, Medium High, High, Superior). For each client, the scores from the corresponding models in which he has been subject to analysis are calculated monthly. Therefore, the approach of the Next Best Offer 1.0 was the following: The next best offer is simply going to be the product which model gives the highest score across all the other models. Consequently, each month with new scores coming, there is a monthly Next Best Offer. There were a lot of marketing campaigns that were created by the Marketing Campaigns team to establish contacts to these clients proposing them monthly offers of their most suited product. Unfortunately, most of them didn’t have success and that’s due to several reasons. The existing predictive models do not cover all the products and the upgrades of each product. Moreover, it doesn’t include clients’ data that would give an overview of how strong the client’s relationship with the bank is, even outside of the commercial perspective. This approach of the Next Best Offer is very limited and was proved that it has poor results judging from the Marketing campaigns. Instead, this version of the Next Best Offer 1.0 will serve as an input for the second version of the Next Best Offer 2.0 alongside other components related to Predictive Analytics.
5.2. T
HEN
EXTB
ESTO
FFER2.0
(A
T
HEORETICALR
OADMAP)
Having a 360 degrees view requires an onerous effort of data collection about all the client’s information. It would have also been interesting to have real time data or at least fast refreshable client’s data (Pseudo Real Time). This would be the starting point to a new innovative solution that would maximize the sales of the bank since the offer is built from that client’s portfolio. Then this portfolio would be the input of an engine that will be implemented, composed by different machine learning algorithms that would intelligently detect the best suited product to offer for the client.
28 Figure 21 : Conception of the NBO 2.0 architecture (Andrea Fabrizi, 2014)
The upper architecture in Fig 20 from (Andrea Fabrizi, 2014) presents a robust version of the expected NBO 2.0. It is composed mainly of 3 components.
• The Information Gathering module: Which is all the part of data gathering. It will itself contain mainly information about the products catalog and the subscriber’s (client) preferences, products that he doesn’t own yet, the history of his purchases, his reaction towards bank offers and his previous transactions
• The NBO Engine: Considered as the heart beating of the whole solution. It will contain a panoply of data science and machine learning techniques that will take the input data provided by the gathering module, then find clear patterns upon which it will be determined the product that is more likely to be purchased by the customers
• The Interaction Channels: Considered as the client’s most preferred communication channels as well as the best timing for contacting him about the offer. These 2 points are considered the most important factors for increasing the probability of success of the offer.
The final feedback issued from the client following the predicted best offer is also participating in empowering the NBO Engine. This is how the NBO engine learns the recommendation training system
29
5.3. T
HEM
ILLENNIUMBCP
R
OADMAP FOR THE IMPLEMENTATION OF THEN
EXTB
ESTO
FFER2.0
(Andrea Fabrizi, 2014) in their technical HP Paper of “Next Best Offer: How to re-think your marketing” have defined a strong customer-centric platform that predicts the best suited product for each of their client. Their solution relies strongly on the information gathering module and the NBO engine. This solution is usually the recommended one for companies wishing to switch their traditional marketing. Therefore, since Millennium BCP is a bank that offers a big number of products and services to a wide universe of clients and companies, the architecture from (Andrea Fabrizi, 2014) cannot be followed nor applied to the letter due to the lack of some important aspects. For instance, the bank does not possess a fixed rating system that can be easily applied following the usage of a given product by a given client. There exist some reports about customer satisfaction only for the most purchased products thus it is needless to draw a rating from these reports. Moreover, it would be time consuming to collect ratings from clients upon basic services or products they might even be neutral towards them. Another reason is that more than 90% of the products that a bank offers are products that if purchased by clients might present a percentage of risk. Risky products for example such as a habitation loan or a personal loan cannot be recommended to a client that presents imparity signs in the bank
Consequently, only some components of the (Andrea Fabrizi, 2014)’s model would be considered as sources of inspiration to reach an adequate roadmap for an implementable solution. Hence, The Millennium BCP roadmap for the implementation of the Next Best Offer 2.0 would mainly rely on 5 pillars which are the following.
• The list of the recommendable products • The communication profile of each client
• Recommendation System through the similarity Matrix • The propensity models
• Visits and simulations in the MBCP Website
The output of these 5 pillars will be gathered to a scoring system that will attribute a score to each pillar, then the next best offer will be deduced from the pillar with the highest score. A consideration would also be given to the pillar that has the second score. The following figure explains how the new architecture of the Next Best Offer would work.
30 Figure 22 : Millennium BCP roadmap to the Next Best Offer 2.0
The list of recommendable products englobes all the products that can be recommended to clients who haven’t own them yet. From this list that also has information about the clients who possess those products or not, the communication profile will be drawn on each of those clients as well as their website visits about each product page, the scores provided by the predictive models (NBO1.0) and the recommended products given by the similarity matrix. After that, these results are assessed by a rating system that attributes coefficients to the components that provide a product to recommend
5.3.1. The list of the recommendable products
The bank provides a wide variety of products with many customized functionalities oriented to clients from different segments other than mass-market. Thus, to reach the most suitable product to recommend to the client, a list should be established for products that can possibly be recommended to the client. To know that, the clients must check all the eligibility rules that this product has. On a large scale, the initial base of clients to analyze must check all the conditions for all the products in the list of the recommendable products. By adopting this strategy, there will be avoided cases in which the next best product to recommend for a client would be a product that he doesn’t have the right to acquire. Therefore, the starting point for building this list would be defining the list of the products with respect to their product categories. Then the clients would be deducted by gathering all the clients that satisfy all the eligibility rules stated by each product category.
31 Figure 23 : Building the List of recommendable products
This process can be repeated a lot of times as long as the definition of this list depends on the products that were chosen before. The choice of the products can be done by 3 different ways: The first one is using all the products of a product category. In this case, there won’t be a lot of eligibility rules to verify which means clients with interest over one product category would be more likely to be targeted and their eventual next best offer would be more of an upgrade or a substitution of a product. Another way is to guarantee that the products chosen would be from different products categories. In this case, the next best offer would be a product to increase diversity possession. Then the other way is more oriented to the business logic in a way that some products are chosen for analysis due to some pre-defined rules by other bank divisions.
5.3.2. The Communication Profile of the client
Contrarily to the other pillars, this aspect of the analysis doesn’t relate strongly to the next best offer. However, as it is considered a behavioral study for each client. It will help give a general idea of how the client reacts to the previous marketing campaigns communicated to them. Therefore, it has been selected only the communications of marketing campaigns with acquisition or sale purposes to make sure we get the proper behavior from the client towards this type of marketing campaigns. In the DataMart SAS library, there is a daily updated table that gathers all the marketing campaigns that the client received. Depending on the type of response the client will give following the campaign, a rate of positive reception of the offer suggested by the campaign is created to assess the openness of he clients to the acquisition/Sale marketing campaigns. This analysis has been done following two approaches. Analyzing all the communications through human and non-human channels to have an idea of what is the favorite means of communication of the client. The second approach is looking at the communications received by the clients and group them by product category. Therefore, the output will be a personal profile per client for each product category. That will help to determine if the client has a preference or interest for some types of products over the others.
32 Figure 24 : Table of the clients and their communication profile
There has also been created categories based on the values of the success rate of the past communications to make it easier for other future analysis. The categories have been classified as the following rules shown in this piece of code
Figure 25 : Classes of the communication profile
The classes are translated here:
• 1-Frio = Cold (Success rate between 0 and 20%)
• 2-Pouco Frio = Less cold (Success rate between 20 and 40%) • 3-Moderado = Moderate (Success rate between 40 and 60%) • 4-Receptivo = Reptive (Success rate between 60 and 80%)
• 5-Altamente Receptivo = Highly Receptive (Success rate between 80 and 100%)
Looking at both approaches, it has been opted to adopt the second one that includes the communication profile per product family, maintaining the same classes explained above.
33
5.3.3. The Recommendation System using a similarity matrix between products
5.3.3.1. Definitions and theoretical concepts
Following the same logic of the Next Best Offer, there exist many products purchased by a big number of clients. One reason behind may be the positive satisfaction of the clients or simply because they are the most sold products in the bank. One good idea is indeed try to identify the group of clients that do not possess the most sold products in the aim of increasing upselling. This is the goal of the Recommendation Systems that are going to be implemented in the bank. Among the main pillars of the NBO Engine, it will be granted a special attention to its output since it focuses on the products that the client is more likely to buy according to (Miao Nie & Shanshan Cong, 2016). According to the same reference, A Recommendation System is a machine learning technique that consists of suggesting one or several items to be obtained by a user (Client in this case). There are various approaches that can be used to recommend products to customers. (Robin Burke, 2008) distinguishes between 5 different ones. Only the main 3 mostly used will be cited.
• Content-Based: This type of recommendation systems recommend products to clients based on the positive feedback that they had upon their possession of these products. It also calculates the degree of similarity between products based on the characteristics that each product contains.
• Collaborative filtering: This recommendation system finds patterns between products liked by a big number of clients. It calculates the similarity based on the rating given to each of the products by the clients. Therefore, it is used to recommend the similar products not possessed by other clients to themselves.
• Demographic: This type recommends items to clients with a particular demographic background (Age,Country, Income etc…). It is usually applied on clusters of clients that have different demographic profiles to understand the preferences of each cluster that are assumed to be different.
5.3.3.2. The Recommendation System practically in the CRM Team
A content-based recommendation would be the ideal type of recommendation systems to build since it takes into consideration not only the reviews of the client but also the features of each product. Thus, the outcome of this approach will be based on both clients and items. But given the fact that the bank has 10 product categories with hierarchies that can go up to the 5th level of granularity which would result into more than 800 different products, collecting reviews on each product from each client from the monthly customer satisfaction reports would be a very heavy task. Thus, it has been opted to build the CRM Recommendation System using the collaborative filtering method without considering the reviews or ratings form the customer. (Rajendra LVN, 2014) have drawn a
34 roadmap of building a user-based recommendation system. In other words, it is based on whether the client read or not read a book for example. Thus, instead of liking the product which is the main event on which most recommendation systems rely on, there will be considered the event of possessing a given product in the bank or not.
Given the massive number of single products in the bank, computational resources will be highly needed to perform the process of computing similarity matrices. Thus, to avoid this problem, it makes sense to proceed first by doing some pre-prediction on the category of the Next Best Product that the client is more likely to buy. Then, build the recommendation system based on the products of this product category. Some product categories like debit cards or credit cards count more than 70 different cards. Computing a recommendation system with 70 products is also considered as resource consuming.
Therefore, it has been chosen to compute the recommendation system between the first 8 more detained products within this category. In the other hand, if the category has less than 8 products, all the products will be used to build the recommendation system.
5.3.3.3. Roadmap for building the CRM Recommendation System
Many approaches can be explored for determining the NBO’s product category of a given client. The most straightforward candidate families of product would be the ones whose clients do not own yet any product from that category. Consequently, the easiest product category to sell from a marketing point of view would be the one candidate. The problem can also be tackled analytically using two different methods.
• Using what would be called as an “outer-recommendation system” (Applied on product categories)
• Using a predictive model with a multi-nominal target • Using a hybrid method of both above
Building the CRM Outer-Recommendation system
As stated before, this model will serve to predict the product category that the client is more likely to purchase. In other words, there will be depicted the different behaviors of the clients towards the panoply of products offered by millennium BCP. This overview would come with a great help towards the probable Next Best Offer of each client.