U
NIVERSIDADE DEL
ISBOAF
ACULDADE DEM
OTRICIDADEH
UMANATeam performance according to ball possession
characteristics:
A social networks approach
Dissertação elaborada com vista à obtenção do Grau de Mestre
em Treino de Alto Rendimento
Orientador: Professor Doutor Ricardo Filipe Lima Duarte
Júri
:
Presidente:
Professor Doutor Fernando Paulo de Oliveira Gomes
Vogais:
Professor Doutor Ricardo Filipe Lima Duarte
Professor Doutor Hugo Miguel Cardinho Alexandre Folgado
Sérgio filipe da Silva Tomás
Outubro 2015
“O rio atinge os seus objectivos porque aprendeu
a contornar os obstáculos.” Lao Tsé
“O importante não é justificar o erro, mas sim
impedir que ele se repita.” Che Guevara
IV
Agradecimentos
Este espaço é dedicado a todos os que contribuíram de uma forma directa ou indirecta para a realização desta dissertação e a quem aproveito para expressar os meus mais sinceros agradecimentos.
Ao meu orientador, professor doutor Ricardo Duarte, por poder contar sempre com o seu apoio e incentivo, principalmente nos momentos mais difíceis quando me voltava a fazer acreditar que era possível. O seu reconhecimento, a confiança e a palavra amiga nos momentos chave foram fundamentais para a realização desta dissertação.
Pretendo agradecer também aos meus colegas de Mestrado em Treino de Alto Rendimento do ano de 2012/2013 com quem tive o prazer de partilhar experiências, conviver e criar laços de amizade que de certeza irão perdurar ao longo do tempo.
Aos meus pais, por sempre me apoiarem e incentivarem de forma incondicional em todos os momentos. Quero partilhar com eles a alegria deste momento, a emoção de ter atingido esta meta, um objectivo pessoal mas que em grande parte a eles lhe devo. Uma palavra muito especial aos dois, pois cada um de sua forma, ao longo de todo este trajecto estiveram sempre ao meu lado apesar da distância que nos separou e através de uma panóplia de emoções e sentimentos (preocupações e apreensões, choro, riso…) que partilhámos. Não seria nada sem vós, o exemplo que me deram seguir-me-á para sempre.
À minha namorada por fazer parte da minha família. Pela paciência, apoio e compreensão em todos os momentos. Pelo carinho das palavras que sempre me transmitiam força e determinação para nunca desistir, e… por aquela ternura no olhar que me fez chegar até aqui!
A todos vós e todos aqueles com quem partilhei momentos bons e menos bons, experiências enriquecedoras e várias horas, dias e meses desta dissertação. Sem todos vós não seria possível estar hoje aqui!
V
Resumo
Ao longo dos últimos anos, o futebol entrou num período de acesso rápido a uma grande quantidade de dados de análise de jogo. As redes sociais têm sido adoptadas para revelar a estrutura e organização da rede de interacções, como as tendências de passe dos jogadores. Neste estudo investigou-se a influência das características posse de bola no sucesso competitivo das equipas Espanholas de La Liga.
A amostra foi composta por dados brutos da distribuição de passe da OPTA (n = 269.055 passes) obtidos a partir de 380 jogos onde estão envolvidas todas as 20 equipas da temporada 2012/2013. Então, geramos 760 matrizes de adjacência e as suas redes sociais correspondentes, utilizando o software Node XL. Para cada rede foram calculadas três medidas de desempenho da equipa de forma a avaliar as tendências da posse de bola: graph density, average clustering e passing intensity. Foram identificados três níveis de sucesso competitivo utilizando uma análise de grupos a dois níveis com base em duas variáveis: O total de pontos marcados por cada equipa e o rácio de golos marcados por golos sofridos.
A nossa análise revelou diferenças significativas entre desempenhos competitivos em todas as três medidas de desempenho da equipa (p <0,001). As equipas classificadas no fundo do ranking apresentaram menor número de jogadores conectados (graph density) e triangulações (average clustering) do que as equipas com ranking intermédio e de topo. No entanto, todos os três grupos divergiram em termos de intensidade de passe (passing intensity), sendo que as equipas de topo do ranking têm um maior número de passes por tempo de posse de bola, do que as equipas com ranking intermédio ou baixo. Finalmente, foram encontradas semelhanças e diferenças nos padrões de jogo das 20 equipas utilizando Cohen’s effect size.
Em suma, os resultados sugerem que o desempenho competitivo foi influenciado pela densidade e conectividade das equipas (Graph density and average clustering, respectivamente), principalmente devido à forma como as equipas usam o seu tempo de posse de bola para dar intensidade ao seu jogo.
VII
Abstract
Over the last few years, football entered in a period of accelerated access to large amount of match analysis data. Social networks have been adopted to reveal the structure and organization of the web of interactions, such as the players passing distribution tendencies. In this study we investigated the influence of ball possession characteristics in the competitive success of Spanish La Liga teams.
The sample was composed by OPTA passing distribution raw data (n=269,055 passes) obtained from 380 matches involving all the 20 teams of the 2012/2013 season. Then, we generated 760 adjacency matrixes and their corresponding social networks using Node XL software. For each network we calculated three team performance measures to evaluate ball possession tendencies: graph density, average clustering and passing intensity. Three levels of competitive success were determined using two-step cluster analysis based on two input variables: the total points scored by each team and the scored per conceded goals ratio.
Our analyses revealed significant differences between competitive performances on all the three team performance measures (p < .001). Bottom-ranked teams had less number of connected players (graph density) and triangulations (average clustering) than intermediate and top-ranked teams. However, all the three clusters diverged in terms of passing intensity, with top-ranked teams having higher number of passes per possession time, than intermediate and bottom-ranked teams. Finally, similarities and dissimilarities in team signatures of play between the 20 teams were displayed using Cohen’s effect size.
In sum, findings suggest the competitive performance was influenced by the density and connectivity of the teams, mainly due to the way teams use their possession time to give intensity to their game.
VIII
IX
Index
Agradecimentos IV Resumo V Abstract VII Table List X Graph List XI 1. Introduction 3 2. Method 6 2.1. Sample 62.2. Procedures and Variables 7
2.2.1. Competitive Success through cluster Analysis 7
2.2.2. Ball Possession Characteristics 8
2.3. Inferential Statistics 9
3. Results 11
3.1. Competitive success and passing networks 11
3.2. Team Similarities 12
4. Discussion 17
5. Conclusion 21
6. References 23
X
Table List
Table 1 – Total number of passes and effective ball possession time across all
teams in the Spanish La Liga 2013/2013 season 6
Table 2 – Performance indicators according to competitive success 7 Table 3 – Passing network characteristics according to the competitive success 11
Table 4 – Team variable descriptive values 12
Table 5 – Graph Density Multiple Comparisons 13
Table 6 – Team Clustering Multiple Comparisons 14
XI
Figure List
Figure 1 – Graph Density dissimilarity network 13
Figure 2 – Team Clustering dissimilarity network 14
3
1. Introduction
Football is a complex phenomenon mainly due to the intricate interpersonal interactions developed by team players across time. These interactions have been somewhat neglected by researchers when investigating passing trends underlying the possession game (or ball possession). In an interactive and functional way, analysing passing trends would imply capturing how pairs of players link themselves by passing the ball between each other (Passos et al., 2010). These tendencies shape preferential passing interaction tendencies within particular sub-units of a team, which consequently scale and shape the global (team) patterns of on-field ball displacements (Duch, Waitzman and Amaral, 2010). This emergent process arises once the team players share the same general intentions and goals, and are linked by common informational means (Duarte & Frias, 2011). This creates interdependence between team players and also between the individual and team behaviours (Bar-Yam, 2004). Conceptualizing and analysing passing trends based on these interactive behaviours may allow shedding some light on the current debate on the relevance of ball possession performance indicators. There are two different points of view. From one hand, some studies did not found any relation between ball possession indicators and performance outcomes (e.g., Bate, 1998; Stanhope, 2001). On the other hand, other authors found significant and positive associations between competitive success and ball possession (e.g. Hook and Hughes 2001; Jones et al., 2004; Lago-Peñas & Dellal, 2010). Based on these controversial findings, Collet (2013) performed a systematic investigation on this topic, examining a range of ball possession indicators in several competitive contexts, from European and World Cup tournaments to high-standard European football leagues. His findings revealed poor reliability of several ball possession indicators, showing that much of the success behind the ‘possession game’ is thus a function of elite teams confined in geographic and competitive space (e.g., Barcelona in Spain, Manchester United in England). Therefore, it seems researchers need to find alternative methods to inspect specific ball possession characteristics that better account for variant strategic environments (James et al., 2002) and specific teams’ signatures of play (Paixão, Sampaio, Almeida & Duarte, 2015), seeking to associate it with the performance outcomes (Araya & Larkin, 2006).
One way to capture the specific interactive passing trends characterizing a team’s ball possession is the use of social networks analysis. For instance, Grund (2012) found that successful Premier League teams are characterized by higher passing work-rate and low centralization, compared to less successful teams. This means successful teams use the ball
4
more intensively, exchanging it more frequently among a higher number of team players and, consequently, depending less on a single or few centralized/influential players. These findings agreed with suggestions from longitudinal studies showing an increase of both the number of passes and the pass completion rate as soccer evolutionary game trends (Wallace & Norton, 2014; Barnes, Archer, Hogg, Bush & Bradley, 2014). Using also social networks analysis, Duch, Waitzman and Amaral (2010) found a positive association between low centralization (highly distributed work) and the performance outcome of the 2008 European Cup winner (Spain). Another interesting feature of successful teams may be also the players’ capacity to cluster together when passing the ball. This style of play was consistently observed in the 2010 FIFA World Cup winner, the Spanish squad, mainly across the three final knock-out matches, in which the clustering coefficient values of the pass network remained high (Lopez & Touchette, 2012; Cotta, Mora, Merelo & Merelo-Molina, 2013). This data is consistent with other findings from Yamamoto & Yokoyama (2011), which showed a positive relationship between the number of triangles (i.e., three connected nodes in a passing sequence) and the successful attacks and shots produced by teams. This style of play has been anecdotally linked to the famous Barcelona’s ‘tiki-taka’. In this vein, Gyarmati and Kwak (2014) revealed this famous style of play does not consist of uncountable random passes but rather has a precise and finely singular structure. Contrary to all the teams from the five top-ranked soccer leagues, Barcelona revealed higher frequencies of pass motifs implying ball exchanges between: (i) pairs of players in a to-and-fro fashion, and; (ii) open triplets (i.e., three players connected by a minimum of two passes).
Despite all this recent insights on the relation of passing networks characteristics and performance outcome, research on soccer match analysis using social networks is still in it s infancy. And as Mackenzie and Cushion (2014) pointed, an important factor that should be taken into account is the social-cultural constraints in which case studies, or studies with low sample sizes, are performed. For instance, to what we know successful English teams are characterized by higher passing work-rate and low centralization. But, to what extent may the results found in Premier League transfer to other competitive contexts?
The purpose of this study was to examine the association of passing networks characteristics with the competitive success of Spanish La Liga teams. Moreover, we intend to analyse similarities in teams’ signatures of play between the 20 competing teams, using team level metrics. Based on the studies of Grund (2012) and Lopez and Touchette (2012), we hypothesized top-ranked teams must display higher passing work-rates, higher levels of clustering and more distributed passing flows, compared to bottom-ranked teams.
5
6
2. Method
:2.1 - Sample
The study is based on a sample of all the successful passes (n=269,055) performed during the entire Spanish La Liga 2012/2013 season, gathered from the total of 380 matches. Table 1 displays sample characteristics, with an emphasis in the passing actions and percentage of effective possession time.
Table 1 – Total number of passes and effective ball possession time across all teams in the Spanish La Liga 2012/2013 season.
Ranking Team
Total Number of Passes
% effective ball possession time ( ± SD) 1 Barcelona 26613 38.855 ± 5.200 2 Real Madrid 15960 27.434 ± 6.031 3 At. Madrid 12816 23.870 ± 4.740 4 Real Sociedad 14158 25.912 ± 5.393 5 Valencia 13928 25.625 ± 4.947 6 Málaga 14974 25.724 ± 4.318 7 Real Betis 12234 22.467 ± 4.312 8 Rayo Vallecano 14167 25.006 ± 4.307 9 Sevilla 14470 26.357 ± 6.105 10 Getafe 11243 21.603 ± 4.505 11 Levante 8843 18.311 ± 3.333 12 At. Bilbau 15157 26.681 ± 5.189 13 Espanyol 10866 21.107 ± 5.237 14 Valladolid 14240 25.221 ± 5.388 15 Granada 10325 21.379 ± 4.214 16 Osasuna 11257 22.839 ± 4.539 17 Celta Vigo 13297 23.911 ± 4.046 18 Mallorca 10208 20.938 ± 5.316 19 Deportivo 13542 24.591 ± 4.840 20 Zaragoza 10757 21.819 ± 4.767
Passing distribution raw data were obtained through the OPTA notation system. Reliability of this system was demonstrated in literature by Liu et al., (2013).
7
2.2 - Procedures and Variables
To determine the teams’ competitive success, we used the total number of points and the ratio of scored per conceded goals. A two-step cluster analysis was used to determine the competitive success/outcome clusters based on these indicators.
2.2.1- competitive success through cluster analysis
The two-step cluster analysis divided the teams in 3 clusters of competitive success with an average silhouette of 0.70 (Predictor importance: goals ratio = 1.00, points earned = 0.83). Table 2 displays the results and the cluster number of each team.
Table 2 – Performance indicators according to competitive success
Ranking Team Points GS* GT** Goals Ratio Cluster
1 Barcelona 100 115 40 2.875 1 2 Real Madrid 85 103 42 2.452 1 3 Atlético Madrid 76 65 31 2.097 1 4 Real Sociedad 66 70 49 1.429 2 5 Valência 65 67 54 1.241 2 6 Málaga 57 53 50 1.060 2 7 Real Bétis 56 57 56 1.018 2 8 Rayo Vallecano 53 50 66 0.758 2 9 Sevilla 50 58 54 1.074 2 10 Getafe 47 43 57 0.754 3 11 Levante 46 40 57 0.702 3 12 Athletic 45 44 65 0.677 3 13 Espanyol 44 43 52 0.827 3 14 Valladolid 43 49 58 0.845 3 15 Granada 42 37 54 0.685 3 16 Osasuna 39 33 50 0.660 3 17 Celta de Vigo 37 37 52 0.712 3 18 Mallorca 36 43 72 0.597 3 19 Deportivo 35 47 70 0.671 3 20 Zaragoza 34 37 62 0.597 3
8
Two-step cluster analysis divided final classification in three clusters and each cluster is composed by a different number of teams. Differences between clusters are evident through greater similarities among teams when compared to the other clusters members. Thus, cluster 1 (Top-ranked teams) is composed by the first three teams in the league table. The cluster 2 (intermediate-ranked teams) is composed by the next six teams. The third cluster (Bottom-ranked teams) is composed by the last 11 teams in the league final ranking.
2.2.2 – Ball possession Characteristics
The ball possession characteristics were measured through the following team passing network measures:
(i) Graph Density is an overall measure of the inter-connectedness of vertices and it was obtained by the ratio between the number of total edges in a graph and the maximum number of possible edges within a graph (Freeman, 1979):
Maximal density is 1 and minimum density is 0 (Coleman & Moré, 1983). Frequent ball exchange among a higher number of team players tends to approach to 1. Consequently, higher team density supports denser passing work rates (more total edges).
(ii) Team Clustering was obtained as the sum of local clustering coefficients of all the team players. The individual clustering coefficient is a measure of the degree to which nodes in a graph tend to cluster together (Holland & Leinhardt, 1971; Watts & Strogatz, 1998). This is the measure of how connected node’s neighbours are to one another. In a functional way it is the number of edges connecting node’s neighbours divided by total number of possible edges between the node’s neighbours:
Functionally, Team Clustering captures players’ capacity to cluster together when passing the ball in a sequence of two or more passes by pairs of players. It is obtained as follows:
9
(iii) Pass Intensity was given by the total number of successful passes by the percentage of ball possession. This is an arbitrary unit measure of how ball possession is exchanged and used by a team.
This intensity measure was adapted from Grund (2012) work. The higher values are equivalent to high frequency of passing per time unit. These team measures were obtained from the passing networks of each team during the entire matches. Social networks analysis was performed using Node XL software.
To inspect teams’ signatures of play we developed adjacency matrixes of the 20 analysed teams, based on the Cohen’s d effect size values (Cohen, 1988) between each pair of teams.
̅ ̅
Then, a dissimilarity network (Borgatti, Mehra, Brass & Labianca, 2009) was created for each team measure (i.e., graph density, team clustering and pass intensity), in which the nodes were the teams and the edges were the Cohen’s d values. These dissimilarity networks allow identifying pairs of teams with high degree of similarity and with larger differences for each of the passing network characteristic.
2.3 - Inferential Statistics
One-way ANOVAs, with Games-Howell’s post hoc tests, were used to examine differences in ball possession characteristics (graph density, team clustering and pass intensity) according to the competitive success.
All the statistical analyses were done in IBM SPSS Statistics 20, maintaining a significance level of 5%.
10
11
3. Results
3.1 - Competitive success and passing networks
Table 3 shows the influence of the competitive success according to the passing networks characteristics.
Table 3 – Passing networks characteristics according to the competitive success.
Competitive Success
Graph Density Team Clustering Pass Intensity ̅ ± SD Sig. ̅ ± SD Sig. ̅ ± SD Sig. Top-ranked teams cluster 1 (n=3) .745 ± .058 .001 11.546 ± .657 .001 15.737 ± 2.092 .001 Intermediate-ranked teams cluster 2 (n=6) .733 ± .061 11.456 ± .567 14.651 ± 1.393 Bottom-ranked teams cluster 3 (n=11) .704 ± .072 11.032 ± .731 13.382 ± 1.569 C1=C2*>C3* C1=C2*>C3* C1**>C2**>C3**
Games-Howell’s post hoc test, * p < .001; ** p ≤ .002
Two-way ANOVAs showed significant interaction effect between Success*Teams in all three measures, F(2,379)=7.105,p<.001, ƞ2=.273
This means that although the global trend to observe significant effects according to the final ranking, teams tend to display different passing networks characteristics within each cluster. Thus, we decided to inspect all the teams based on the notion of signatures of play using similarities networks.
12
3.2 – Team Similarities
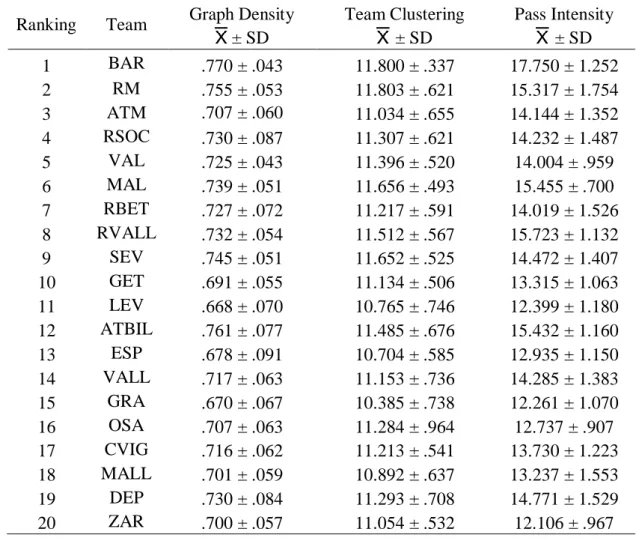
Descriptive statistics of the variables for each team used in the analysis are presented in table 4
Table 4 –Team variables descriptive values.
Ranking Team Graph Density Team Clustering Pass Intensity
± SD ± SD ± SD 1 BAR .770 ± .043 11.800 ± .337 17.750 ± 1.252 2 RM .755 ± .053 11.803 ± .621 15.317 ± 1.754 3 ATM .707 ± .060 11.034 ± .655 14.144 ± 1.352 4 RSOC .730 ± .087 11.307 ± .621 14.232 ± 1.487 5 VAL .725 ± .043 11.396 ± .520 14.004 ± .959 6 MAL .739 ± .051 11.656 ± .493 15.455 ± .700 7 RBET .727 ± .072 11.217 ± .591 14.019 ± 1.526 8 RVALL .732 ± .054 11.512 ± .567 15.723 ± 1.132 9 SEV .745 ± .051 11.652 ± .525 14.472 ± 1.407 10 GET .691 ± .055 11.134 ± .506 13.315 ± 1.063 11 LEV .668 ± .070 10.765 ± .746 12.399 ± 1.180 12 ATBIL .761 ± .077 11.485 ± .676 15.432 ± 1.160 13 ESP .678 ± .091 10.704 ± .585 12.935 ± 1.150 14 VALL .717 ± .063 11.153 ± .736 14.285 ± 1.383 15 GRA .670 ± .067 10.385 ± .738 12.261 ± 1.070 16 OSA .707 ± .063 11.284 ± .964 12.737 ± .907 17 CVIG .716 ± .062 11.213 ± .541 13.730 ± 1.223 18 MALL .701 ± .059 10.892 ± .637 13.237 ± 1.553 19 DEP .730 ± .084 11.293 ± .708 14.771 ± 1.529 20 ZAR .700 ± .057 11.054 ± .532 12.106 ± .967
13
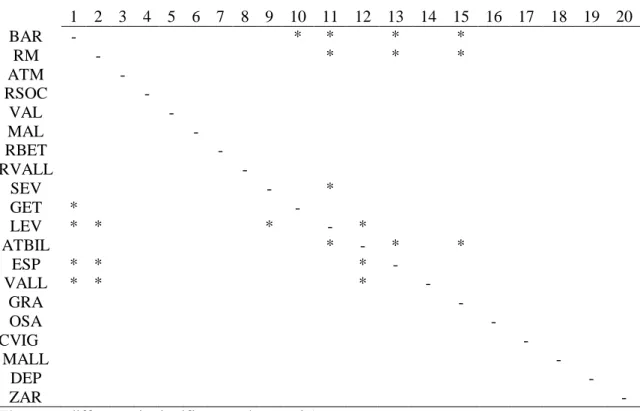
Table 5 presents significant values for multiple comparisons concerning graph density measurements.
Table 5 - Graph Density multiple comparisons
1 2 3 4 5 6 7 8 9 10 11 12 13 14 15 16 17 18 19 20 BAR - * * * * RM - * * * ATM - RSOC - VAL - MAL - RBET - RVALL - SEV - * GET * - LEV * * * - * ATBIL * - * * ESP * * * - VALL * * * - GRA - OSA - CVIG - MALL - DEP - ZAR -
The mean difference is significant at the p < .05
There was a main effect of Team, F(19,379)= 2.734, þ<.001, ƞ2 =.114
Figure 1 shows the teams’ dissimilarity network of graph density, based on Cohen’s d effect size values (Table in supplementary materials).
14
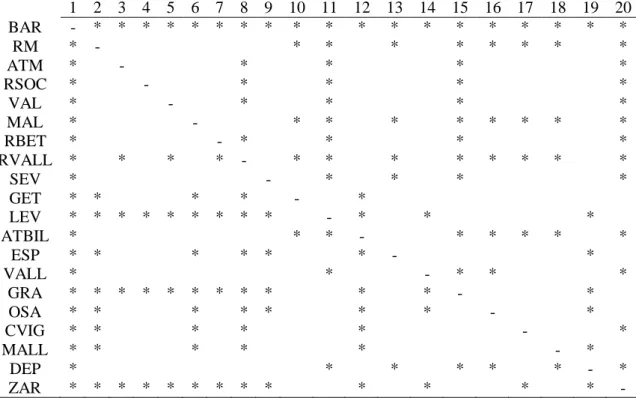
Table 6 represents significant values for multiple comparisons concerning the Team Clustering
Table 6 – Team Clustering multiple comparisons.
1 2 3 4 5 6 7 8 9 10 11 12 13 14 15 16 17 18 19 20 BAR - * * * * * RM - * * * * * ATM * * - RSOC - * VAL - * MAL - * * * * RBET - * RVALL - * * SEV - * * * * GET - LEV * * * * - ATBIL - * * ESP * * * * * * - VALL - * GRA * * * * * * * * * * - * * * OSA * - CVIG * - MALL * * * * - DEP * - ZAR -
The mean difference is significant at the p < .05
There was a main effect of Team, F(19,379)= 4.448, þ< .001, ƞ2 = .174
Figure 2 shows the teams’ dissimilarity network of team clustering, based on Cohen’s d effect size values (Table in supplementary materials).
15
Table 7 presents significant values for multiple comparisons concerning to Pass Intensity.
Table 7 – Pass Intensity multiple comparisons.
1 2 3 4 5 6 7 8 9 10 11 12 13 14 15 16 17 18 19 20 BAR - * * * * * * * * * * * * * * * * * * * RM * - * * * * * * * * ATM * - * * * * RSOC * - * * * * VAL * - * * * * MAL * - * * * * * * * * RBET * - * * * * RVALL * * * * - * * * * * * * * SEV * - * * * * GET * * * * - * LEV * * * * * * * * * - * * * ATBIL * * * - * * * * * ESP * * * * * * - * VALL * * - * * * GRA * * * * * * * * * * * - * OSA * * * * * * * - * CVIG * * * * * - * MALL * * * * * - * DEP * * * * * * - * ZAR * * * * * * * * * * * * * -
The mean difference is significant at the p < .05
There was a main effect of Team, F (19,379) = 14.802, þ < .001, ƞ2 = .411
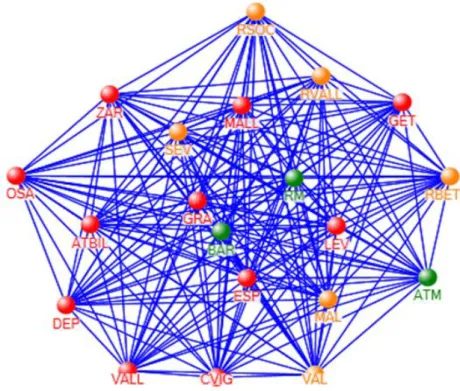
Figure 3 shows the teams’ dissimilarity network of pass intensity, based on Cohen’s d effect size values (Table in supplementary materials).
16
17
4. Discussion
The aim of this study was to examine the association between passing networks characteristics and the competitive performance of Spanish La Liga teams. Although the relation between ball possession and outcome is yet controversial, some literature suggests that different signatures of play may exist in successful and unsuccessful teams (e.g., Lago-Peñas et al., 2011). Although the specificity of each team’s signature of play, the data obtained in this study generally supports the notion that teams tend to display passing networks with different properties as a function of the final position in the league ranking, i.e., the competitive success.
The graph density results indicated that top and intermediate-ranked teams showed higher number of players connected by passing edges than bottom-ranked teams. Also, top- and intermediate-ranked teams displayed a higher tendency for the players cluster together, compared to bottom-ranked team players. These findings are in line with prior studies. For instance, the denser passing networks were associated to the more successful Premier League teams (Grund, 2012). Also, Lopez and Touchette (2012) found the two finalist teams of the 2010 FIFA World Cup (Spain and Netherlands) were the teams with higher connectivity (i.e., density) from the last 16 stage. The team clustering of Spain and Netherlands’ passing networks were also the highest, while keeping lower betweenness scores. According to the same authors, this is a reflection of the ‘total football’ and ‘tiki-taka’ styles, in which well-connected players constantly pass the ball around. This last style of play was linked somewhere with higher frequency of triplets (Gyarmati & Kwak, 2014), such as we observed in the top-ranked teams of the present study. The two best-classified teams of our sample (Barcelona and Real Madrid) were clearly the two teams with higher team clustering values. These findings in soccer agreed with studies of team performance in other natural contexts, in which densely configured interpersonal ties were associated to higher levels of goal achievement and a commitment to stay together (i.e., team viability) (Balkundi & Harrison, 2006).
Concerning pass intensity, our analyses revealed significant differences between the three clusters of competitive success. Top-ranked teams showed the greatest values, followed by the intermediate and bottom-ranked teams, respectively. Thus, teams that use its possession time to give pass intensity to its game tended to finish the competition as a top-ranked team. On the contrary, teams with low passing work-rate tended to rely on unwanted bottom positions in the final league ranking. This data is in agreement with findings of Grund
18
(2012) in Premier League teams, suggesting a potential generalisation of this notion for competitive contexts others than England and Spain professional leagues. This finding also underlines the importance the passing actions have in contemporary soccer, either quantitatively with a trend for an increase in the number of passes per game (Wallace & Norton, 2014), but also qualitatively, with the increase in the percentage of passing accuracy (Barnes et al., 2014). Since the game time in play tend to decrease (Wallace & Norton, 2014), although the mentioned increase in the number and quality of passing actions, the pass intensity seems to constitute a key performance indicator discriminating successful team performance in soccer (Hughes & Bartlett, 2002; Rampinini, 2009)
Despite the differences found in passing networks characteristics according the final position in La Liga ranking, an inspection of mean values suggested some teams within a common cluster are more similar than others. Thus, we examined teams’ similarities starting from the idea that each team has its own signature of play (Hughes & Reed, 2005). For example, Paixão et al. (2015) demonstrated that top-ranked European teams tended to differently adapt the length of their passing sequences as a function of the evolving scoreline. Here, we tried to determine the existence of similarities through Cohen’s d effect size measures and qualitatively analyse the topological distribution of teams.
Regarding to the higher graph density teams, Barcelona, Real Madrid and Sevilla (.770±043; .755±.053; and .745±.051, respectively), are all top and intermediate-ranked teams. For the lower values there are teams like Levante, Granada and Espanyol (.668±.070; .670±.067 and .678±.091, respectively, see Table 4), all of those belong to bottom-ranked teams. On team clustering, teams with higher values were Real Madrid, Barcelona, Málaga and Sevilla (11.203±.629; 11.800±.337; 11.656±.493 and 11.652±.525, respectively), which relied on top and intermediate-ranked teams. On the contrary, the lower team clustering values were obtained by teams with less triangular passing combinations, such as Granada, Espanyol, Levante and Mallorca (10.385±.738; 10.704±.585; 10.765±.746 and 10.892±.637, respectively), which relied on the bottom cluster. This is an indicator of similarities and we suggest it is possible to identify higher values of graph density and team clustering as a signature of play of successful Spanish La Liga teams. This can also be seen on graph 1 and 2 where it is also possible to check the few connection of some nodes.
The other measure in study, pass intensity, revealed some interesting details on teams’ similarities networks. The league winner, Barcelona, revealed the highest pass intensity value (17.750±1.252). This measure clearly places Barcelona away from Zaragoza (12.106±.967) or Granada (12.261±1.070), teams relying on the bottom half of the league ranking. There are other intermediate teams in league ranking which displayed also intermediate pass intensity
19
values, such as Sevilla, Valencia or even At. Bilbau (14.472±1.407; 14.004±.959 and 15.432±1.160, respectively). Through networks pass intensity topological representation (see Figure 3), it is possible to confirm Barcelona’s low similarity with others bottom-ranked teams (red nodes), which are tightly connected apart between themselves. A strong connection between them (Blue loaded dash), e.g. Zaragoza, Granada, Levante, Mallorca, Osasuna and Espanyol, reveals that a typical signature of play of bottom-ranked teams may be slow passing flows. It is also possible to observe weaker ties (light blue dash) between top-ranked (green nodes) and intermediate-top-ranked teams (orange nodes), e.g. Real Madrid, Sevilla and Real Sociedad, to bottom-ranked teams (red nodes). Importantly, it is also possible to observe a strong tie between Barcelona and Real Madrid, the first and second teams in the final league ranking.
20
21
5. Conclusion
Our work confirms previous findings about the link between levels of interaction and density with competitive success through passing networks. Higher levels of open triplets and low centrality lead to greater competitive success. These results are greater has teams’ pass intensity increase (Grund, 2012, Lopez & Touchette, 2012).
Despite the differences in passing network characteristics, some teams within a common cluster tend to resemble. Our findings suggest there are similarities when using higher values of graph density and team clustering. When using pass intensity as an indicator it is easier to identify different signatures of play due to the existing dissimilarities between all clusters.
22
23
6. References
1. Araya, J. A. & Larkin, P. (2006). Key performance variables between the top 10 and bottom 10 teams in the English Premier League 2012/13 season. University of Sidney papers in HMHCE, 17-23.
2. Balkundi, P. & Harrison, D. A. (2006). Ties, leaders and time in teams: Strong inference about network structure´s effects on team viability and performance. Academy of
Management Journal, 49:1, 49-68.
3. Barnes, C., Archer, D. T., Hogg, B., Bush, M. & Bradley, P. S. (2014). The evolution of physical and technical performance parameters in the English Premier League.
International journal of Sports Medicine, 35, 1095-1100. DOI: 10.1055/s-0034-1375695
4. Bar-Yam, Y. (2004). Making things work. Cambridge, MA: NECSI Knowledge Press. 5. Bate, R. (1988). Football chance: tactics and strategy. Science and Football (edited by T.
Reilly, A. lees, K. Davids and W. Murphy), London: E & FN Spon, 293-301
6. Borgatti, S.P., Mehra, A., Brass, D. and Labianca, G. (2009). Network Analysis in the Social Sciences. Science. 323(5916),892 - 895
7. Cohen, J. (1988). Statistical power analysis for the behavior sciences. Second Edition, Department of psychology, NY University, NY, 8, 273-406
8. Coleman, T.F. & Moré, J.J. (1983). Estimation of sparse Jacobian matrices and graph coloring problems. SIAM Journal of Numerical Analysis, 20:1, 187-209 DOI: 10.1137/0720013
9. Collet, C. (2013). The possession game? A comparative analysis of ball retention and team success in European and International football, 2007-2010, Journal of Sports
Sciences, 31:2, 123-136. DOI: 10.1080/02640414.2012.727455
10. Cotta, C., Mora, A. M., Merelo, J. J. & Merelo-Molina, C. (2013). A network analysis of the 2010 FIFA World Cup champion team play. Journal of Systems Science and
Complexity, 26, 21-42. DOI: 10.1007/s11424-013-2291-2
11. Duarte, R. & Frias, T., (2011). Collective intelligence: An incursion into the tactical performance of Football teams. Faculty of Human kinetics, Lisbon, Portugal
12. Duch, J., Waitzman, J. S., Amaral, L.A.N. (2010). Quantifying the performance of individual players in a team activity. PLos ONE 5(6): e10937. DOI:
10.1371/journal.pone.0010937
13. Freeman, L. C. (1978). Centrality in social networks, conceptual clarification. Social
24
14. Grund, T. U. (2012). Network structure and team performance: the case of English Premier League soccer teams. Social.Networks., DOI: 10.1016/j.socnet.2012.08.004 15. Gyarmati, L. & Kwak, H. (2014). Searching for a unique style in soccer. Qatar computing
research institute. DOI: 1409.0308v1
16. Holland, P.W. & Leinhardt, S. (1971). Transitivity in structural models of small groups. Comparative Group Studies 2, 107-124
17. Hook, C. & Hughes, M. (2001). Patterns of play leading to shots in ‘EURO2000’. In:
Pass.com. Ed: CPA (Center for Performance Analysis). Cardiff: UWIC, 295-302
18. Hughes, M., & Bartlett, R. (2002). The use of performance indicators in performance analysis. Journal of Sports Sciences, 20:10, 739-754
19. Hughes, M. D. & Reed, D. (2005). Creating a performance profile using perturbations in soccer. Proceedings of 4th international scientific conference on kinesiology, Opatija, University of Zagreb, Croatia, September
20. James, N., Mellalieu, S. & Holley, C. (2002). Analysis of strategies in soccer as a function of European and domestic competition. International journal of performance
Analysis in sport, 2, 85-103
21. Jones, P., James, N. & Mellalieu, S. D. (2004). Possession as a performance indicator in soccer. International Journal of performance Analysis in Sport, 4:1, 98-102
22. Lago-Peñas, C. & Dellal, A. (2010). Ball possession strategies in elite soccer according to the evolution of the match-score: the influence of situational variables. Journal of Human
Kinetics, 25, 93-100
23. Lago-Peñas, C., Lago-Ballesteros, J. & Rey, E. (2011). Differences in performance indicators between winning and losing teams in the UEFA Champions League. Journal
of Human Kinetics, 27 (III), 135-146
24. Lopez, J. & Touchette, H. (2012). A network theory analysis of football strategies. C. Clanet (ed.), Sports Physics: Proc. 2012 Euromech Physics of Sports Conference, 517-528. DOI:1206.6904v1
25. Liu, H. Hopkins, W., Gómez, M. Molinuevo, J. (2013). Inter-operator reliability of live football match statistics from OPTA Sports data. International journal of performance
analysis in Sport, 13:3, 803-821
26. Mackenzie, R. & Cushion, C. (2012). Performance analysis in football: A critical review and implications for future research. Journal of sports sciences, 31:6, 631-676, DOI: 10.1080/02640414.2012.746720
25
27. Paixão, P., Sampaio, J., Almeida, C. H. & Duarte, R. (2015). How does match status affects the passing sequences of top-level European soccer teams? International journal
of Performance in Sport, 15, 229-240
28. Passos, P., Davids, K., Araújo, D., Paz, N., Minguéns, J. & Mendes, J. (2010). Networks as a novel tool for studying team ball sports as complex social systems. Journal of
science and medicine in sport, 14, 170-176. DOI:10.1016/j.jsams.2010.10.459
29. Rampinini, E., Impellizzeri, F.M., Castagna, C., Coutts, A.J., Wisloff, U., (2009). Technical performance during soccer matches of the Italian Serie A league: Effect to fatigue and competitive level. Journal of Sports Science and Medicine in Sport, 12, 227-233
30. Stanhope, J. (2001). An investigation into possession with respect to time, in the soccer world cup 1994. In: National Analysis of Sport III. Ed: Hughes, M.D.Cardiff, UK: UWIC. 155-162
31. Wallance, J. L. & Norton, K. I. (2013). Evolution of World Cup Soccer final games 1966-2010: Game structure, speed and play patterns. Journal of Science and Medicine in
Sport, 17, 223-228. DOI: 10.1016/j.jsams.2013.03.016
32. Watts, D.J. & Strogatz, S.H. (1998). Collective dynamics of small-world networks.
Nature, 393, 440-442
33. Yamamoto, Y. & Yokoyama, K. (2011). Common and unique network dynamics in football. PLoS ONE, 6:12: e29638. DOI:10.1371/journal.pone.002963B
26
27
Graph Density Cohen’s d effect size matrix
BAR RM ATM RSOC VAL MAL RBET RVALL SEV GET LEV ATBIL ESP VALL GRA OSA CVIG MALL DEP ZAR
BAR 0,000 0,311 1,227 0,599 1,041 0,673 0,747 0,797 0,536 1,623 1,770 0,150 1,309 1,004 1,784 1,178 1,025 1,346 0,606 1,404 RM 0,311 0,000 0,870 0,365 0,624 0,324 0,466 0,449 0,201 1,213 1,421 0,084 1,053 0,676 1,422 0,838 0,693 0,977 0,364 1,023 ATM 1,227 0,870 0,000 0,302 0,360 0,579 0,296 0,442 0,692 0,286 0,602 0,788 0,382 0,159 0,581 0,004 0,146 0,097 0,319 0,125 RSOC 0,599 0,365 0,302 0,000 0,056 0,133 0,038 0,034 0,222 0,534 0,780 0,386 0,583 0,169 0,764 0,294 0,180 0,380 0,008 0,405 VAL 1,041 0,624 0,360 0,056 0,000 0,281 0,013 0,129 0,414 0,709 0,994 0,568 0,675 0,167 0,984 0,342 0,183 0,473 0,068 0,513 MAL 0,673 0,324 0,579 0,133 0,281 0,000 0,201 0,135 0,125 0,914 1,163 0,341 0,834 0,391 1,157 0,556 0,407 0,686 0,126 0,727 RBET 0,747 0,466 0,296 0,038 0,013 0,201 0,000 0,087 0,303 0,561 0,827 0,467 0,597 0,145 0,811 0,285 0,158 0,384 0,048 0,413 RVALL 0,797 0,449 0,442 0,034 0,129 0,135 0,087 0,000 0,256 0,763 1,029 0,442 0,729 0,262 1,019 0,424 0,277 0,546 0,025 0,583 SEV 0,536 0,201 0,692 0,222 0,414 0,125 0,303 0,256 0,000 1,032 1,265 0,243 0,919 0,501 1,261 0,665 0,518 0,800 0,217 0,843 GET 1,623 1,213 0,286 0,534 0,709 0,914 0,561 0,763 1,032 0,000 0,362 1,055 0,174 0,442 0,335 0,281 0,431 0,186 0,558 0,162 LEV 1,770 1,421 0,602 0,780 0,994 1,163 0,827 1,029 1,265 0,362 0,000 1,268 0,120 0,735 0,032 0,591 0,725 0,516 0,806 0,498 ATBIL 0,150 0,084 0,788 0,386 0,568 0,341 0,467 0,442 0,243 1,055 1,268 0,000 0,993 0,634 1,261 0,768 0,648 0,875 0,385 0,907 ESP 1,309 1,053 0,382 0,583 0,675 0,834 0,597 0,729 0,919 0,174 0,120 0,993 0,000 0,501 0,094 0,379 0,492 0,308 0,601 0,291 VALL 1,004 0,676 0,159 0,169 0,167 0,391 0,145 0,262 0,501 0,442 0,735 0,634 0,501 0,000 0,717 0,151 0,013 0,254 0,183 0,284 GRA 1,784 1,422 0,581 0,764 0,984 1,157 0,811 1,019 1,261 0,335 0,032 1,261 0,094 0,717 0,000 0,570 0,708 0,493 0,790 0,475 OSA 1,178 0,838 0,004 0,294 0,342 0,556 0,285 0,424 0,665 0,281 0,591 0,768 0,379 0,151 0,570 0,000 0,139 0,098 0,310 0,125 CVIG 1,025 0,693 0,146 0,180 0,183 0,407 0,158 0,277 0,518 0,431 0,725 0,648 0,492 0,013 0,708 0,139 0,000 0,242 0,194 0,271 MALL 1,346 0,977 0,097 0,380 0,473 0,686 0,384 0,546 0,800 0,186 0,516 0,875 0,308 0,254 0,493 0,098 0,242 0,000 0,400 0,027 DEP 0,606 0,364 0,319 0,008 0,068 0,126 0,048 0,025 0,217 0,558 0,806 0,385 0,601 0,183 0,790 0,310 0,194 0,400 0,000 0,425 ZAR 1,404 1,023 0,125 0,405 0,513 0,727 0,413 0,583 0,843 0,162 0,498 0,907 0,291 0,284 0,475 0,125 0,271 0,027 0,425 0,000
28
Team Clustering Cohen’s d effect size matrix
BAR RM ATM RSOC VAL MAL RBET RVALL SEV GET LEV ATBIL ESP VALL GRA OSA CVIG MALL DEP ZAR
BAR 0,000 0,005 1,470 0,986 0,924 0,342 1,212 0,617 0,338 1,550 1,789 0,590 2,297 1,132 2,466 0,716 1,302 1,783 0,915 1,675 RM 0,005 0,000 1,204 0,797 0,711 0,263 0,966 0,489 0,264 1,181 1,512 0,490 1,822 0,955 2,079 0,641 1,013 1,449 0,766 1,295 ATM 1,470 1,204 0,000 0,429 0,611 1,071 0,292 0,781 1,040 0,170 0,384 0,677 0,531 0,170 0,930 0,303 0,298 0,221 0,380 0,033 RSOC 0,986 0,797 0,429 0,000 0,154 0,620 0,150 0,344 0,598 0,307 0,791 0,273 1,001 0,228 1,353 0,030 0,163 0,662 0,022 0,439 VAL 0,924 0,711 0,611 0,154 0,000 0,513 0,321 0,215 0,490 0,511 0,981 0,148 1,250 0,382 1,584 0,145 0,344 0,867 0,165 0,649 MAL 0,342 0,263 1,071 0,620 0,513 0,000 0,806 0,269 0,008 1,044 1,408 0,288 1,759 0,803 2,024 0,486 0,855 1,341 0,594 1,172 RBET 1,212 0,966 0,292 0,150 0,321 0,806 0,000 0,510 0,777 0,151 0,671 0,423 0,871 0,096 1,244 0,084 0,006 0,529 0,117 0,289 RVALL 0,617 0,489 0,781 0,344 0,215 0,269 0,510 0,000 0,254 0,705 1,129 0,044 1,404 0,548 1,713 0,290 0,540 1,030 0,342 0,834 SEV 0,338 0,264 1,040 0,598 0,490 0,008 0,777 0,254 0,000 1,004 1,374 0,275 1,705 0,780 1,977 0,474 0,822 1,302 0,575 1,130 GET 1,550 1,181 0,170 0,307 0,511 1,044 0,151 0,705 1,004 0,000 0,579 0,589 0,785 0,030 1,183 0,195 0,152 0,421 0,259 0,153 LEV 1,789 1,512 0,384 0,791 0,981 1,408 0,671 1,129 1,374 0,579 0,000 1,012 0,090 0,523 0,512 0,602 0,688 0,183 0,726 0,447 ATBIL 0,590 0,490 0,677 0,273 0,148 0,288 0,423 0,044 0,275 0,589 1,012 0,000 1,236 0,471 1,555 0,242 0,444 0,904 0,278 0,708 ESP 2,297 1,822 0,531 1,001 1,250 1,759 0,871 1,404 1,705 0,785 0,090 1,236 0,000 0,675 0,480 0,727 0,903 0,306 0,907 0,626 VALL 1,132 0,955 0,170 0,228 0,382 0,803 0,096 0,548 0,780 0,030 0,523 0,471 0,675 0,000 1,042 0,153 0,094 0,379 0,195 0,153 GRA 2,466 2,079 0,930 1,353 1,584 2,024 1,244 1,713 1,977 1,183 0,512 1,555 0,480 1,042 0,000 1,047 1,279 0,735 1,256 1,040 OSA 0,716 0,641 0,303 0,030 0,145 0,486 0,084 0,290 0,474 0,195 0,602 0,242 0,727 0,153 1,047 0,000 0,090 0,480 0,011 0,295 CVIG 1,302 1,013 0,298 0,163 0,344 0,855 0,006 0,540 0,822 0,152 0,688 0,444 0,903 0,094 1,279 0,090 0,000 0,544 0,127 0,296 MALL 1,783 1,449 0,221 0,662 0,867 1,341 0,529 1,030 1,302 0,421 0,183 0,904 0,306 0,379 0,735 0,480 0,544 0,000 0,596 0,277 DEP 0,915 0,766 0,380 0,022 0,165 0,594 0,117 0,342 0,575 0,259 0,726 0,278 0,907 0,195 1,256 0,011 0,127 0,596 0,000 0,381 ZAR 1,675 1,295 0,033 0,439 0,649 1,172 0,289 0,834 1,130 0,153 0,447 0,708 0,626 0,153 1,040 0,295 0,296 0,277 0,381 0,000
29
Team Intensity Cohen’s d effect size matrix
BAR RM ATM RSOC VAL MAL RBET RVALL SEV GET LEV ATBIL ESP VALL GRA OSA CVIG MALL DEP ZAR
BAR 0,000 1,597 2,767 2,560 3,360 2,263 2,673 1,698 2,462 3,819 4,400 1,921 4,005 2,627 4,714 4,586 3,248 3,200 2,133 5,046 RM 1,597 0,000 0,749 0,667 0,929 0,103 0,790 0,275 0,532 1,381 1,953 0,077 1,606 0,654 2,104 1,848 1,050 1,256 0,332 2,268 ATM 2,767 0,749 0,000 0,061 0,119 1,217 0,087 1,266 0,237 0,682 1,375 1,022 0,963 0,103 1,545 1,222 0,322 0,623 0,434 1,734 RSOC 2,560 0,667 0,061 0,000 0,182 1,052 0,141 1,129 0,166 0,709 1,365 0,900 0,975 0,037 1,522 1,214 0,369 0,654 0,357 1,695 VAL 3,360 0,929 0,119 0,182 0,000 1,728 0,012 1,639 0,388 0,681 1,494 1,342 1,010 0,236 1,717 1,358 0,250 0,595 0,601 1,972 MAL 2,263 0,103 1,217 1,052 1,728 0,000 1,209 0,285 0,885 2,377 3,151 0,024 2,646 1,068 3,533 3,355 1,731 1,842 0,576 3,968 RBET 2,673 0,790 0,087 0,141 0,012 1,209 0,000 1,268 0,308 0,535 1,188 1,042 0,802 0,183 1,334 1,021 0,209 0,508 0,492 1,497 RVALL 1,698 0,275 1,266 1,129 1,639 0,285 1,268 0,000 0,980 2,193 2,875 0,254 2,442 1,138 3,144 2,911 1,691 1,830 0,708 3,436 SEV 2,462 0,532 0,237 0,166 0,388 0,885 0,308 0,980 0,000 0,928 1,596 0,745 1,195 0,134 1,769 1,465 0,563 0,833 0,203 1,960 GET 3,819 1,381 0,682 0,709 0,681 2,377 0,535 2,193 0,928 0,000 0,815 1,903 0,343 0,786 0,988 0,585 0,362 0,059 1,106 1,190 LEV 4,400 1,953 1,375 1,365 1,494 3,151 1,188 2,875 1,596 0,815 0,000 2,593 0,460 1,467 0,123 0,321 1,107 0,608 1,737 0,272 ATBIL 1,921 0,077 1,022 0,900 1,342 0,024 1,042 0,254 0,745 1,903 2,593 0,000 2,161 0,899 2,842 2,588 1,428 1,602 0,487 3,115 ESP 4,005 1,606 0,963 0,975 1,010 2,646 0,802 2,442 1,195 0,343 0,460 2,161 0,000 1,061 0,607 0,192 0,669 0,221 1,357 0,781 VALL 2,627 0,654 0,103 0,037 0,236 1,068 0,183 1,138 0,134 0,786 1,467 0,899 1,061 0,000 1,637 1,324 0,425 0,713 0,333 1,826 GRA 4,714 2,104 1,545 1,522 1,717 3,533 1,334 3,144 1,769 0,988 0,123 2,842 0,607 1,637 0,000 0,480 1,278 0,732 1,902 0,152 OSA 4,586 1,848 1,222 1,214 1,358 3,355 1,021 2,911 1,465 0,585 0,321 2,588 0,192 1,324 0,480 0,000 0,922 0,393 1,618 0,673 CVIG 3,248 1,050 0,322 0,369 0,250 1,731 0,209 1,691 0,563 0,362 1,107 1,428 0,669 0,425 1,278 0,922 0,000 0,352 0,752 1,472 MALL 3,200 1,256 0,623 0,654 0,595 1,842 0,508 1,830 0,833 0,059 0,608 1,602 0,221 0,713 0,732 0,393 0,352 0,000 0,995 0,875 DEP 2,133 0,332 0,434 0,357 0,601 0,576 0,492 0,708 0,203 1,106 1,737 0,487 1,357 0,333 1,902 1,618 0,752 0,995 0,000 2,083 ZAR 5,046 2,268 1,734 1,695 1,972 3,968 1,497 3,436 1,960 1,190 0,272 3,115 0,781 1,826 0,152 0,673 1,472 0,875 2,083 0,000