Universidade de Lisboa
Faculdade de Ciências
Departamento de Q
The role of glucose in
Universidade de Lisboa
Faculdade de Ciências
Departamento de Química e Bioquímica
The role of glucose in Plasmodium liver infection
Joana Sales Dias
Mestrado em Bioquímica
Bioquímica Médica
2011
uímica e Bioquímica
Universidade de Lisboa
Faculdade de Ciências
Departamento de Q
The role of glucose in
Orientador
Orientador interno Dr.ª Margarida Telhada
Universidade de Lisboa
Faculdade de Ciências
Departamento de Química e Bioquímica
The role of glucose in Plasmodium liver infection
Joana Sales Dias
Mestrado em Bioquímica
Orientador externo Dr. Miguel Prudêncio
Orientador interno Dr.ª Margarida Telhada
2011
uímica e Bioquímica
liver infection
Dr. Miguel Prudêncio
Orientador interno Dr.ª Margarida Telhada
Instituto de Medicina Molecular
Unidade da Malária
The role of glucose in Plasmodium liver infection
Joana Sales Dias
Mestrado em Bioquímica
Orientador externo Dr. Miguel Prudêncio
Orientador interno Dr.ª Margarida Telhada
i
Agradecimentos
Em primeiro lugar, gostaria de agradecer à Maria Mota e Miguel Prudêncio pela oportunidade que me deram de realizar o estágio de mestrado na Unidade da Malária do Instituto de Medicina Molecular. Um obrigado também à professora Margarida Telhada por ter aceitado ser orientadora interna da minha tese.
Gostaria ainda de agradecer a todos os colegas e amigos da Unidade da Malária e do grupo de parasitologia sem os quais a realização deste trabalho não teria sido possível. Obrigado Patrícias, Joana, Inês, Anas, Audrey, Fernanda, Vanessa, Eliana, Ghislain, Daniel, Maurice, Francisco e a todos os outros que contribuíram para a realização do trabalho, que me deram conselhos e que tanto me ensinaram. Obrigada também aos membros Carina, Filipa e Teresa que, apesar de já não fazerem parte da Unidade, muito me auxiliaram e sempre se disponibilizaram para estar ao meu lado quando eu precisasse. Um obrigado muito especial ao Miguel e à Liliana por me terem orientado ao longo deste trabalho e por terem lido e relido a minha tese vezes sem conta. Obrigada pela infinita paciência e pelo tempo que me dispensaram.
Obrigada à minha família, em especial aos meus pais e à minha maninha, porque me ouviram sempre quando as coisas não corriam bem, porque me apoiaram incondicionalmente com muita paciência e compreenssão.
Obrigado às minhas meninas, às minhas Ritas, à minha Inês, à minha Faia, à minha Catarina pelos cafés e incentivo que me deram. E já agora, obrigada também ao Zeca que acha que me esqueço sempre dele. Um Obrigado muito especial ao Henrique que me transmitiu sempre uma força enorme e esteve sempre ao meu lado. Desculpa a falta de tempo e as minhas crises de mau humor!
Obrigado a todos da Comunidade por não me deixarem esquecer as coisas que são realmente importantes e que me fizeram sempre sorrir. Obrigada, Vânia, Júlia, David, Maria, Catarina, Danielas, Armandinho, Cláudio, Stephanie, Joana e todos os meninos e meninas da Escola da Paz.
Obrigado a todos os meus colegas de curso em especial à Sofia, ao Diogo, ao Jorge, ao Pedro, à Inês e aos “Joões” porque estiveram ao meu lado em todo o meu percurso académico, apoiando-me sempre.
Por último obrigado a todos os que não referi aqui mas que também desempenharam um papel importante tanto na minha formação pessoal e académica.
iii
Abbreviations
Spz Sporozoites
EEF Exoerythrocytic forms RBC Red blood cells Spp. Species
PV Parasitophorous vacuole
PVM Parasitophorous vacuole membrane PfHT Plasmodium falciparum hexose transporter PbHT Plasmodium berghei hexose transporter
h hours
mM Milimolar
ATP Adenosine triphosphate AMP Adenosine monophosphate
NADPH Nicotinamide adenine dinucleotide phosphate AMPK 5' AMP-activated protein kinase
PGC-1α Peroxisome proliferator-activated receptor gamma coactivator 1-alpha
PfK Phosphofructokinase-1
RD Dextran tetramethyl rhodamine AL Ad libitum
v
List of figures
Figure 1. Countries and areas at risk with malaria in 2010.. ... 3
Figure 2. Plasmodium life cycle.. ... 5
Figure 3. Plasmodium liver-stage infection.. ... 7
Figure 4. The glycolytic pathway. ... 9
Figure 5. Differential expression of genes related to carbohydrate metabolism and energy sensing upon infection with P. berghei sporozoites.. ... 21
Figure 6. Analysis of glucose effect on P. berghei liver-stage infection by determination of luciferase activity.. ... 22
Figure 7. Analysis of glucose effect on P. berghei sporozoite infectivity, cell traversal and invasion using flow cytometry.. ... 24
Figure 8. Analysis of glucose effect on Plasmodium development inside Huh7 cells using flow cytometry.. ... 26
Figure 9. Analysis of glucose effect on Plasmodium development inside Huh7 cells by microscopy.. ... 27
Figure 10. Glucose requirements throughout parasite development. ... 29
Figure 11. Effect of calorie restriction on mice body weight and blood glucose levels.. ... 30
Figure 12. Effect of calorie restriction on liver infection by Plasmodium.. ... 31
Figure 13. Effect of glucose administration on parasite development inside hepatocytes and on the percentage of infected cells. ... 33
vii
List of tables
Table 1 – Differences observed in sera from rat on ad libitum diet (AL) vs mice submitted to calorie restriction diet ………13 Table 2 - Differential expression of genes related to glucose metabolism and energy sensing in P. berghei infected vs. non-infected hepatoma cells 6h after infection………21 Table 3 - Differential expression of genes related to glucose metabolism and energy sensing in P. berghei infected vs. non-infected hepatoma cells 18h after infection……….21
ix
Abstract
Glucose is used as the main energy source for many organisms. It is known that during blood-stages the malaria parasite, Plasmodium, uses glycolysis to fulfill its energetic requirements. However, the role of glucose during the liver-stages of the parasite’s life cycle remains largely understudied. Here, we observed that genes related to carbohydrate and energetic metabolisms were modulated in RNA collected from mouse livers 6h and 18h after infection, suggesting that glucose may be relevant during the Plasmodium liver-stage of infection. To assess if glucose availability could affect infection, we infected hepatoma cells in the presence of different glucose concentrations. Our results demonstrate that invasion and cell traversal processes were not affected by alterations on glucose availability. However, Plasmodium development was significantly reduced in the absence of glucose and the survival of infected cells was enhanced by glucose. Our results indicate that glucose seems to be required to respond to energetic requirements necessary for parasite replication and survival inside hepatoma cells. To evaluate whether this effect could be observed in vivo, a calorie restriction (CR) model was used. CR diet is characterized by a decrease in the blood levels of glucose and in the liver glycogen storages. Mice submitted to this diet presented lower infection levels, caused by a decrease on parasite development when compared to mice fed on an ad libitum diet. We were able to rescue in vivo parasite development through oral administration of glucose to mice in CR diet. Overall, our data indicate that besides its role on blood-stage infection, glucose is also relevant during the liver-stage of Plasmodium infection.
xi
Resumo
A Malária é uma doença infecciosa responsável pela morte de cerca de 800 000 pessoas por ano. A doença é provocada pelo parasita protozoário do género Plasmodium. O ciclo de vida do parasita inicia-se com a picada de um mosquito Anopheles fêmea que introduz esporozoítos na pele do hospedeiro. Os esporozoítos chegam rapidamente ao fígado e migram para os hepatócitos, onde se inicia a fase hepática da infecção. A fase hepática é assintomática e obrigatória em qualquer infecção por malária. Uma vez no fígado, os parasitas atravessam vários hepatócitos antes de invadirem definitivamente um deles. Quando o processo de invasão fica completo, os esporozoítos multiplicam-se e originam milhares de merozoítos. Posteriormente, os merozoítos são libertados na corrente sanguínea onde invadem glóbulos vermelhos iniciando assim a fase sanguínea da infecção. Cada merozoíto multiplica-se, formando novos merozoítos capazes de invadir outros glóbulos vermelhos. Durante a formação de novos merozoitos, uma pequena população de parasita diferencia-se em gametócitos que podem ser ingeridos por um mosquito numa próxima picada. No mosquito, os gametócitos originam novos esporozoítos que migram para as suas glândulas salivares, assegurando assim a continuação do ciclo de vida do parasita. Estão descritas cinco espécies de parasitas que podem provocar malária. Entre elas, o Plasmodium falciparum é o mais mortal sendo responsável por cerca de 80% das mortes que ocorrem em humanos. Devido a questões técnicas e étnicas, a investigação na fase hepática da doença realiza-se utilizando a espécie de parasita, Plasmodium berghei, capaz de infectar roedores.
A glucose é usada como principal fonte de energia por muitos organismos. Os destinos mais significativos para a glucose são armazenamento (como glicogénio), oxidação pela glicólise para produzir ATP e intermediários metabólicos, oxidação pela via dos fosfatos de pentose para produzir Ribose-5-Fosfato utilizado na síntese de ácidos nucleicos e NADH para processos biossintéticos. A manutenção dos níveis de glucose é fundamental para a sobrevivência de vários organismos. Assim sendo quando uma célula necessita de glucose o fígado é capaz de produzir glucose através da glicogenólise e gluconeogénese. Tanto a glicólise como a gluconeogénese são reciprocamente reguladas e estão sujeitas a um controlo apertado.
Foi demonstrado que durante a fase sanguínea da infecção o parasita, Plasmodium, depende da glicólise para responder aos seus requisitos energéticos. De facto, todos os enzimas necessários para a glicólise estão codificados no genoma do parasita e são expressos durante a fase sanguínea. Uma vez que o parasita não possuí reservas energéticas, está
xii
dependente de um fluxo constante de glucose. A espécie P. falciparum, possuí um transportador de hexoses, capaz de transportar glucose do hospedeiro para o parasita. Inicialmente verificou-se que este transportador se encontrava expresso na fase sanguínea da infecção. Contudo, estudos recentes demonstraram que, além de ser expresso na fase sanguínea, a sua expressão também ocorre durante a fase hepática da infecção. Verificou-se ainda que a expressão deste transportador ocorria, tanto na fase hepática como sanguínea, numa infecção por P. berghei. Apesar de pressupostos de que a glucose deverá ter um papel relevante na fase hepática da infecção, o papel da glucose durante esta fase do ciclo de vida do parasita não está muito estudado. Assim sendo o trabalho apresentado e discutido na presente tese de mestrado tem como objectivo investigar o papel da glucose numa infecção por Plasmodium.
Uma vez que o parasita é capaz de alterar a expressão génica de células infectadas para promover a sua sobrevivência, analisou-se a expressão de genes relacionados com os metabolismos de carbono e energético em células infectadas. Verificou-se que, em células de hepatoma, a expressão de genes relacionados com a glicólise encontrava-se aumentada, enquanto que a expressão de genes relacionados com a gluconeogénese encontrava-se diminuída. De modo a verificar se estas alterações também se observavam in vivo procedeu-se à análise da expressão génica de RNA de fígado de ratinhos, recolhido 6h e 18h após infecção com P. berghei. Os resultados obtidos confirmaram as alterações observadas in vitro. Fígados de ratinho infectados apresentavam alterações nos genes que codificam para AMPK, PGC-1α e fosfofrutocinase comparativamente a ratinhos não infectados. Os resultados sugerem que, o parasita poderá estar a aumentar a disponibilidade de glucose dentro da célula hospedeira para as necessidades energéticas necessárias ao seu desenvolvimento. Assim sendo, a glucose poderá desempenhar um papel na fase hepática da infecção.
Com o objectivo de investigar o papel da glucose na infecção, células de hepatoma foram infectadas na presença de diferentes concentrações de glucose. A infecção foi analisada por técnicas de luminescência, citometria de fluxo e microscopia. Os resultados obtidos demonstraram que 2h após a infecção de células de hepatoma com esporozoítos, não se verificaram alterações nos processos de invasão e atravessamento de células pelo parasita. Contudo, o desenvolvimento do parasita encontrava-se significativamente diminuído na ausência de glucose, 48h após a incubação de células com esporozoítos. Verificou-se ainda que a glucose promovia a sobrevivência de células infectadas. Os resultados sugerem que a glucose deverá ser necessária para a replicação e sobrevivência do parasita em células de hepatoma.
xiii
Estes resultados foram confirmados num ensaio em que se analisou o efeito da adição e remoção de glucose ao longo de uma infecção in vitro por Plasmodium. Demonstrou-se que a ausência de glucose durante as primeiras horas de infecção não afectava significativamente o desenvolvimento do parasita. No entanto, após uma fase inicial, a remoção de glucose levava a uma diminuição acentuada na infecção. Os resultados indicam que a glucose deverá desempenhar um papel mais importante durante a fase replicativa do parasita. A fase replicativa ocorre após uma fase inicial de diferenciação dos esporozoítos em formas mais arredondadas.
Com o objectivo de investigar se a exposição de parasita a diferentes disponibilidades de glucose, antes da infecção, poderia afectar a sua infectividade, procedeu-se à pré-incubação de esporozoítos com diferentes concentrações de glucose. Seguidamente, células de hepatoma foram infectadas e a infecção foi analisada por citometria de fluxo. Os resultados obtidos indicaram que pré-incubação do parasita com diferentes concentrações de glucose não afectava a invasão e atravessamento de células de hepatoma.
Para verificar se este efeito também poderia ser observado in vivo, utilizou-se o modelo da restrição calórica (CR). A dieta de CR é caracterizada por uma diminuição nos níveis sanguíneos de glucose e dos níveis de reservas gluconeogénicas do fígado. Assim sendo, ratinhos submetidos a uma dieta CR e ratinhos alimentados ad libitum forma infectados com P.berghei e a infecção hepática foi analisada após extracção dos seus fígados por qRT-PCR e por microscopia. Os resultados obtidos demonstraram que ratinhos submetidos a esta dieta apresentavam níveis de infecção hepática mais baixos, provocados por uma diminuição no desenvolvimento do parasita, comparativamente a ratinhos alimentados ad libitum. A administração oral de glucose permitiu recuperar o desenvolvimento do parasita em ratinhos submetidos a uma dieta CR. Os dados obtidos com este trabalho demonstraram que, além de um papel na fase sanguínea do ciclo de vida do parasita, a glucose também tem um papel na fase hepática da infecção por Plasmodium.
Este trabalho permitiu-nos obter informações sobre o modo como o parasita usa a glucose da célula hospedeira para ser bem sucedido na infecção. O estudo dos requisitos nutricionais do parasita durante a fase hepática da doença é importante e pode ser usado para explorar novos alvos para drogas profiláticas e desenvolver intervenções adequadas para impedir a progressão do parasita para a fase sanguínea da infecção.
1
Index
Agradecimentos ... i
Abbreviations ... iii
List of figures ... v
List of tables ... vii
Abstract ... ix
Resumo ... xi
1 Introduction... 3
1.1Malaria incidence in the world ... 3
1.2 Malaria - the disease ... 4
1.3 Plasmodium liver-stage ... 6
1.4 Glucose metabolism ... 8
1.5 Glucose metabolism in the life cycle of Plasmodium ... 11
1.6 Calorie restriction ... 12
2 Objectives ... 14
3 Material and Methods... 15
3.1 Parasites lines and collection of sporozoites ... 15
3.2 Cell lines and in vitro infection ... 15
3.3 Experimental animals and in vivo infection ... 15
3.4 Caloric restriction model and glucose administration to mice ... 16
3.5 Analysis of in vitro infection by luminescence ... 16
3.6 Analysis of in vivo infection by flow cytometry ... 17
3.7 Analysis of in vivo infection and differential gene expression by qRT-PCR ... 17
3.8 Immunofluorescence and microscopy analysis ... 18
3.9 Statistical analysis... 19
4 Results ... 20
4.1 Differential expression pattern upon P. berghei liver-stage infection ... 20
4.2Effect of glucose on P. berghei in vitro liver-stage infection ... 22
4.3Effect of glucose on P. berghei traversal, invasion and development inside Huh7 cells ... 23
4.4 Glucose requirements throughout parasite development ... 27
4.5 Effect of calorie restriction on P. berghei in vitro liver-stage infection ... 30
5 Discussion and Future work ... 34
1
Introduction
1.1 Malaria incidence in the
Malaria has infected humans over the past 50 000 years and remains prevalent infectious diseases
were able to eradicate the disease, more than 40% of the world contracting malaria with the
cases and 800.000 deaths each
this disease and millions of them die with malaria every year
Malaria is geographically specific and is confined to the tropical and subtropical zones of the globe (Fig. 1). The high levels of malaria in poor countries are not
poverty but also of the fact that these areas present the climate and ecological conditions t support the development of the more efficient malaria mosquito vectors. Thus, malaria and poverty are unfortunately connected
Figure 1. Countries and areas at risk with malaria in 2010 transmission is concentrated in Central and South America, sub from Global_Malaria_ITHRiskMap, www.wh
3 Malaria incidence in the world
Malaria has infected humans over the past 50 000 years and remains
worldwide (Joy et al. 2003). Despite the fact that some countries were able to eradicate the disease, more than 40% of the world population lives in risk of
World Malaria Report estimating several hundred
aths each year. Children under the age of five are particular affected by this disease and millions of them die with malaria every year (World Malaria Report, 2010
y specific and is confined to the tropical and subtropical zones of The high levels of malaria in poor countries are not only a consequence of but also of the fact that these areas present the climate and ecological conditions t support the development of the more efficient malaria mosquito vectors. Thus, malaria and poverty are unfortunately connected (Gallup et al. 2001).
Countries and areas at risk with malaria in 2010. Malaria is geographically specific. The highest risk of transmission is concentrated in Central and South America, sub-Saharan Africa, Asia and pacific islands (adapted
Global_Malaria_ITHRiskMap, www.who.int).
one of the most Despite the fact that some countries population lives in risk of eport estimating several hundred million clinical year. Children under the age of five are particular affected by
World Malaria Report, 2010).
y specific and is confined to the tropical and subtropical zones of a consequence of but also of the fact that these areas present the climate and ecological conditions that support the development of the more efficient malaria mosquito vectors. Thus, malaria and
fic. The highest risk of Saharan Africa, Asia and pacific islands (adapted
4
Malaria is not only a public health concern but is also an economic and political problem. Countries affected by malaria are in general poor and, in addition, the disease significantly affects economic growth and development. The amount of investment necessary to fight the disease is huge and affects greatly the economy of developing countries which is by itself, weak. In the last years the international community carried out measures towards malaria elimination and continued progress has been made (Gallup et al. 2001; World Malaria Report. 2011).
The funds committed to malaria control have increased in the past decade, allowing the development of public health measures like the distribution of insecticide-treated mosquito nets, investments in the availability and rapidly of malaria diagnosis as well as a substantial increase on access to treatment. Even with these measures, malaria is far from being eradicated. In fact, in 2009 an increase in malaria cases in Rwanda, São Tome and Principe, and Zambia was reported. This failure in malaria control can be attributed to the small percentage of children using insecticide-treated mosquito nets, the increase in the resistance of the parasite to antimalarial drugs and of the mosquito vector to insecticides (Kappe et al. 2010; Meth et al. 2010; World Malaria Report. 2010).
This situation highlights the need for understanding the parasite biology and its complex life cycle to search for new intervention strategies and for a protective vaccine.
1.2 Malaria - the disease
Malaria is caused by a protozoan parasite from the phylum Apicomplexa and genus Plasmodium. The life cycle of Plasmodium requires two different hosts, a vertebrate host (from reptiles to humans) and an insect vector (female Anopheles mosquitoes). There are five different species of Plasmodium that can cause malaria in humans: Plasmodium falciparum, Plasmodium vivax, Plasmodium ovale, Plasmodium malariae and Plasmodium knowlesi. P. falciparum is by far the deadliest of the five and is responsible for most of the mortality and morbidity associated with malaria, 80% of infections worldwide, and 90% of malaria-related deaths (Cogswell. 1992; Van den Eede et al. 2009).
During their life cycle (Fig. 2), Plasmodium parasites assume different morphologies that can shift between invasive (sporozoites, ookinetes and merozoites), replicative (exoerythrocytic form, erythrocytic form and oocysts) and sexual forms (male and female
5
gametocytes). Malaria infection is initiated when Plasmodium sporozoites enter the mammalian host through the bite of an infected female Anopheles mosquito. Sporozoites rapidly reach the liver and migrate to hepatocytes. The liver-stage of the life cycle of Plasmodium is symptomatically silent and the first, obligatory step in any natural malaria infection. Once in the liver, parasites traverse several hepatocytes before invading a final one where they develop and multiply into thousands of merozoites. Two to sixteen days later, depending on the Plasmodium species, thousands of merozoites per invading sporozoite are released into the blood stream (Prudêncio et al. 2006). Some Plasmodium spp., such as P. vivax and P. ovale, can generate dormant forms in the liver called hypnozoites. Hypnozoites are a reservoir of parasite responsible for the relapses in the disease that can occur when a host is infected with one of these species (Cogswell. 1992, Price et al. 2007).
Figure 2. Plasmodium life cycle. When an infected female Anopheles mosquito bites a vertebrate host, sporozoites are deposited under the host skin. Once in the skin, sporozoites glide through dermis until they find a blood vessel and enters circulatory system that allows them to reach the liver. When sporozoites reach the liver they migrate through several hepatocytes before invading a final one where each sporozoite generates thousands of merozoites. Merozoites are released into the blood stream where they invade and multiply inside RBC. Some merozoites can differentiate into female and male gametocytes that can be taken up by the mosquito during a posterior blood meal. Within the mosquito midgut, gametocytes develop into gametes and fertilize each other forming ookinetes, a motile zygote. Ookinetes leave the mosquito midgut forming an oocyst in which sporozoites are formed. Once sporozoites are mature they migrate to salivary glands and are able to infect another host during a subsequent mosquito bite (Prudêncio et al. 2006).
6
Once in the blood, merozoites can invade circulating red blood cells (RBC) and embark upon the clinically important intra-erythrocytic cycle of asexual replication. Each merozoite can produce around 20 new merozoites that are able to invade other RBC. A small proportion of parasites inside RBC can differentiate into male and female gametocytes that can be taken by a feeding female mosquito. Inside the mosquito, parasite gametocytes undergo a complex sexual development and eventually form new infective sporozoites that can be introduced into a new human host at the next blood meal, thereby ensuring the continuation of the parasite life cycle (Doumbo et al. 2002; Haldar et al. 2007).
The clinical symptoms of malaria are attributed to the rupture of infected RBC, sequestration of infected RBC in the vasculature, release of parasite molecules and immunological and inflammatory response of the host (Doumbo et al. 2002; Clark et al. 2006). The symptoms consist of fever, headaches, nausea, chills, abdominal pain and mild diarrhea. Infections caused by P. falciparum are responsible for more severe symptoms that can lead to death if not early diagnosed and treated. Severe malaria symptoms consist of cerebral malaria, pulmonary edema, acute renal failure and severe anemia (Trampuz et al. 2003).
1.3 Plasmodium liver-stage
Malaria infection is initiated when Plasmodium sporozoites enter the mammalian host during a blood meal of an infected mosquito. An infected mosquito can deposit under the skin of the host a mean of 123 sporozoites (Medica and Sinnis 2005). A few minutes after injection sporozoites start leaving the skin, and they can have four different fates. Sporozoites can glide through dermis until they contact blood vessels and enter the circulatory system; they can reach a lymphatic vessel that drains them in a lymph node; they can remain in dermis; or they can be re-ingested into the mosquito midgut during a blood meal. However, invasion of blood vessels and the consequent liver invasion is what allows the infection to proceed (Krettli and Dantas 2000; Prudêncio et al. 2006).
Sporozoites must first recognize and arrest in the liver and then cross the sinusoidal cell layer which is composed of specialized, highly fenestrated endothelia and Kupffer cells, the resident macrophages of the liver (Fig. 3A). The process of recognition and arrest is possible due to specific interactions between parasite encoded surface proteins and host molecules (Frevert et al. 2005; Pradel et al. 2004).
7
Figure 3. Plasmodium liver-stage infection. A. Sporozoites reach liver sinusoids and recognize the liver due to the high levels of heparin sulphate proteoglycans HSPGs that are expressed in this organ. Parasite proteins interact with HSPGs and Plasmodium is arrested in the liver. Despite the fenestrations in endothelial cells sporozoites are unable to pass through them. Being so, sporozoites invade the host cell by invagination of the host plasma membrane to form a parasitophorous vacuole around the invading sporozoite or by membrane disruption. B. During the process of traversing, the sporozoite molecules activate signaling pathways necessary for development of the parasite inside hepatocytes and hepatocytes wounded by sporozoites release some molecules to make host cells more permissive to infection by Plasmodium. C. When EEF are mature the parasite returns to blood circulation. The release into the blood circulation thus not occur by the rupture of hepatocyte, instead merozoite-filled vesicles (merosomes) bud off from infected hepatocytes to liver sinusoids. An interesting point is the fact that merosomes membranes are hepatocyte derived so they cannot be recognize by immune system. In systemic circulation merosomes are disintegrated and merozoites are released (adapted from Prudêncio et al. 2006).
After being arrested, sporozoites cross the sinusoidal endothelium and migrate to hepatocytes. Hepatocyte traversal is an essential step for infection to proceed (Fig. 3B). In fact, there is some evidence that hepatocytes wounded by sporozoites release molecules that render neighboring hepatocytes more suitable for infection (Carrolo et al. 2003). Plasmodium can invade host cells either by invagination of the host plasma membrane to form a parasitophorous vacuole (PV) around the invading sporozoite or they can disrupt the plasma membrane of cells, that can be rapidly repaired, and traverse them. Infection requires a final invasion of the sporozoites into hepatocytes through the formation of a PV (Mota et al. 2001). Inside the liver cell sporozoites will develop into a round, non-motile exoerythrocytic (EEF) form and rapid nuclear replication occurs (Gomes-Santos et al. 2011). Thereby each invading sporozoite generate thousands (between 10 000 - 30 000) RBC invading forms of the parasite, merozoites. When the parasite’s exoerythrocytic forms are mature and merozoites are formed, merozoite-filled vesicles (merosomes) are released to the cytosol (Fig. 3C). In systemic circulation, merosomes are disintegrated and merozoites are released (Prudêncio et al. 2006).
Both invasion and development are critical for the establishment of a successful infection and much of the success relies on the ability of the parasite to subvert its host cells. When sporozoites invade host cells they trigger a coordinated and sequential set of biological events. In an initial stage of infection, cells respond to the stress caused by the parasite but the
8
parasite is able to engage cell resources to fulfill its molecular needs for replication and maintain cell viability throughout infection (Albuquerque et al. 2009). In fact, the parasite is able to recruit host microtubules and rearrange the host cell cytoskeleton (Carrolo et al. 2003). Both recruitment and rearrangement are thought to allow the transport of host organelles to the parasite, the export of molecules through PV to the hepatocyte cytoplasm and nucleus to modulate the cell gene expression and promote parasite survival (Carrolo et al. 2003).
It is known that during the liver-stage the parasite requires nutrients from the host to respond to the needs required for an intense merozoite replication. For example, the parasite is able to recruit host fatty acids for his extensive membrane biogenesis required in merozoite formation hepatic development and replication (Ishino et al. 2005). Carbohydrate metabolism may also play an important role in the response to parasite needs. During blood-stages parasites relies on glycolysis for its energy requirements and use host glucose to generate ATP (Olszewski and Llinás 2011). During liver-stage, those requirements are poorly understood and a better understanding of the parasite nutritional and energetic requirements is important as it can provide new targets to fight the disease.
The study of liver-stage in humans presents several technical and ethical limitations such as, the silent character of liver infection and the difficulty in obtaining human liver samples. Thus, a significant amount of malaria research, in particular on pre-erythrocytic stages, has made use of the Plasmodium spp. that infects rodents, namely Plasmodium berghei and Plasmodium yoelli (Prudêncio et al. 2011; Langhorne et al. 2011).
1.4 Glucose metabolism
Glucose is used as the main energy source for most living organisms but it is also a remarkably versatile precursor capable of supplying a vast array of metabolic intermediates for biosynthetic pathways. The most significant fates for glucose are storage (as polysaccharide or sucrose), oxidation via glycolysis to yield ATP and metabolic intermediates and oxidation via the pentose phosphate pathway to yield ribose 5-phosphate for nucleic acid synthesis and NADPH for reductive biosynthetic processes (Cox et al. 2005).
Glucose can be metabolized differently depending on the cells. The liver converts glucose into pyruvate which is used as a source of acetyl Co-A, an intermediate of the tricarboxylic acid cycle (TCA) (Devlin. 1998). In a process called glycolysis (Fig. 4), cells produce
9
ATP through the aerobic degradation of glucose. Glycolysis comprises three major stages: a priming stage, a splitting stage and an oxidoreduction-phosphorylation stage. The priming stage involves ATP consumption in order to phosphorylate glucose and “trap” it inside the cell cytosol. In this step glucose is converted to fructose 1,6 biphosphate. Stage two splits fructose 1,6-biphosphate into two molecules of glyceraldehyde 3-phosphate. Finally, in the oxidoreduction-phosphorylation stage, two molecules of glyceraldehyde 3-phosphate are converted into two molecules of lactate and four ATP molecules from one molecule of glucose. The NADH formed during glycolysis needs to be recycled in NAD+, which is required as an electron acceptor. The NAD+ production is achieved through mitochondrial respiration. The process of mitochondrial respiration allows the transference of electrons from NADH for oxygen (O2) (Devlin et al. 1998; Lemaigre et al. 1994).
Figure 4. The glycolytic pathway. For each molecule of glucose two molecules of Glyceraldehyde are formed. Being so, for each molecule of glucose two ATP are consumed, 4 ATP are produced and 2 molecules of pyruvate are formed. This reaction gives a net of two ATP per molecule of glucose converted to pyruvate (adapted from watertreatmentsss.com/category/glycolysis-diagram/)
In the liver, glucose is also stored as glycogen. In order to meet the glucose needs of other cells, the liver is also capable of producing glucose through glycogenolysis (the conversion of glycogen into glucose monomers) and through gluconeogenesis, the conversion of pyruvate and related three-carbon precursors into glucose. Many of the gluconeogenesis reactions are catalyzed by the same enzymes used in glycolysis. However, there are three
10
irreversible steps which are catalyzed by enzymes exclusive for gluconeogenesis. Those steps are: the conversion of pyruvate to phosphoenolpyruvate, the dephosphorylation of fructose 1,6-biphosphate, and dephosphorylation of glucose 6-phosphate (Devlin et al. 1998; Cox et al. 2005).
In RBC, glucose is metabolized mainly by glycolysis and generates lactate. As a result of not containing mitochondria, RBC cannot use the oxygen they transport to support aerobic degradation of pyruvate and NADH produced in glycolysis. In these cells, NAD+ is regenerated from NADH by the reduction of pyruvate to lactate. In RBC, glucose is used to provide NADH that keeps glutathione in the reduced state, thus protecting the cell from damages and death.
Maintenance of plasma glucose homeostasis is vital for the survival of mammalian organisms. Thus, glycolysis and gluconeogenesis are reciprocally regulated and are under a tight control. The regulation of the glucose levels can occur due to the action of hormones. The hormonal regulation of glucose levels is fast, occurring within seconds of exposure to insulin or glucagon. An increase in insulin causes cells, such as liver cells, to take up glucose from the blood and store it as glycogen. On other hand, glucagon has an opposite effect, stimulating glycogenolysis and gluconeogenesis in order to produce glucose and respond to the organism nutritional requirements (Devlin et al. 1998; Cox et al. 2005 Lin and Accili 2011).
The regulation of flux through the glycolytic pathway is also determined by the activity of several enzymes. Hexokinase, 6-phosphofructo-1-kinase and pyruvate kinase were identified as the main regulators of glycolysis. Evidences suggest that 6-phosphofructo-1-kinase is a very important regulatory step because it catalyses the first committed step of the glycolytic pathway. 6-phosphofructo-1-kinase is allosterically regulated. Citrate, ATP and hydrogen ions are the most important negative regulators, while AMP and 2,6-biphosphate are the most important positive effectors (Devlin. 1998; Lemaigre et al. 1994).
In fact, AMP is considered as an important sensor of the cell’s energy status, because a small decrease in ATP leads to a greater percentage increase in AMP, which then triggers glycolysis. AMP is also the substrate of the AMP-activated protein kinase (AMPK), which was identified as one of the main players controlling hepatic metabolism. AMPK acts as a “metabolic master switch” that can sense fluctuations in nutritional and energy balance, such as changes in AMP levels, making compensatory adjustments to adapt metabolism to nutritional and energetic environment (Ljubicic et al. 2011, Viollet et al. 2006). AMPK is a phylogenetically conserved serine/threonine protein kinase and exists as a heterotrimeric complex consisting of a catalytic subunit α and two regulatory subunits β and γ (Hardie. 2004).
11
Evidence suggests that the allosteric AMP-binding site might involve the γ and α subunits. When AMP levels in the cell go down AMPK is activated. Increased concentrations of AMP cause a conformational change on the γ subunit of AMPK to expose the active site (Thr-172) on the α subunit (Corton et al. 1995; Ofir et al. 2008). Once activated, AMPK can have short-term effects such as phosphorylation of regulatory proteins or long term effects by affecting gene expression. AMPK has been implicated in the hepatic control of glucose, as AMPK actions appear to prevent ATP depletion by promoting glucose uptake. Evidences suggest that AMPK promote liver glucose uptake by influencing the gene expression of the key gluconeogenic enzymes and induction of glycolysis through an increase in ATP production (Viollet et al. 2006; Towler et al. 2007).
Another important molecule in the regulation of glucose and energy metabolism is peroxisome proliferator-activated receptor (PPAR)-gamma coactivator 1alpha (PGC-1α) a transcriptional coactivator that also acts as a “metabolic switch”. PGC-1α regulates important metabolic processes including, mitochondrial biogenesis, adaptive thermogenesis, respiration, insulin secretion and gluconeogenesis. PGC-1α is highly responsive to environmental cues and is able to respond to nutritional stimuli. Under normal conditions, PGC-1α is expressed at very low levels in the liver. However, fasting promotes an increase of PGC-1α expression, which stimulates liver gluconeogenesis (Liang and Ward 2006; Liu and Lin 2011).
1.5 Glucose metabolism in the life cycle of Plasmodium
During the blood-stage of infection, Plasmodium uses glycolysis to generate ATP and D-glucose is the parasite’s main energy source (Homewood. 1977). Previous studies showed that all the enzymes required for glycolysis are encoded in the parasite genome and are expressed during blood-stages (Gardner et al. 2002; Bozdech et al. 2003). Plasmodium is a voracious glucose consumer. Indeed, infected RBC showed 100-fold enhanced glucose utilization relative to non-infected RBC (Woodrow et al. 1999; Olszewski et al. 2011).
Plasmodium does not possess intracellular energy stores and is dependent on a constant supply of glucose. A P. falciparum hexose transporter (PfHT) is a facilitative glucose transporter that appears to be essential for the parasite erythrocytic development. Recent evidence showed the existence of a rodent malaria parasite orthologue to the PfHT (Slavic et al. 2010). Like in the blood-stages of infection, the expression of P. berghei hexose transporter
12
during liver-stage development was confirmed by genetic studies and it points to an important role of glucose also in the liver-stage (Slavic et al. 2011).
Interestingly, other evidence suggests that parasitized erythrocytes secrete molecules that down-regulate glucose utilization of non-infected cells (Mehta et al. 2006). A possible explanation is that Plasmodium modulates the host glycolytic enzyme activities, in order to increase the amount of glucose available to its own development.
1.6 Calorie restriction
Calorie restriction (CR) is a dietary regimen that restricts calorie intake without malnutrition. It was shown that CR improves age-related health and slows the aging process in yeast, flies, worms, fish, rodents, and rhesus monkeys (Fontana et al. 2010). Despite the benefits of CR the mechanisms behind them are unknown. There is evidence that CR is able to reprogram energy metabolism through the activation of master regulators that positively affect tissue-specific effectors of longevity pathways. Master regulators may include the transcriptional co-activator PGC-1α and members of the nuclear receptor family (Anderson et al. 2009). White adipose tissue (WAT) is metabolically active, a source of hormones and inflammatory factors that influence metabolic homeostasis and systemic inflammation. An unbalance on metabolic homeostasis and inflammation is a characteristic of the aging process (Guarente 2005). It was shown that CR causes a significant reduction in the expression of genes involved in inflammation in WAT and increases the genes involved in the glycolytic pathway, the lipolytic pathway, amino acid metabolism, and mitochondrial metabolism (Higami et al. 2004; Higami et al. 2006) .
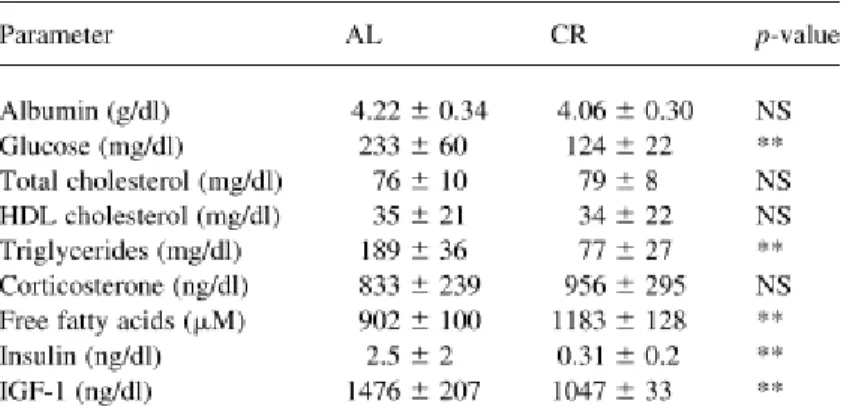
Another explanation for the benefits of CR is related to nutrient sensing. In fact, both CR and reduced activity of nutrient sensing pathways are associated with increased life span. This can be explained because different nutrients can activate different pathways directly or indirectly (Fontana et al. 2010). In mice, glucose can increase the level of IGF-1 (Insulin-like growth factor 1), which, in turn, activates pro-aging pathways in various mammalian cells. Glucose, insulin and IGF-1 are markedly decreased in rodents under a CR diet (Table 1) (de Cabo et al. 2003; Anderson et al. 2009).
It can be assumed that an organism submitted to CR will have less fat and will require less energy to support its weight, thus will not require as much glucose in the bloodstream. This reduction can explain some benefits of CR, since less blood glucose leads to less glycation
13
(that impairs the functioning of biomolecules such as proteins and lipids) and less fat causes a decrease on the atherosclerosis risk (Fontana et al. 2004). The benefits of CR have been accepted and generalized to a range of animals. Researchers are investigating the possibility of parallel physiological links in humans (Holloszy and Fontana 2007).
Table 1. Differences observed in sera from rat on ad libitum diet (AL) vs mice submitted to calorie restriction diet (adapted from de Cabo et al. 2003).
14
2 Objectives
Glucose is the main molecule used by parasites during blood-stages for their energy requirements (Homewood 1977; Mehta et al. 2006; Olszewski and Llinás 2011) . However little is known about the role of glucose during liver-stage of infection.
Therefore, the aims of this project are:
• To analyze differential gene expression in Plasmodium-infected cells.
• To investigate the effect of glucose changes on liver-stage infection by Plasmodium. • To elucidate whether glucose influences parasite invasion and development inside
hepatoma cells.
• To investigate the effect of incubation of sporozoites with different glucose concentrations before infection on their infectivity.
15
3 Material and Methods
3.1 Parasites lines and collection of sporozoites
In the present study, transgenic parasite lines of P. berghei ANKA that constitutively express both GFP and luciferase (676m1cl1) or GFP alone (259cL2) were used. Sporozoites were obtained by disruption of the salivary glands of freshly dissected infected female Anopheles Stephensi mosquitoes bred at the insectary of the Instituto de Medicina Molecular. Salivary glands were collected in 1640 RPMI (Gibco/Invitrogen) medium.
For the pre-incubation experiments, sporozoites were collected in 1640 RPMI medium without glucose and then incubated in medium supplemented with increasing concentrations (0, 10 and 50 mM) of D-glucose (Sigma) for 1h at 4°C.
3.2 Cell lines and in vitro infection
Huh7 cells, a human hepatoma cell line, were cultured at 37°C in a 5% CO2 environment. The cells were regularly maintained in 1640 RPMI medium supplemented with 10% (v/v) fetal bovine serum (FBS) (Gibco/Invitrogen), 0.1 mM non essential amino acids (Gibco/Invitrogen), 50 µg/mL penicillin/streptomycin (Gibco/Invitrogen), 2 mM glutamine (Gibco/Invitrogen), 10 mM HEPES (Gibco/Invitrogen), pH 7. To assess the role of glucose, the medium was changed 1h prior to infection to 1640 RPMI without glucose, supplemented with 10% FBS, 0.1 mM non essential amino acids, 50 µg/mL penicillin/streptomycin, 2 mM glutamine, 10 mM HEPES, and D-glucose concentrations below and above the normal value present on 1640 RPMI used for cell maintenance, 10 mM (0, 1, 30 or 50 mM).
To measure the parasite infection in vitro cells were seeded on the day prior to infection. On the next day, cells were infected by the addition of a determinate number of sporozoites followed by centrifugation at 3000 rpm for 5 min at 37°C.
3.3 Experimental animals and in vivo infection
Male, 6/7 weeks old C57BL/6 mice weighing 18-28 g were purchased from Charles River and housed in the specific pathogen free facilities of the Instituto de Medicina Molecular.
16
Animals were housed three to five per cage and raised in a room with controlled temperature (20-22°C), humidity (50-60%) and lighting (14h light and 10h dark). All experimental procedures using animals were performed according to the Portuguese and International laws and recommendations for good practices and animal welfare.
To analyze parasite liver-stage infection, C57BL/6 mice were infected intravenously (i.v.) with 5x10⁴ sporozoites from P. berghei ANKA parasites expressing GFP or GFP-luciferase.
3.4 Caloric restriction model and glucose administration to mice
After a 3-day acclimatization period, C57BL/6 mice were assigned to receive either an ad libitum diet (AL group) or a 40% reduction calorie diet (CR group). Each experimental group contained mice with approximately the same weight to ensure that animals ate approximately the same. The food consumption of AL group was determined by weighing the food available in the cage daily. The CR group was submitted to starvation for 48h and after that period food pellets were provided daily between 2 and 4 p.m. Food pellets were weighed to obtain a reduction of 40% in caloric intake. As previously described (Toth and Gardiner 2000), this moderate caloric restriction resulted in a 20% reduction of in the initial body weight. Water was freely available for both experimental groups. For oral administration of glucose, 20% (w/v) D-glucose was dissolved in the drinking water. Blood glucose measurements were performed using a glucometer (Jonhson & Jonhson One Touch UltraSmart Blood Glucose Monitoring System).
3.5 Analysis of in vitro infection by luminescence
To measure parasite infection in vitro by luminescence, Huh7 cells (1.2 x10⁴) were seeded in a 96-well plate in the day prior to infection. On the next day, cells were infected by the addition of P. berghei sporozoites (1x10⁴), followed by centrifugation as described above. At different time points after sporozoites addition, cell viability was analyzed by an AlamarBlue assay (Invitrogen). The fluorescence of each sample was measured using a multiplate reader (Tecan, CH) 2h after the addition of 100 µL of AlamarBlue reagent to each well. To analyze infection cells were washed with PBS and lysed with a lysis buffer (Biotium), then 50 µL of Luciferase Assay Substrate (Promega Luciferase Assay System KitH) was added to 30 µL of
17
lysed samples and luminescence of each well was measured in a multiplate reader, as described in (Ploemen et al. 2009). Measurements of luciferase activity are expressed as relative luminescence units (RLU).
3.6 Analysis of in vivo infection by flow cytometry
To measure the parasite invasion and development in vitro by flow cytometry, Huh7 cells (8x10⁴) were seeded in a 24-well plate and were infected by the addition of P. berghei sporozoites (3x10⁴) as described above. To assess membrane disruption, 0.5mg/mL dextran tetramethyl rhodamine 10 000 MW, lysine fixable (fluoro-ruby) (Molecular Probes/Invitrogen) was added to cells prior to sporozoites addition. Cells used as a positive control for membrane disruption were mechanically disrupted by scratching a pipette tip in the well where cells were seeded, in the presence of 0.5 mg/mL of Dextran (Prudêncio et al., 2008).
As described in (Prudêncio et al., 2008), cell samples were washed with 400 µL of PBS, incubated with 100 µL of Trypsin at 37°C for 5 min and collected in 400 µL of 10% FBS (v/v) in PBS at selected time points after sporozoites addition. The samples were then centrifuged at 1200 rpm for 5 minutes at room temperature to remove Trypsin and were resuspend in 200 µL of 2% FBS (v/v) in PBS. Finally, the cells were analyzed in a Becton Dickinson FACScalibur or in a LSR Fortessa I with the appropriate settings for the used fluorophores. Data analysis was performed using the FlowJo software (version 6.3.4).
3.7 Analysis of in vivo infection and differential gene expression by qRT-PCR
To determine liver parasite load, livers were collected 40-44h after infection, one of the lobes was kept for microscopy analysis (see below) and the remaining lobes were homogenized in denaturing solution (4 M guanidine thiocyanate; 25 mM sodium citrate pH 7, 0.5% sarkosyl in DEPC-treated water) supplemented with 0.7% (v/v) β-mercaptoethanol for RNA extraction. RNA was extracted with Qiagen’s MicroRNeasy kit following the manufacturer’s instructions. RNA quality and concentration was determined using a NanoDrop ND-100 spectrophotometer (NanoDrop Technologies). After extraction, 1 µg of total RNA was converted to single-stranded cDNA using the transcription first-strand cDNA synthesis kit (Roche) with random hexamer primers according to the manufacturer’s instructions.
18
Real time PCR analysis was performed with DinnamoTM SYBR Green PCR Master Mix (Finnzymes) on an ABI Prism 7500 system (Applied Biosystems). Amplification reactions were carried out in duplicates, in a total reaction volume of 20 µL consisting of 10 µL of SYBR green PCR master mix, 7.2 µL of water and 0.4 µL of the forward and reverse primers (0.2 pmol/µL). 18S rRNA-specific primer sequences were 5’-AAGCATTAAATAAAGCGAATACATCCTTAC-3’ and 5’-GGAGATTGGTTTTGACGTTTATGTG-3’ for the parasite, and 5’-TTTGCTGACCTGCTGGATTAC-3’ and 5’-CAAGACATTCTTTCCAGTTAAAGTTG-3’ for Hypoxanthine Guanine Phosphoribosyl Transferase (hprt) mouse housekeeping gene.
For gene differential expression analysis, RNA was extracted from livers collected 6h and 18h after i.v. injection of infected and non-infected salivary glands. The procedure for RNA extraction, cDNA synthesis and qRT-PCR was performed as described above. Primers specific for Prkaa2, Prkag2, Pfkl and Ppargc1a were designed with bioinformatic tools. The primer sequences were as follows: 5´-CCCAGAATCAAAGAGACATAGACCC-3´ and TCACAGAGAACCCGAGGAACAG-3´ for Prkaa2; AAAGAATCCTCAAGTTCCTCCAGC-3´and TTTTCCTGACTCATCCACCACAG-3´ for Prkag2; TGGTGATTGGTGGCTTTGAGG-3´ and 5´-TTGTTGCTGATGGTGGCTGGGATG-3´for Pfkl; 5´-AACAGAACGAACAAGGGCGAC-3´ and 5´- TCAGCAGTGTCATTTTAGGGTGG-3´ for Ppargc1a. As above, the hprt was used as the housekeeping gene.
We first determined the efficiency of the target genes and because it was approximately equal to the efficiency of the housekeeping gene, we were able to use the delta-delta Ct method to analyze the qRT-PCR results (Pfaffl 2001). This method compares the expression of the gene of interest with a calibrator. For the infection analysis, the calibrator was one of the AL diet samples. For the gene expression analysis, the calibrator was one of the non-infected salivary glands samples. The delta Ct was calculated as follows: delta Ct = Ct target gene - Ct housekeeping gene. We next applied the formula 2^-(delta Ct sample - delta Ct calibrator).
3.8 Immunofluorescence and microscopy analysis
Huh7 cells were seeded and infected on coverslips in a 24-well plate. At selected time points after infection, cell medium was removed and cells were fixed with 4% (w/v) paraformaldehyde (PFA) for 10 minutes. Permeabilization was done with 0.1% (v/v) Triton
X-19
100 for 10 minutes and blocking with 1% (w/v) bovine serum albumin (BSA) in PBS for 30 minutes. Cells were then incubated in the same solution containing the mouse primary antibody 2E6 (1:100) for 1h. After the incubation with primary antibody, cells were washed with PBS and a new incubation was performed with goat anti-mouse secondary antibody Alexa Fluor 488 (1:400) for 1h. To visualize the cell nuclei incubation with 4', 6-diamidino-2-phenylindole (DAPI) (1:1000) was performed for 10 minutes. All incubations and washing procedures were performed at room temperature. After mounting with Fluoromount (Southernbiotech), the coverslips were analyzed using a widefield fluorescence microscope (Zeiss Axiovert 200M). In each coverslip 30 fields were imaged. For each field, the number of EEF was normalized to the cell confluence (number of nuclei) to determine the % of infected cells. EEF areas were grouped in 4 classes: smaller than 30 µm2, between 30 and 80 µm2, 80 and 130 µm2 and larger than 130 µm2.
Livers were collected 40-44h after infection and one of the lobes was fixed with 4% (w/v) PFA at room temperature for 1h. Samples were washed with PBS and sliced sagitudinally into 50µm sections using a vibratome (VT1000S, Leica). Sagitudinal sections were permeabilized and blocked overnight with 0.5% (v/v) Triton X-100, 1% (w/v) BSA in PBS at 4°C. Sections were then incubated 12h at 4°C in the same solution containing chicken anti-exp1 primary antibody (1:500). After incubation period, the samples were washed with PBS and incubated overnight at 4°C in the permeabilizing/blocking solution containing goat anti chicken Alexa Fluor 594 (1:300), rabbit anti-GFP IgG Alexa Fluor 488 conjugate antibody (1:400) and Hoechst (1:500). After mounting sections on a slide, the size and number of the EEF were determined using the widefield fluorescence microscope (Zeiss Axiovert 200M). The numbers of EEF were normalized to the total liver slice area, which was determined using a scanner. Liver images shown on Figure 12 were obtained using a confocal point-scanning microscope (Zeiss LSM 510 META).
3.9 Statistical analysis
Differences between mean values of two groups were analyzed using unpaired student t test. P values<0.05 were considered significant, P values<0.001 were considered highly significant.
20
4 Results
4.1 Differential expression pattern upon P. berghei liver-stage infection
Previous studies have described that, during liver infection, Plasmodium appears to modulate the transcriptional profile of hepatoma cells to promote its own survival (Albuquerque et al. 2009). As such, genes engaged in host cell metabolic processes and management of host cell viability are differentially expressed upon infection. Among the altered metabolic processes, we became particularly interested in the changes on the carbohydrate metabolism and energy sensing that were detected 6h and 18h after infection. These time points were selected to identify the processes that occur during the initial stage of infection (6h), when sporozoites are still differentiating into rounder forms, and 18h after infection when the multiplication of the parasite starts (Meis 1985). A more detailed analysis of the available microarray data revealed that, several pathways appear to be modulated in order to increase the levels of glucose in the cell. In fact, several genes linked to glycolysis are down-regulated while several genes involved in gluconeogenesis are up-regulated (Tables 2 and 3).
To determine if these changes could also be observed in vivo, we analyzed by qRT-PCR the relative expression of Prkaa2 (AMPKα), Prkag2 (AMPKγ), Ppargc1a (PGC-1α) and PfK on liver extracts from C57BL/6 mice sacrificed 6h and 18h after infection with P. berghei. As controls we used mice injected with salivary gland extracts from non-infected mosquitoes. Consistent with the in vitro studies, we observed that glycolysis seems to be down-regulated, as phosphofructokinase (PfK) expression is decreased 18h after infection (p<0.05; Fig. 5). We also confirmed that energy sensing related genes are also affected by infection, as suggested by the increase observed in AMPKα and AMPKγ transcript levels (p<0.05; Fig. 5). However, in this case, the greatest changes in vivo are detected 6h after infection, whereas in vitro they were observed 18h after infection. Despite some discrepancies on the timing, taken together, in vitro and in vivo data suggest that the parasite modulates the host cell transcriptional profile in order to increase glucose availability inside the cell. Thus, as previously described for the blood-stages of Plasmodium infection (Mehta et al. 2006), glucose may also have an important role during liver-stage infection.
21
Table 2. Differential expression of genes related to glucose metabolism and energy sensing in P. berghei infected vs. non-infected hepatoma cells 6h after infection. Analysis of the transcriptional profile obtained by Albuquerque et al. (2009). Alterations on pathways were determined using the KEGG pathway tools (http://www.genome.jp/kegg/pathway.html).
Pathway Gene Protein Fold Change
Pentose phosphate pathway Pfk phosphofructokinase -0.74
G6pd2 glucose-6-phosphate dehydrogenase 2 -0.67
Glycolysis/gluconeogenesis Pfk phosphofructokinase -0.74
Pyruvate metabolism Acss2 acyl-CoA synthetase short-chain family member 2 -1
Table 3. Differential expression of genes related to glucose metabolism and energy sensing in P. berghei infected vs. non-infected hepatoma cells 18h after infection. Analysis of the transcriptional profile as described in Table 2.
Pathway Gene Protein Fold Change
Ppargc1a
peroxisome proliferative activated receptor, gamma,
coactivator 1 alpha 0.83
Insulin signaling pathway Prkaa2 protein kinase, AMP-activated, alpha 2 catalytic subunit 0.64 Prkag2 protein kinase, AMP-activated, gamma 2 non-catalytic
subunit 0.82
Pfk phosphofructokinase -0.73
Pentose phosphate pathway Aldoc aldolase C, fructose-bisphosphate -2.8
Pgm2 phosphoglucomutase 2 -1.16
Glycolysis/gluconeogenesis Aldoc aldolase C, fructose-bisphosphate -2.8
Pfk phosphofructokinase -0.73
Figure 5. Differential expression of genes related to carbohydrate metabolism and energy sensing upon infection with P. berghei sporozoites. Analysis of the transcriptional profile of P. berghei infected mice. RNA was extracted from mice livers collected at 6h (black) and 18h (grey) after infection (a.i.) and further analyzed by qRT-PCR using specific primers for AMPKα, PGC-1α, AMPKg and PfK. The graph shows the differential gene expression of the P. berghei infected mice relative to mice injected with non-infected salivary glands. The amount of RNA for the target genes was normalized with hprt gene expression. Error bars represent standard deviation (3 mice per group).
22
4.2 Effect of glucose on P. berghei in vitro liver-stage infection
In order to further understand how Plasmodium manipulates the host cell to fulfil its own energetic requirements, we sought to analyse whether differences in the amount of glucose available to the parasite could affect the infection of Huh7cells, a human hepatoma cell line. The cells were infected with luciferase-expressing P. berghei parasites and different concentrations of glucose were added to the cell medium 1h prior to sporozoite addition. Luminescence intensity (luciferase activity) and cell viability were measured 48h after infection. As shown in Figure 6, an increase in glucose can be correlated with a significant increase in luciferase activity and consequently on infection (p<0.05). In contrast, the absence of glucose dramatically reduced parasite load (p<0.01), indicating that Plasmodium requires glucose to succeed in infection. Cell viability was not affected by the presence of an excess of glucose in the medium, while the absence of glucose caused a non-significant decrease in cell viability (p=0.23).
Figure 6. Analysis of glucose effect on P. berghei liver-stage infection by determination of luciferase activity. The effect of glucose in liver-stage infection was assessed by supplementing the cell culture medium 1h prior to infection with different glucose concentrations (0, 10, 30 and 50 mM). Huh7 cells were then infected with luciferase-expressing sporozoites, and infection was assessed 48h after infection by measuring luciferase activity. Cell viability was also measured using the AlamarBlue assay. Luciferase activity values are presented in relative light unit (RLU) and cell viability values in fluorescence intensity values. Data in this figure are representative of 4 independent experiments. Error bars represent standard deviation.
23
4.3 Effect of glucose on P. berghei traversal, invasion and development inside Huh7 cells The results described above established that glucose has an effect on in vitro Plasmodium infection. We next investigated whether the observed enhancement in infection would be caused by an increase on invasion of Huh7 cells by P. berghei sporozoites, or by an increase in parasite development inside cells. First, however, we evaluated the ability of parasites to traverse cells in the presence of different glucose concentrations using a dextran-based assay. During invasion, the parasite disrupts the plasma membrane of the host cell, which then quickly reseals. If present in the medium upon sporozoite addition, dextran enters cells and is trapped inside them (Mota et al. 2001; Prudêncio et al. 2008). Cells were analyzed by flow cytometry 2h after sporozoite addition, when the invasion process is virtually completed (Prudêncio et al. 2008). Non-infected cells, also incubated with dextran during the same period, were used as negative controls, and cells mechanically disrupted with a syringe in the presence of dextran were used as positive controls (Fig. 7A). As shown in Figure 7B, the percentage of dextran-positive cells is similar for all the conditions analyzed, suggesting that the presence of different glucose concentrations in the culture medium does not affect the traversal process. This experiment also shows that the invasion process is not affected by glucose, as the percentage of infected cells (GFP+ cells) is similar for the three concentrations of glucose analyzed (Fig. 7B).
It is known that sporozoites are sensitive to environmental stimuli, which then affects parasite developmental progression (Kaiser et al. 2003; Siau et al. 2008). To analyze if glucose could affect the sporozoite infectivity, GFP-expressing sporozoites were incubated with different glucose concentrations before infection. When pre-incubated sporozoites were added to cells in medium containing 1 mM glucose, carry-over of glucose from the incubation medium occurred. The amount of glucose added together with sporozoites pre-incubated with 10 and 50 mM glucose was calculated to be 3 and 14 mM, respectively. As control, we used cells with the correspondent glucose supplementation in their medium. In agreement with the results above, the presence of different glucose concentrations in the medium does not seem to affect the process of invasion and cell traversal except for the case where the final glucose concentration is 1mM. However, the decrease observed in dextran-positive GFP-negative cells (p<0.01) is probably caused by the decline observed in the number of total cells (Fig. 7C). Regarding the sporozoite pre-incubation with different glucose concentrations, we did not observe any differences in sporozoite infectivity and cell traversal (Fig. 7C).
24
Figure 7. Analysis of glucose effect on P. berghei sporozoite infectivity, cell traversal and invasion using flow cytometry. Cells were incubated with dextran and crescent glucose concentrations before infection with GFP-expressing P. berghei sporozoites. A. Dot plot representing the different populations of cells obtained 2h after infection. When a cell is traversed by sporozoites, the red-fluorescent dextran present in the medium is trapped in the cytosol and the cell becomes dextran-positive (RD+). The population of GFP-positive cells (GFP+) corresponds to cells containing a parasite at the time of measurement. The population of GFP+ cells can be either dextran-positive or dextran-negative. If the parasite is passing through a cell or invading a cell previously traversed by another parasite that cell is dextran-positive and GFP-positive (RD+ GFP+). The population of cells which have been clearly invaded are dextran-negative and GFP-positive (RD- GFP+). The population of cells dextran-negative and GFP-negative (RD- GFP-) corresponds to cells that do not contain a parasite inside and were not traversed by one (Prudêncio et al. 2008). B. Cell traversal and invasion by sporozoites 2h after infection. C. Sporozoites were pre-incubated with 1, 10 and 50 mM of glucose for 1h before infection. Data in figure B is representative of 3 independent experiments. Data in figure C is representative of 2 independent experiments. Error bars represent standard deviation.
25
To test if glucose could influence in vitro parasite development, Huh7 cells were infected with GFP-expressing P. berghei sporozoites 1h after incubation of cells with different glucose concentrations (0, 10 and 50 mM) and were analyzed 48h later by flow cytometry (Fig. 8A) and microscopy. Since there is a correlation between the number of parasite copies and GFP intensity, parasite development can be determined by the intensity of fluorescence of GFP+ cells (Fig. 8A) (Prudêncio et al. 2008). As shown in Figure 8B, parasite development is impaired in the absence of glucose (p<0.001). In contrast, a further increase in glucose concentration, relative to the control 10mM, does not seem to significantly increase parasite development (p=0.4). Despite the fact that the percentage of infected cells is not affected 2h after sporozoite addition, we observed that 48h after infection that percentage is increased for higher glucose concentrations (Fig. 8C) (p<0.05). A possible explanation for this observation is that glucose may promote the survival of infected cells.
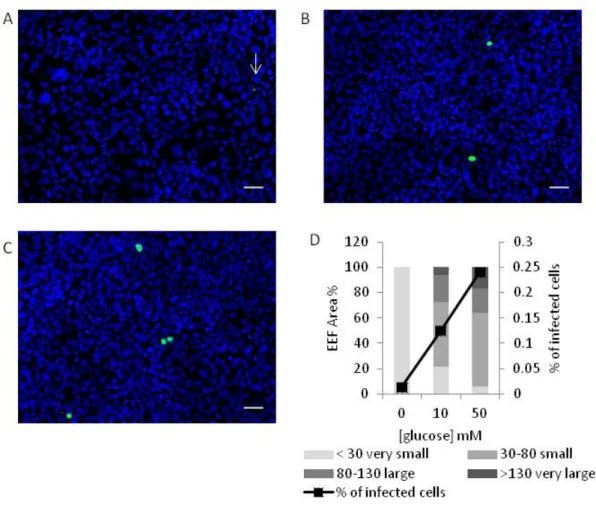
Consistent with the flow cytometry data, microscopy results show that in the absence of glucose the parasite exoerythrocytic forms (EEF) are very small (<30 µm2) and the percentage of infected cells is very low (p<0.001). The presence of glucose in cell culture medium leads to an increase in both size and number of infected cells. When glucose concentration is increased from the normal 10 to 50 mM the percentage of infected cells doubles (p<0.001), but there is not a significant effect on parasite size (p=0.1). There is a small reduction in the percentage of EEF smaller than 30 µm2 and a corresponding increase in EEF larger than 130 µm2, but overall EEF are not significantly larger in the presence of 50 than of 10 mM glucose. The microscopy results confirm that glucose is required for both Plasmodium development and survival inside Huh7 cells (Fig. 9).
Taken together, these results indicate that in the absence of glucose the parasite development is impaired, but when we increase glucose concentration to values higher than 10 mM the parasite development does not seem to be significantly affected. Nevertheless, the increase in glucose concentration possibly promotes the survival of infected cells.