RESEARCH
Production of mannosylglycerate
in Saccharomyces cerevisiae by metabolic
engineering and bioprocess optimization
Cristiana Faria
1,2, Nuno Borges
2, Isabel Rocha
1,2*†and Helena Santos
2†Abstract
Background: Mannosylglycerate (MG) is one of the most widespread compatible solutes among marine
microor-ganisms adapted to hot environments. This ionic solute holds excellent ability to protect proteins against thermal denaturation, hence a large number of biotechnological and clinical applications have been put forward. However, the current prohibitive production costs impose severe constraints towards large-scale applications. All known micro-bial producers synthesize MG from GDP-mannose and 3-phosphoglycerate via a two-step pathway in which manno-syl-3-phosphoglycerate is the intermediate metabolite. In an early work, this pathway was expressed in
Saccharomy-ces cerevisiae with the goal to confirm gene function (Empadinhas et al. in J Bacteriol 186:4075–4084, 2004), but the level of MG accumulation was low. Therefore, in view of the potential biotechnological value of this compound, we decided to invest further effort to convert S. cerevisiae into an efficient cell factory for MG production.
Results: To drive MG production, the pathway for the synthesis of GDP-mannose, one of the MG biosynthetic
precur-sors, was overexpressed in S. cerevisiae along with the MG biosynthetic pathway. MG production was evaluated under different cultivation modes, i.e., flask bottle, batch, and continuous mode with different dilution rates. The genes encoding mannose-6-phosphate isomerase (PMI40) and GDP-mannose pyrophosphorylase (PSA1) were introduced into strain MG01, hosting a plasmid encoding the MG biosynthetic machinery. The resulting engineered strain (MG02) showed around a twofold increase in the activity of PMI40 and PSA1 in comparison to the wild-type. In batch mode, strain MG02 accumulated 15.86 mgMG g−1DCW, representing a 2.2-fold increase relative to the reference strain (MG01). In
continuous culture, at a dilution rate of 0.15 h−1, there was a 1.5-fold improvement in productivity.
Conclusion: In the present study, the yield and productivity of MG were increased by overexpression of the
GDP-mannose pathway and optimization of the mode of cultivation. A maximum of 15.86 mgMG g−1
DCW was achieved
in batch cultivation and maximal productivity of 1.79 mgMG g−1
DCW h−1 in continuous mode. Additionally, a positive
correlation between MG productivity and growth rate/dilution rate was established, although this correlation is not observed for MG yield.
Keywords: Mannosylglycerate, Compatible solute, GDP-mannose, Yeast cell factory, Metabolic engineering,
Chemostat cultivation
© The Author(s) 2018. This article is distributed under the terms of the Creative Commons Attribution 4.0 International License (http://creat iveco mmons .org/licen ses/by/4.0/), which permits unrestricted use, distribution, and reproduction in any medium, provided you give appropriate credit to the original author(s) and the source, provide a link to the Creative Commons license, and indicate if changes were made. The Creative Commons Public Domain Dedication waiver (http://creat iveco mmons .org/ publi cdoma in/zero/1.0/) applies to the data made available in this article, unless otherwise stated.
Open Access
*Correspondence: irocha@deb.uminho.pt
†Isabel Rocha and Helena Santos contributed equally to this work 1 Centre of Biological Engineering, University of Minho, Braga, Portugal Full list of author information is available at the end of the article
Background
Enzymes and other proteins are used in a myriad of applications such as clinical and analytical tests, research, therapeutics, vaccines, food processing, textile industry, cleaning, and biofuel production. In every case, the pres-ervation of the native structure under working condi-tions is a prerequisite for efficacy. While some proteins are remarkably robust and can stand harsh conditions or repeated work cycles, others require the presence of extrinsic stabilizers, or chemical chaperones, to prevent unfolding and/or assist refolding. Osmolytes, like glyc-erol and trehalose, which accumulate inside the cell to counterbalance the external osmotic pressure, are well known protein protectors [1, 2].
The discovery of marine hyperthermophilic organisms in the early 1980s uncovered an untapped source of new osmolytes [3]. Microorganisms adapted to those extreme environments accumulate exquisite organic solutes, usu-ally bearing a negative charge, which are absent from mesophilic prokaryotes. Importantly, these ionic solutes accumulate not only in response to elevated osmotic pressure, but also in response to supraoptimal growth temperature, suggesting a potential role in thermoprotec-tion of cell components in vivo [4].
Mannosylglycerate and di-myo-inositol-phosphate are the most widespread solutes among marine hyperther-mophiles [2–5]. In vitro studies have shown that these compounds are better protein stabilizers than trehalose, glycerol or any other known neutral solutes [6–11]. In particular, MG showed superior performance in a wide range of application tests [6–12]. For example, 0.5 M of MG resulted in a 7.1 °C increase in the melting tempera-ture of the model protein, staphylococcal nuclease, while the same concentration of glycerol or mannosylglycera-mide produced increments of < 1 °C and 2.4 °C, respec-tively [13]. Importantly, we showed that MG was able to inhibit formation of α-synuclein inclusions in the cyto-plasm of yeast cells, a hint of its potential application in drug development against protein misfolding diseases [13, 14].
All known native producers, Archaea and Bacteria, are able to synthesize MG via a two-step pathway: the enzyme mannosyl-3-phosphoglycerate synthase cata-lyzes the reaction of GDP-mannose and 3-phospho-glycerate into mannosyl-3-phospho3-phospho-glycerate, which is subsequently dephosphorylated by mannosyl-3-phos-phoglycerate phosphatase to give MG [15, 16]. Empadin-has et al. [17] noticed that the genome of the mesophilic bacterium Dehalococcoides mccartyi (formerly D.
ethe-nogenes), comprised a gene encoding two domains with
high sequence homology to known mannosyl-3-phos-phoglycerate synthase and mannosyl-3-phosphoglyc-erate phosphatase. The same authors confirmed the
functionality of this gene, designated mgsD, by clon-ing and expression in Saccharomyces cerevisiae, which thereby accumulated intracellular MG up to 7.5 mg g−1
cell dry weight [17].
Capitalizing on these results, we deemed it interesting to invest further efforts to develop S. cerevisiae into a cell factory for MG production. Currently, MG is produced by bitop AG (Witten, Germany) through fermentation of a natural producer. However, this process has very high production costs, preventing the utilization of this com-pound at an industrial scale or even extensive testing to explore new application areas. We selected S. cerevisiae as a host organism for the engineering strategy since it is a robust industrial workhorse used for the production of a wide range of compounds, such as sesquiterpenes, bioethanol, artemisinic acid, succinic acid and vanillin [18–22].
GDP-mannose and 3-phosphoglycerate are the two precursors for the synthesis of MG. We are aware that
S. cerevisiae’s anabolic pathways imply a high demand
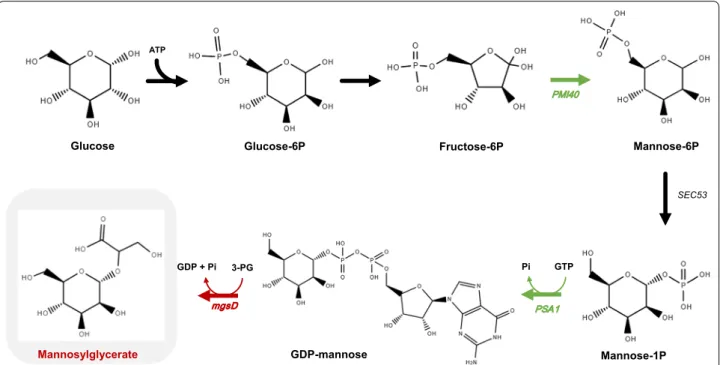
for GDP-mannose. Indeed, this activated sugar is the precursor for protein mannosylation and synthesis of oligomannans, important components of the yeast cell wall [23, 24]. Therefore, our first engineering strategy was intended to enhance the flux towards GDP-man-nose synthesis by overexpressing the genes encoding mannose-6-phosphate isomerase and GDP-mannose pyrophosphorylase (Fig. 1). The production of MG by the resulting engineered strain was evaluated under different cultivation modes, such as flask bottles, controlled batch and continuous fermentations at different dilution rates.
Results and discussion
Strain construction and evaluation of gene overexpression Saccharomyces cerevisiae strain CENPK2-1C was
geneti-cally manipulated to overexpress the genes involved in the synthesis of GDP-mannose and MG (Fig. 1). Two engineered strains were constructed: (i) the first strain (named MG01) harbors the plasmid pDES containing the heterologous gene mgsD encoding mannosyl-3-phos-phoglycerate synthase and mannosyl-3-phosmannosyl-3-phos-phoglycerate phosphatase; and, (ii) the second strain (named MG02), in addition to plasmid pDES, harbors the plasmid pSP02 containing the mannose-6-phosphate isomerase (PMI40) and GDP-mannose pyrophosphorylase (PSA1) genes from S. cerevisiae. The gene PMI40 was cloned under the control of PGK1 promoter and terminator of CYC1, while the gene PSA1 was under the promoter of TEF1 and the terminator of ADH1. These promoters have previously shown high expression levels during growth on glucose [25]. To determine the effect of the overexpression of
PSA1 and PMI40 genes, mannose-6-phosphate
measured in the MG02 strain and compared with the background strain (S. cerevisiae strain CENPK2-1C). The MG02 strain showed an increase of twofold in the man-nose-6-phosphate isomerase activity and 1.4-fold in the GDP-mannose pyrophosphorylase activity in compari-son with the background strain (Table 1).
Physiological characterization of engineered strains
Cultivation conditions exert a great impact in the perfor-mance of producing strains. In particular, S. cerevisiae is known to accumulate ethanol as a major by-product in aerobic conditions under certain circumstances, and these different metabolic states may affect the production
of the desired compound. When there is a low glucose uptake rate, S. cerevisiae exhibits a respiratory metabo-lism only, with no ethanol formation, while, when the glucose concentration and/or uptake rate surpasses a critical threshold value, the metabolism becomes a com-bination of respiration and alcoholic fermentation [26]. In this work, the engineered strains were grown under conditions that imposed a respiratory vs respiro-fer-mentative metabolism; the fitness and MG accumulation parameters were determined under these conditions.
Physiological characterization of engineered strains in shake flasks and batch bioreactors
The engineered strains were initially characterized in shake flasks using synthetic complete medium (SC medium) with 20 g L−1 of glucose. MG01 and
MG02 exhibited similar growth rates (0.24 h−1 for
MG01 vs 0.25 h−1 for MG02), but biomass
produc-tion was different: 0.13 ± 0.01 gDCW g−1glc for MG01 and
0.10 ± 0.00 gDCW g−1glc for MG02. Profiles of growth,
glu-cose consumption, ethanol, glycerol and acetate produc-tion are shown in Addiproduc-tional file 1: Figure S1 indicates a higher production of ethanol and growth for strain MG01 but the same production of glycerol and acetate for both strains. The intracellular content of MG was determined after glucose depletion and, under these conditions,
Fructose-6P GDP-mannose Mannosylglycerate 3-PG PMI40 PSA1 mgsD SEC53 Pi GDP + Pi Glucose-6P ATP Glucose Mannose-6P GTP Mannose-1P
Fig. 1 Biosynthesis of mannosylglycerate (MG) in Saccharomyces cerevisiae using glucose as carbon source. MG is produced from the reaction of GDP-mannose and 3-phosphoglycerate (3PG) with the release of GMP. To produce MG, a gene from Dehalococcoides mccartyi coding for MG synthase/phosphatase (mgsD) was cloned in a plasmid and transformed in S. cerevisiae to yield strain MG01. A second plasmid containing the genes
PMI40 (encodes a mannose-6-phosphate isomerase) and PSA1 (encodes a GDP-mannose pyrophosphorylase) from S. cerevisiae was constructed
and transformed in MG01 yielding MG02
Table 1 Mannose-6-phosphate isomerase (PMI40) and GDP-mannose pyrophosphorylase (PSA1) activities in the background and MG02 strains
CENPK2-1C (U/mg
of protein) MG02 (U/mg of protein) Increase (n-fold)
Mannose-6-phosphate isomerase 120 ± 1 244 ± 10 2.0 GDP-mannose pyrophos-phorylase 45 ± 7 65 ± 14 1.4
MG02 showed a 1.5-fold increase in MG production compared to the reference strain MG01. A comparison between shake flask and controlled bioreactor for both strains is depicted in Additional file 1: Table S1. S.
cerevi-siae GDP-mannose pool had been successfully increased
before by the over-expression of the gene MPG1 (PSA1) in a multi-copy plasmid [23]. In the present work, it was possible to increase MG production by over-expressing
PSA1 (MPG1) and PMI40, which re-directed part of the
glycolytic flux towards the formation of GDP-mannose and consequently to MG.
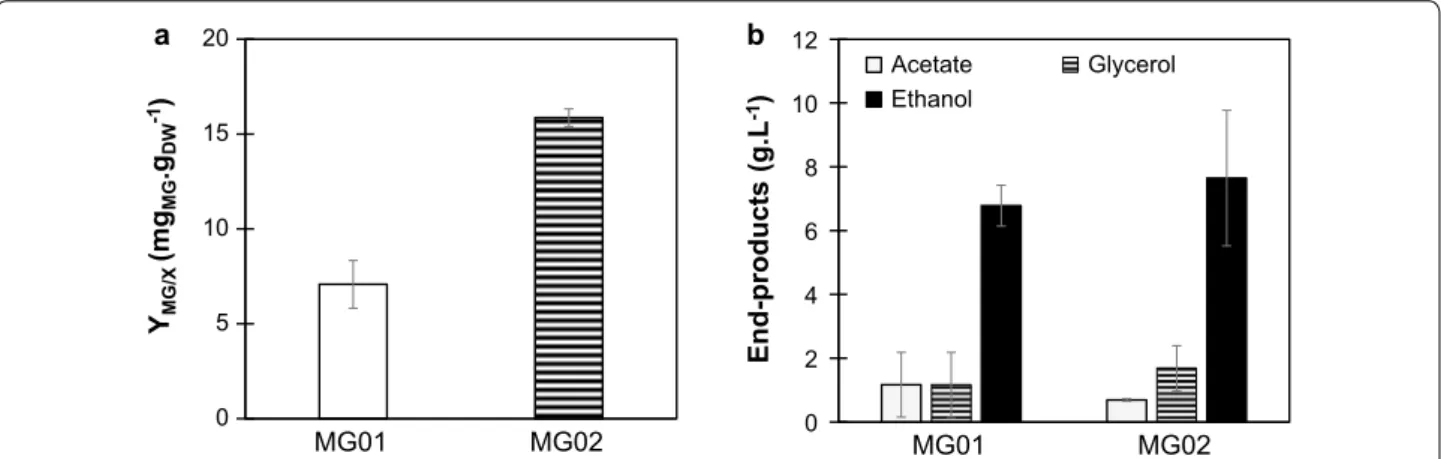
In order to check whether MG accumulation could be enhanced by a controlled environment, strains MG01 and MG02 were grown in a 2-L bioreactor. In controlled batch cultivation, MG02 produced 15.86 mg g−1
DCW of
MG, which represents an increase of 2.2-fold in compari-son to MG01 (Fig. 2a). In controlled batch cultivation, using a bioreactor, it is possible to maintain optimal con-ditions regarding pH, concentration of oxygen and tem-perature. Under these conditions, strain MG02 produced higher amounts of MG than in shake flasks. Moreover, MG01 and MG02 showed no detectable difference in the production of end-products ethanol, glycerol and acetate (Fig. 2b).
Physiological characterization of engineered strains in chemostat at different dilution rates
Since the relative contribution of respiratory and respiro-fermentative regimens in S. cerevisiae depends on glucose availability, it is difficult to achieve a pure respira-tory regimen in controlled batch cultivations. Therefore, a clear distinction of the two metabolic states is only pos-sible in fed-batch and chemostat cultures. In an aerobic environment and in the presence of high concentrations
of glucose, S. cerevisiae has a fermentative/respiratory metabolism due to a limited respiratory capacity [26]. In addition, there is a molecular response whereby the TCA cycle is repressed and the metabolic flow towards fermentation products is increased, a phenomenon des-ignated as the Crabtree effect [27]. This behavior hap-pens independently of the presence of oxygen to support respiration and is seen as an adaptive response to a com-petitive environment, as fermentation increases S.
cerevi-siae’s growth rate. Nevertheless, it is possible to ensure
a respiratory metabolism as long as the glucose uptake rate is kept below the critical threshold that activates fermentation.
To investigate the impact of the respiratory and fermen-tative states in MG production, both strains were grown in chemostats at a dilution rate of 0.1 h−1, where, in
prin-ciple, respiration is favored and the production of ethanol is reduced (or even abolished) [28]. Under these condi-tions, the yield of MG is consistently higher for MG02 in comparison with MG01 (Table 2) and MG productivity is 0.76 mg g−1
DCW h−1 for MG01 and 1.17 mg g−1DCW h−1 for
MG02, which represents a 1.5-fold increase. However, it is apparent that the two strains display different meta-bolic modes, as MG01 has a Respiratory Quotient (RQ) of 1.39, a value close to fully respiratory metabolism [29], while MG02 has an RQ value of 2.32, which denotes a respiro-fermentative metabolism. This result is also cor-roborated by the accumulation of higher amounts of ethanol and glycerol in MG02 (Table 2). Despite the RQ differences, the biomass yield under these conditions remains the same for both strains. Most likely, the differ-ences in by-products accumulation are not high enough to provoke an observable decrease in the biomass yield, given the experimental error. Therefore, we conclude
0 5 10 15 20 MG01 MG02 YMG/X (m gMG .gDW -1) a b 0 2 4 6 8 10 12 MG01 MG02 End-products (g.L -1) Acetate Glycerol Ethanol
Fig. 2 MG production and end-products formation observed for strains MG01 and MG02 in controlled batch cultivations. a MG production on biomass for strains MG01 and MG02. Cells were grown in SC medium with 20 g L−1 of glucose and MG content was assessed after glucose was
depleted from the medium. b Ethanol, glycerol, and acetate production of strains MG01 and MG02. Data represents the mean ± SD of three independent experiments
that the higher production of MG or/and directly the over-expression of PSA1 and PMI40 correlate with a sig-nificant decrease of the respiratory capacity of the cell. Although no previous work has reported the physiologi-cal impact of overexpressing these two genes, it would be counter-intuitive to assume that a diversion of part of the glycolytic flux would increase by-product accumulation.
Additionally, the ionic nature of MG might be unbal-ancing cell homeostasis and therefore reducing cell fit-ness for MG02, as 15.86 mgMG g−1
DCW represents an
intracellular concentration of approximately 25 mM, which is a substantial value for an organism that intrin-sically accumulates non-charged osmolytes, like glycerol and trehalose [1, 30]. Increasing concentrations of MG produces an acidification of the cytoplasm (pKa of MG is 3.35) which can compromise growth [31, 32] and impair essential metabolic functions [33]. S. cerevisiae cultivated in aerobic conditions with glucose as carbon source, switches from respiratory-fermentative growth to mainly fermentative growth in the presence of high concentra-tions of acetic acid, that shares with MG the characteris-tics of a weak acid. Under these conditions, a significant decrease in the specific rate of O2 consumption was
observed while high level of CO2 were maintained
[36], as observed for the MG02 strain. Additionally, the metabolic shift to a fermentative behavior (higher RQ) observed in MG02 has been described before for other inhibiting compounds such as furfural, a compound known to inhibit glycolytic enzymes, react with cellular constituents and compromise the respiratory activity [34,
35], although the mechanisms of action are probably dif-ferent from weak acids.
Additionally, steady-state MG02 cells cultivated under a dilution rate of 0.1 h−1 showed a profile of ethanol
production that is largely influenced by the concentra-tion of ethanol produced during growth in the batch mode. Chemostat experiments were initiated with dif-ferent ethanol concentrations, which apparently pro-duced different results for the ethanol concentration at steady-state, explaining the high standard deviation associated with ethanol production observed in Table 2. However, the rate of ethanol decrease from the begin-ning of the chemostat until steady-state is very similar
for both experiments (see Additional file 1: Figure S2). The fact that the initial ethanol concentration is not fully washed from the bioreactor during the continuous cul-tivation at low dilution rates may be another indication that both strains are not in full respiratory regimen [37]. However, the influence of initial ethanol concentration in continuous cultures in the respiratory capacity has not been, to our knowledge, previously reported and remains unexplained.
To evaluate the impact of increasing the dilution rate, we performed chemostat experiments at dilution rates close to the maximum (washout) values (0.15 h−1 for
MG02 and 0.2 h−1 for MG01). The difference between
MG01 and MG02 in MG production observed at 0.1 h−1
is kept, while the productivity of both strains in chemo-stats at 0.1 h−1 dilution rate is lower when compared to
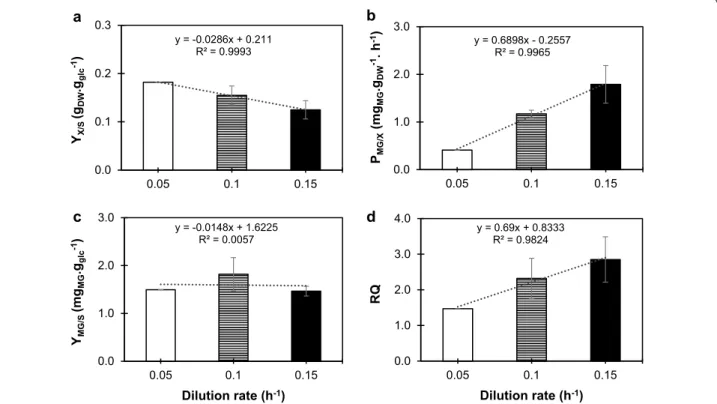
chemostats performed close to maximal dilution rates (Additional file 1: Table S2). Curiously, MG yield on bio-mass is not influenced by the variation on the dilution rate, either for MG01 or MG02, although for MG02 the MG yield on substrate is larger for the lower dilution rate.
In order to understand the role of different metabolic states in the production of MG and to gain insight into the respiratory capacity, cells from MG02 were cultivated in a chemostat at dilution rate of 0.05 h−1 to allow for
fully respiratory mode. A comparison of the three dilu-tion rates for this strain shows that, as expected, the bio-mass yield on glucose decreases with high dilution rates (Fig. 3a). In aerobic glucose-limited chemostat cultures, it is well-known that when yeast cells are cultivated at high rates (close to the maximal growth rate), the flux from glycolysis is re-directed to the production of by-prod-ucts (e.g. ethanol) and respiration is kept at lower levels. However, when the dilution rate is reduced, respiration becomes the major source of energy through TCA cycle and consequently, the production of biomass increases [37]. Also, by gradually decreasing the dilution rate in MG02, we verified a decrease in the production rate of MG (Fig. 3b). However, there is no correlation between the dilution rate and MG yield on glucose (Fig. 3c) or even production on biomass (remains the same for dilutions 0.15 and 0.1 h−1 (Additional file 1: Table S2)
and decreases to 8.21 mgMG g−1DCW at dilution 0.05 h−1). Table 2 Physiological parameters and MG yield for the engineered strains MG01 and MG02 in chemostat cultivation at dilution rate 0.1 h−1
a Yields on biomass for substrate Y
X/S are represented as gDCW g−1glc and yields on substrate for ethanol YEtOH/S, acetate YAcet/S and glycerol YGly/S are represented as g g−1glc b MG production on biomass Y
MG/X is represented as mgMG g−1DCW c Productivity in chemostat cultivation for MG is represented as mg g−1
DCW h−1
Strain Ya
X/S YbMG/X YaEtOH/S YaAcet/S YaGly/S PcMG/X
MG01 0.13 ± 0.02 7.58 ± 1.21 0.17 ± 0.03 0.05 ± 0.01 0.001 ± 0.001 0.76 ± 0.12 MG02 0.15 ± 0.02 11.71 ± 0.77 0.33 ± 0.31 0.04 ± 0.02 0.013 ± 0.001 1.17 ± 0.08
Despite the lack of correlation with dilution, MG seems to reach a peak of production in terms of yield per sub-strate at 0.1 h−1 dilution rate (Fig. 3c). In light of these
results, we can conclude that MG production does not respond linearly to a variation on the growth rate; how-ever, as cells are growing more rapidly, MG productiv-ity is higher at higher dilution rates. Another important result is the variation of RQ values with the dilution rates examined. Coherently with previously published results [29], RQ decreases at lower dilutions and strain MG02 is virtually at a fully respiratory state at dilution 0.05 h−1
(Fig. 3d), corroborated by the absence of glycerol pro-duction and decrease on acetate/ethanol yields which dropped to 0.1 g g−1
glc.
Continuous mode chemostat presents several advan-tages in comparison with batch cultures and it is a valua-ble approach to explore the best conditions for industrial production. One advantage, which is exploited in this work, is the evaluation under controlled conditions of physiological parameters based on growth rates [38]. The cultivation of S. cerevisiae in respiro-fermentative metabolic mode holds some issues as it is accompanied by the accumulation of by-products and low biomass yield. Additionally, ethanol production might interfere
with the productivity of compounds by provoking toxic-ity [39]. For this reason, industrial bioprocesses usually use a dilution rate of 0.1 h−1 or lower [38] as is the case
of resveratrol production [40]. Nonetheless, the respiro-fermentative metabolism favors the production of certain compounds. In a recent study, the cultivation conditions for ethylene production were optimized and were found to be coupled with the growth rate [41]. MG is produced from GDP-mannose and 3-phosphoglycerate (3PG), both derived from glycolysis. As the respiro-fermentative metabolism of S. cerevisiae implies a higher glycolytic flux than respiration, it is reasonable to speculate that MG production would increase with higher growth rates in chemostat. Additionally, it has been described that
PSA1 is an essential gene linked to the progression of cell
cycle, since efficient glycosylation of proteins is a key-point for cell division [42]. Even more, PSA1 transcript levels increase with higher growth rates [43], which may favor the synthesis of GDP-mannose and ultimately the synthesis of MG. In the present work, this correla-tion between MG produccorrela-tion and growth rates was not observed. The fact that MG production was not depend-ent on growth rate may indicate that there is a bottleneck downstream of GDP-mannose, i.e., in the production of
y = 0.6898x - 0.2557 R² = 0.9965 0.0 1.0 2.0 3.0 0.05 0.1 0.15 PMG/X (m gMG .gDW -1. h -1) y = 0.69x + 0.8333 R² = 0.9824 0.0 1.0 2.0 3.0 4.0 0.05 0.1 0.15 RQ Dilution rate (h-1) a b c y = -0.0148x + 1.6225 R² = 0.0057 0.0 1.0 2.0 3.0 0.05 0.1 0.15 YMG/S (m gMG .ggl c -1) Dilution rate (h-1) d y = -0.0286x + 0.211 R² = 0.9993 0.0 0.1 0.2 0.3 0.05 0.1 0.15 YX/S (gDW .ggl c -1)
Fig. 3 Effect of dilution rate in the formation of biomass, MG production rate and respiratory quotient (RQ) for MG02 (mgsD ↑pmi40 ↑psa1). Chemostats were performed in 2-L fermenters containing SC medium with 20 g L−1 glucose. a Biomass yield on substrate, represented as
gDCW g−1glc, b MG productivity represented as mgMG g−1DCW h−1, c MG yield represented as mgMG g−1glc, and d RQ. For dilution 0.1 and 0.15 h−1 data is the
MG which is catalyzed by the bifunctional enzyme man-nosylglycerate synthase/phosphatase.
Conclusions
In this study, we have increased the yields and produc-tivity of mannosylgycerate (MG), a protein stabilizer with outstanding properties, by over-expressing PSA1 and PMI40 (GDP-mannose pathway) and by optimizing the mode of cultivation. The resulting strain MG02 pre-sents up to 2.2-fold improvement in MG production on biomass, being able to produce 1.79 mg of MG per gram of biomass per hour at a dilution of 0.15 h−1. Also, it was
not possible to establish a correlation between growth rate and MG yield on substrate, although MG productiv-ity increases with higher dilution rates. New rounds of optimization are needed to produce MG in S. cerevisiae at adequate levels, i.e., well above the values reported for organisms that naturally produce this compound. For instance, evaluate the overexpression of SEC53 gene and improve the expression of MG synthase. To this end, a holistic approach should be considered, based on in silico driven metabolic engineering to find gene targets that will improve MG production.
Methods
DNA manipulation
Saccharomyces cerevisiae genomic DNA for colony PCR
and gene amplification was prepared as described by Lõoke et al. [44]. Primers were purchased from Meta-bion (Germany). Gene amplification and colony PCR were performed using, respectively, Phusion polymerase and DreamTaq DNA polymerase (both enzymes from Thermoscientific, USA). PCR reactions were performed in a Thermal Cycler from Bio-Rad (USA), following the protocols recommended by the manufacturers for each polymerase. Plasmid extraction, PCR product purifi-cation, and DNA gel extraction were carried out with Zymo Research kits (USA). All restriction enzymes were obtained in fast-digestion format from Thermoscientific (USA). The plasmid pDES, containing the gene mgsD that codes for mannosyl-3-phosphoglycerate synthase/phos-phatase from D. mccartyi under the control of the ENO2 promoter from enolase II, was kindly provided by Milton S. da Costa (University of Coimbra, Portugal) [17]. S.
cer-evisiae transformation was performed using the lithium
acetate method as described by Gietz et al. [45].
Escheri-chia coli DH5α was used for plasmid isolation and
main-tenance following the competence and transformation procedures developed by Dower et al. [46].
Construction of engineered strains
The plasmid pSP-GM was kindly provided by Prof. Jens Nielsen’s group (Chalmers University of Technology,
Sweden) [25]. This plasmid was used to express the man-nose-6-phosphate isomerase (PMI40) and GDP-mannose pyrophosphorylase (PSA1) encoding genes from S.
cer-evisiae. The gene PMI40 was amplified using genomic
DNA isolated from S. cerevisiae strain CENPK2-1C with the primers pair 5′-CCG CGG CCG CAA AAA AAT GTC CAA CAA GCT GTT CAG G-3′ and 5′-CCG AGC TCC TAA TTT GGT TCC ACA AAGGC-3′. This PCR product was digested with SacI/NotI and ligated into pSP-GM between promoter of TEF1 and terminator of ADH1 using a T4 ligase (Thermoscientific, USA), yielding pSP01. Next, the gene PSA1 was amplified using again S.
cerevisiae strain CENPK2-1C genomic DNA with
prim-ers pair 5′-GGC CCG GGA AAA AAA TGA AAG GTT TAA TTT TAG TCG G-3′ and 5′-CCA AGC TTT CAC ATA ATA ATA GCT TCC TTT GG-3′. This PCR product was digested with HindIII/XmaI and ligated into pSP01 using a T4 ligase between promoter of PGK and terminator of
CYC1, resulting in plasmid pSP02. Colonies harboring
pSP01 and pSP02 were identified by performing colony PCR with the primers used in the amplification. Correct constructions of plasmids were confirmed by restric-tion analysis and DNA sequencing (GATC Biotech, Germany).
The strain S. cerevisiae CENPK2-1C, obtained from EUROCARF (Germany), was used as the host strain in this work. The strain MG01 was obtained by transform-ing CENPK2-1C cells with plasmid pDES (conferrtransform-ing yeast cells the ability to produce MG); strain MG02 was obtained by transforming MG01 with plasmid pSP02, leading to a strain combining GDP-mannose overpro-duction and MG synthesis (Table 3).
Strain maintenance and cultivation media
Selection and maintenance of plasmids in E. coli was performed in LB medium containing 10 g L−1 of
pep-tone, 10 g L−1 of NaCl, 5 g L−1 of yeast extract, and
sup-plemented with 100 mg L−1 of ampicillin. The solid LB
medium also included 20 g L−1 of agar. All cultivations of E. coli were carried out at 37 °C and 200 rpm of agitation.
Saccharomyces cerevisiae strain CENPK2-1C (MATa
ura3-52 his3-Δ1 leu2-3,112 trp1-289, MAL2-8c SUC2) was cultivated in YPD medium, containing 10 g L−1 of
yeast extract, 20 g L−1 of peptone, and 20 g L−1 of glucose,
at 30 °C and 160 rpm. Recombinant strains were selected on Synthetic complete (SC) medium containing 6.7 g L−1
of yeast nitrogen base without amino acids from Difco (USA), 20 g L−1 of glucose and 20 g L−1 of agar. When
necessary, histidine (20 mg L−1), tryptophan (20 mg L−1),
uracil (20 mg L−1) and leucine (30 mg L−1), were added to
cover auxotrophies. All cultivations of S. cerevisiae were performed at 30 °C with 160 rpm agitation.
The SC medium used for shake flasks, batch in con-trolled bioreactors, and continuous cultivation contained 6.7 g L−1 of yeast nitrogen base without amino acids
from Difco (USA) supplemented with 20 g L−1 of
glu-cose. For strain MG01, SC medium was supplemented with histidine (20 mg L−1), tryptophan (20 mg L−1), and
uracil (20 mg L−1), while for strain MG02 it was
comple-mented only with histidine and tryptophan, in the same concentrations [48]. For shake flask cultivations, MG01 and MG02 were pre-grown in 50 mL of SC medium at 30 °C and 160 rpm. Then, cells were used to inoculate 500 mL shake flasks containing 100 mL of SC medium with an initial OD600 of 0.1. Growth was followed using a
spectrophotometer V-560 from Jasco (Japan); cells were harvested at the end of the exponential phase (24 h upon inoculation).
Batch cultivations were performed as following: firstly, cells were grown overnight in shake flasks from a single colony. Each fermenter was inoculated at an initial OD600
of 0.1. The batch fermentations were performed in a BIO-STAT-B Plus system (Sartorius, Germany) coupled with a 2-L culture vessel. The operating conditions are the fol-lowing: the fermentation volume was 0.8 L, the tempera-ture was maintained at 30 °C, the airflow was 1 vvm, the pH was kept at 5.5 controlled by addition of 2 M NaOH, and the dissolved O2 was kept above 30% of saturation by
feedback control of the stirring speed from 200 rpm up to 600 rpm. Concentrations of O2 and CO2 in the exhaust
gas were monitored by Bluesens gas analyzers (Germany) and RQ represents the ratio between CO2 produced and
O2 consumed during fermentation. Biological samples
were collected at the end of the exponential phase, when CO2 production dropped drastically.
Continuous cultivations were also carried out in a Sar-torius BIOSTAT-B Plus system coupled with a 2-L cul-ture vessel with a constant working volume of 0.8 L, with
the same controlled variables and set-points as before. The medium described above was used to feed the bio-reactor at dilution rates of 0.05, 0.1, 0.15 and 0.2 h−1. The
volume was kept at 0.8 L by controlling the level of broth inside the vessel. To guarantee that the culture reached a steady-state mode, at least 5 volumes of medium were allowed to pass through the culture whenever the dilu-tion rate was changed. Samples were collected when O2
consumption and CO2 production were constant. Quantification of MG, biomass and fermentation end products
For each sampling, 50 mL of broth were removed from the culture and centrifuged at 3600×g for 10 min to separate cells from the medium. Next, the supernatant was filtered through a membrane filter with a pore size of 0.22 μm into HPLC vials and stored at − 20 °C until further analyzed for glucose, glycerol, acetate, and ethanol. MG is an intracellular compound and was extracted from the cell pellet by adding 5 mL of water, 5 mL of methanol and 10 mL of chloroform. This mix-ture was vigorously shaken with the help of a vortex and then centrifuged at 12,000×g for 30 min at 4 °C. The top part, corresponding to the aqueous phase, was carefully transferred to a new tube and the process of centrifugation was repeated after the addition of 5 mL of water. Once the aqueous phase was separated, sam-ples were evaporated using a Savant™ SPD131DDA
SpeedVac (Thermoscientific, USA). Next, the evapo-rated samples were dissolved in 1 mL of water and transferred to an HPLC vial. Analysis was performed in an HPLC apparatus from Jasco (Japan) model LC-NetII/ADC equipped with UV-2075 Plus and RI-2031 Plus detectors, also from Jasco. The samples were ana-lyzed using an Aminex HPX-87H column from Bio-Rad, which was kept at 50 °C, and a solution of 0.01 M
Table 3 List of strains and plasmids used in this work
LEU2, leucine auxotrophy; mgsD, mannosyl-3-phosphoglycerate synthase/phosphatase gene; ENO2, gene enolase II; URA3, uracil auxotrophy; PMI40, mannose-6-phosphate isomerase gene; PSA1, GDP-mannose pyrophosphorylase gene
Relevant characteristics References
Strains
CEN.PK2-1C Wild-type strain (MATa; his3D1; leu2-3_112; ura3-52; trp1-289; MAL2-8c; SUC2) [47]
MG01 CEN.PK2-1C with plasmid pDES to allow MG production This work
MG02 CEN.PK2-1C with plasmid pDES and plasmid pSP02 to overexpress genes from GDP-mannose pathway This work Plasmids
pDES pRS425 plasmid backbone with LEU2 as auxotrophic marker. Contains mgsD gene from D. mccartyi under the
con-trol of the promotor ENO2 from S. cerevisiae [17]
pSP-GM pESC plasmid backbone with URA3 as auxotrophic marker. Harbors TEF1 and PGK promoters from S. cerevisiae [25]
pSP01 pSP-GM with PMI40 gene from S. cerevisiae This work
of H2SO4 was used as the mobile phase with a flow rate
of 0.3 mL min−1. Quantitative analysis of glucose, MG,
glycerol, acetate and ethanol was performed by com-parison with a mixture of standards with known con-centrations of each metabolite. MG standards were obtained from cell biomass of Rhodothermus marinus as previously described [49]. Calibration curves were prepared using the peak areas of the RI detector for glucose, glycerol, acetate and ethanol and of the UV detector at 210 nm for MG. The cell dry weight was determined by filtering 5 mL of culture broth through a 0.22 μm pore Millipore filter and washing once with 5 mL of water. Filters were then dried for 10 min at 150 W in a microwave oven and weighted using an analytical balance.
Quantification of enzymatic activities
For the determination of mannose-6-phosphate isomerase and GDP-mannose pyrophosphorylase activ-ities, strains WT and MG02 were grown in shake flasks until mid-exponential phase. Cells were harvested by centrifugation and re-suspended in water with a cock-tail of protein inhibitors (1×), following manufacturer’s instructions (Roche, USA). Next, cells were broken with three pulses of vortexing (4.0 m s−1 for 60 s) using a
Fastprep 24 system (MP, USA), keeping cells on ice for 5 min between each pulse. Supernatants were obtained by centrifugation at 13,500×g for 5 min and used to determine enzymatic activities. Total protein was determined using the Bradford method [50]. The spec-trophotometric methods used to determine the enzy-matic activities have been described by Bergmeyer [51]. Briefly, for the mannose-6-phosphate isomerase activ-ity, the assay mixture (final volume of 1 mL) contained: 50 mM Tris–HCl (pH 7), 5 mM mannose-6-phos-phate, 8 mM MgCl2, 2.8 mM NADP, 0.27 U
glucose-6-phosphate dehydrogenase, 0.27 U phosphoglucose isomerase, and 0.25 mg of cell extract. Reactions were started by the addition of mannose-6-phosphate and absorbance was measured at 340 nm for 2 min. For the GDP-mannose pyrophosphorylase activity, the assay mixture (final volume of 1 mL) contained: 50 mM of Tris–HCl (pH 7), 0.5 mM NaF, 10 mM MgCI2, 0.1 mM
ADP, 1 mM glucose, 1 mM NADP, 2 mM PPi, 5.5 mM GDP-mannose, 1 U each of nucleoside kinase, hexoki-nase, and glucose-6-P dehydrogehexoki-nase, and 0.25 mg of cell extract. The reaction was started by the addi-tion of GDP-mannose, and the formaaddi-tion of NADPH was monitored by recording the absorbance at 340 nm for 2 min. One unit corresponds to the conversion of 1 µmol of substrate per minute.
Additional file
Additional file 1: Figure S1. Growth and end-products formation of the strains MG01 (A) and MG02 (B) cultivated in shake flask with SC medium containing 20 g L−1 of glucose. Data represent the mean of three independent experiments. Gly—glycerol; Acet—acetate; EtOH—ethanol.
Table S1. MG and end-products production and yields for the engineered
strains MG01 (mgsD) and MG02 (mgsD ↑pmi40 ↑psa1) cultivated in shake flask and batch fermenters. Data represent the mean ± SD of at least three independent experiments. Table S2. Physiological parameters and MG yields for the engineered strains MG01 (mgsD) and MG02 (mgsD ↑pmi40 ↑psa1) in chemostat cultivation at different dilution rates. Figure S2. Profile of glucose consumption, acetate, glycerol, ethanol and MG produc-tion from the beginning until steady-state for strains MG01 (A) and MG02 (B) cultivated in two independent chemostats (experiment 1 and 2) with dilution 0.1 h−1.
Abbreviations
DCW: dry cell weight; OD600: optical density measured at 600 nm; LB medium: Luria–Bertani medium; SC medium: synthetic complete medium; SD: standard deviation; MG: mannosylglycerate; 3PG: 3-phosphoglycerate; vvm: gas volume flow per unit of liquid volume per minute; RQ: respiratory quotient.
Authors’ contributions
CF carried out the experiments, analyzed the data and drafted the manuscript. IR and HS conceived and supervised the study. HS, IR and NB supervised and reviewed the final manuscript. All authors read and approved the final manuscript.
Author details
1 Centre of Biological Engineering, University of Minho, Braga, Portugal. 2 Insti-tuto de Tecnologia Química e Biológica António Xavier, Universidade Nova de Lisboa (ITQB NOVA), Oeiras, Portugal.
Acknowledgements
Not applicable.
Competing interests
The authors declare that they have no competing interests.
Availability of data and supporting materials
All the data generated and analyzed in this study are included within the article (and it additional file).
Consent for publication
Not applicable.
Ethics approval and consent to participate
Not applicable.
Funding
This study was supported by the Portuguese Foundation for Science and Technology (FCT) under the scope of the strategic funding of UID/BIO/04469 unit and COMPETE 2020 (POCI-01-0145-FEDER-006684), BioTecNorte opera-tion (NORTE-01-0145-FEDER-000004) funded by the European Regional Development Fund under the scope of Norte2020—Programa Operacional Regional do Norte and also by project LISBOA-01-0145-FEDER-007660 (Microbiologia Molecular, Estrutural e Celular) funded by FEDER through COM-PETE2020—Programa Operacional Competitividade e Internacionalização (POCI). Cristiana Faria was supported by a Ph.D. Grant from FCT (Ref. SFRH/ BD/79552/2011).
Publisher’s Note
Springer Nature remains neutral with regard to jurisdictional claims in pub-lished maps and institutional affiliations.
References
1. Elbein AD. New insights on trehalose: a multifunctional molecule. Glyco-biology. 2003;13:17R–27R.
2. da Costa MS, Santos H, Galinski EA. An overview of the role and diversity of compatible solutes in Bacteria and Archaea. Adv Biochem Eng Biotech-nol. 1998;61:117–53.
3. Santos H, da Costa MS. Compatible solutes of organisms that live in hot saline environments. Environ Microbiol. 2002;4:501–9.
4. Lamosa P, Faria TQ, Borges N, Neves C, Santos H. The physiological role, biosynthesis, and mode of action of compatible solutes from (hyper)ther-mophiles. In: Glansdorff N, Gerday C, editors. Physiology and biochemis-try of extremophiles. New York: American Society of Microbiology; 2007. p. 86–103.
5. Santos H, Ramos A, da Costa MS. Thermostabilization, osmoprotection, and protection against desiccation of enzymes, cell components, and cells by mannosylglycerate. European patent submitted at 14/03/97 with no 97670002.1 and published in 07/01/98, Bulletin 1998/02 (EP 816509 A2, A3). Applicant: IBET. Licensed to Bitop AG in 2002; 1998.
6. Ramos A, Raven NDH, Sharp RJ, Bartolucci S, Rossi M, Cannio R, et al. Stabilization of enzymes against thermal stress and freeze-drying by mannosylglycerate. Appl Environ Microbiol. 1997;63:4020–5. 7. Shima S, Hérault DA, Berkessel A, Thauer RK. Activation and
thermo-stabilization effects of cyclic 2,3-diphosphoglycerate on enzymes from the hyperthermophilic Methanopyrus kandleri. Arch Microbiol. 1998;170:469–72.
8. Lamosa P, Burke A, Peist R, Huber R, Liu MY, Silva G, et al. Thermostabiliza-tion of proteins by diglycerol phosphate, a new compatible solute from the hyperthermophile Archaeoglobus fulgidus. Appl Environ Microbiol. 2000;66:1974–9.
9. Borges N, Ramos A, Raven NDH, Sharp RJ, Santos H. Comparative study of the thermostabilizing properties of mannosylglycerate and other compatible solutes on model enzymes. Extremophiles. 2002;6:209–16. 10. Longo CM, Wei Y, Roberts MF, Miller SJ. Asymmetric syntheses of l, l-
and l,d-di-myo-inositol-1,1′-phosphate and their behavior as stabilizers of enzyme activity at extreme temperatures. Angew Chemie Int Ed. 2009;48:4158–61.
11. Santos H, Lamosa P, Borges N, Gonçalves LG, Pais T, Rodrigues MV. Organic compatible solutes of prokaryotes that thrive in hot environments: the importance of ionic compounds for thermostabilization. Tokyo: Springer; 2011. p. 497–520.
12. Jorge CD, Borges N, Bagyan I, Bilstein A, Santos H. Potential applications of stress solutes from extremophiles in protein folding diseases and healthcare. Extremophiles. 2016;20:251–9.
13. Faria TQ, Mingote A, Siopa F, Ventura R, Maycock C, Santos H. Design of new enzyme stabilizers inspired by glycosides of hyperthermophilic microorganisms. Carbohydr Res. 2008;343:3025–33.
14. Faria C, Jorge CD, Borges N, Tenreiro S, Outeiro TF, Santos H. Inhibition of formation of α-synuclein inclusions by mannosylglycerate in a yeast model of Parkinson’s disease. Biochim Biophys Acta. 2013;1830:4065–72. 15. Martins LO, Empadinhas N, Marugg JD, Miguel C, Ferreira C, da Costa MS,
et al. Biosynthesis of mannosylglycerate in the thermophilic bacterium
Rhodothermus marinus. Biochemical and genetic characterization of a
mannosylglycerate synthase. J Biol Chem. 1999;274:35407–14. 16. Borges N, Jorge CD, Gonçalves LG, Gonçalves S, Matias PM, Santos H.
Mannosylglycerate: structural analysis of biosynthesis and evolutionary history. Extremophiles. 2014;18:835–52.
17. Empadinhas N, Albuquerque L, Costa J, Zinder SH, Santos M, San-tos H, et al. A gene from the mesophilic bacterium Dehalococcoides
ethenogenes encodes a novel mannosylglycerate synthase. J Bacteriol.
2004;186:4075–84.
18. Asadollahi MA, Maury J, Patil KR, Schalk M, Clark A, Nielsen J. Enhancing sesquiterpene production in Saccharomyces cerevisiae through in silico driven metabolic engineering. Metab Eng. 2009;11:328–34.
19. van Zyl WH, Lynd LR, den Haan R, McBride JE. Consolidated bioprocessing for bioethanol production using Saccharomyces cerevisiae. Adv Biochem Eng Biotechnol. 2007;108:205–35.
20. Ro D-K, Paradise EM, Ouellet M, Fisher KJ, Newman KL, Ndungu JM, et al. Production of the antimalarial drug precursor artemisinic acid in engi-neered yeast. Nature. 2006;440:940–3.
21. Otero JM, Cimini D, Patil KR, Poulsen SG, Olsson L, Nielsen J. Industrial systems biology of Saccharomyces cerevisiae enables novel succinic acid cell factory. PLoS ONE. 2013;8:e54144.
22. Brochado AR, Matos C, Møller BL, Hansen J, Mortensen UH, Patil KR. Improved vanillin production in baker’s yeast through in silico design. Microb Cell Fact. 2010;9:84.
23. Janik A, Sosnowska M, Kruszewska J, Krotkiewski H, Lehle L, Palamarczyk G. Overexpression of GDP-mannose pyrophosphorylase in
Saccharomy-ces cerevisiae corrects defects in dolichol-linked saccharide formation and
protein glycosylation. Biochim Biophys Acta Gen Subj. 2003;1621:22–30. 24. Hashimoto H, Sakakibara A, Yamasaki M, Yoda K. Saccharomyces cerevisiae
VIG9 encodes GDP-mannose pyrophosphorylase, which is essential for protein glycosylation. J Biol Chem. 1997;272:16308–14.
25. Partow S, Siewers V, Bjørn S, Nielsen J, Maury J. Characterization of differ-ent promoters for designing a new expression vector in Saccharomyces
cerevisiae. Yeast. 2010;27:955–64.
26. Sonnleitner B, Käppeli O. Growth of Saccharomyces cerevisiae is controlled by its limited respiratory capacity: formulation and verification of a hypothesis. Biotechnol Bioeng. 1986;28:927–37.
27. Crabtree HG. Observations on the carbohydrate metabolism of tumours. Biochem J. 1929;23:536–45.
28. Postma E, Verduyn C, Scheffers WA, Van Dijken JP. Enzymic analysis of the crabtree effect in glucose-limited chemostat cultures of Saccharomyces
cerevisiae. Appl Environ Microbiol. 1989;55:468–77.
29. Otterstedt K, Larsson C, Bill RM, Ståhlberg A, Boles E, Hohmann S, et al. Switching the mode of metabolism in the yeast Saccharomyces cerevisiae. EMBO Rep Eur Mol Biol Organ. 2004;5:532–7.
30. Nevoigt E, Stahl U. Osmoregulation and glycerol metabolism in the yeast
Saccharomyces cerevisiae. FEMS Microbiol Rev. 1997;21:231–41.
31. Russell JB. Another explanation for the toxicity of fermentation acids at low pH: anion accumulation versus uncoupling. J Appl Bacteriol. 1992;73:363–70.
32. Ullah A, Orij R, Brul S, Smits GJ. Quantitative analysis of the modes of growth inhibition by weak organic acids in Saccharomyces cerevisiae. Appl Environ Microbiol. 2012;78:8377–87.
33. Abbott DA, Knijnenburg TA, de Poorter LMI, Reinders MJT, Pronk JT, van Maris AJA. Generic and specific transcriptional responses to different weak organic acids in anaerobic chemostat cultures of Saccharomyces
cerevisiae. FEMS Yeast Res. 2007;7:819–33.
34. Sárvári Horváth I, Franzén CJ, Taherzadeh MJ, Niklasson C, Lidén G. Effects of furfural on the respiratory metabolism of Saccharomyces cerevisiae in glucose-limited chemostats. Appl Environ Microbiol. 2003;69:4076–86. 35. Heer D, Sauer U. Identification of furfural as a key toxin in lignocellulosic
hydrolysates and evolution of a tolerant yeast strain. Microb Biotechnol. 2008;1:497–506.
36. Guo Z, Olsson L. Physiological response of Saccharomyces cerevisiae to weak acids present in lignocellulosic hydrolysate. FEMS Yeast Res. 2014;14:1234–48.
37. Van Hoek P, Van Dijken JP, Pronk JT. Effect of specific growth rate on fermentative capacity of baker’s yeast. Appl Environ Microbiol. 1998;64:4226–33.
38. Nielsen J, Villadsen J, Lidén G. Bioreaction engineering principles. 1st ed. Boston: Springer; 2003.
39. Stanley D, Bandara A, Fraser S, Chambers PJ, Stanley GA. The ethanol stress response and ethanol tolerance of Saccharomyces cerevisiae. J Appl Microbiol. 2010;109:13–24.
40. Vos T, de la Torre Cortés P, van Gulik WM, Pronk JT, Daran-Lapujade P. Growth-rate dependency of de novo resveratrol production in chemostat cultures of an engineered Saccharomyces cerevisiae strain. Microb Cell Fact. 2015;14:133.
41. Johansson N, Quehl P, Norbeck J, Larsson C. Identification of factors for improved ethylene production via the ethylene forming enzyme in che-mostat cultures of Saccharomyces cerevisiae. Microb Cell Fact. 2013;12:89. 42. Zhang N, Gardner DC, Oliver SG, Stateva LI. Down-regulation of the
expression of PKC1 and SRB1/PSA1/VIG9, two genes involved in cell wall integrity in Saccharomyces cerevisiae, causes flocculation. Microbiology. 1999;145:309–16.
43. Nookaew I, Papini M, Pornputtapong N, Scalcinati G, Fagerberg L, Uhlén M, et al. A comprehensive comparison of RNA-Seq-based transcriptome analysis from reads to differential gene expression and cross-comparison
•fast, convenient online submission
•
thorough peer review by experienced researchers in your field
• rapid publication on acceptance
• support for research data, including large and complex data types
•
gold Open Access which fosters wider collaboration and increased citations maximum visibility for your research: over 100M website views per year
•
At BMC, research is always in progress. Learn more biomedcentral.com/submissions
Ready to submit your research? Choose BMC and benefit from: with microarrays: a case study in Saccharomyces cerevisiae. Nucleic Acids
Res. 2012;40:10084–97.
44. Lõoke M, Kristjuhan K, Kristjuhan A. Extraction of genomic DNA from yeasts for PCR-based applications. Biotechniques. 2011;50:325–8. 45. Gietz RD, Woods RA. Transformation of yeast by lithium
acetate/single-stranded carrier DNA/polyethylene glycol method. Methods Enzymol. 2002;350:87–96.
46. Dower WJ, Miller JF, Ragsdale CW. High efficiency transformation of E. coli by high voltage electroporation. Nucleic Acids Res. 1988;16:6127–45. 47. Entian K-D, Kötter P. 25 yeast genetic strain and plasmid collections.
Methods Microbiol. 2007;36:629–66.
48. Guthrie C, Fink GR. Guide to yeast genetics and molecular biology, vol. 169. San Diego: Academic Press; 1991. p. 933.
49. Santos H, Lamosa P, Borges N. Characterization and quantification of compatible solutes in (hyper)thermophilic microorganisms. Methods Microbiol. 2006;35:173–99.
50. Bradford MM. A rapid and sensitive method for the quantitation of micro-gram quantities of protein utilizing the principle of protein-dye binding. Anal Biochem. 1976;72:248–54.
51. Bergmeyer HU, Gawehn K. Methods of enzymatic analysis, vol. 2. New York: Academic Press; 1974.