MORPHOLOGICAL ATTRIBUTES OF ROOT SYSTEM OF MAIZE GENOTYPES CONTRASTING IN DROUGHT TOLERANCE DUE TO
PHOSPHORUS STRESS
FERNANDO RODRIGO DE OLIVEIRA CANTÃO1, FREDERICO OZANAN MACHADO DURÃES2,
ANTÔNIO CARLOS DE OLIVEIRA2, ÂNGELA MARIA SOARES3 e
PAULO CÉSAR MAGALHÃES2
1Engenheiro Agrônomo, MSc. Em Fisiologia Vegetal, bolsista FAPEMIG Embrapa Milho e Sorgo, CX Postal 151, 35701-970, Sete Lagoas, MG, E-mail: [email protected]
2Engenheiro Agrônomo, PhD pesquisador Embrapa Milho e Sorgo, E-mail: [email protected], [email protected], [email protected]
3Professora PhD, do Departamento de Biologia, setor de Fisiologia Vegetal, Universidade Federal de Lavras, E-mail: [email protected]
Revista Brasileira de Milho e Sorgo, v.7, n.2, p. 113-127, 2008
ABSTRACT – This work was carried out with the objective of evaluating morphological attributes of root system and growth characteristics of root and plant canopy of inbred lines selected for drought tolerance from the Embrapa Maize and Sorghum breeding program. Two drought tolerant and two sensitive inbred lines were seeded in seedling beds with different phosphorus levels (4 and 20 mg.dm-3). The experiment was manually seeded, using 0.20m row spacing and plants 0.20m apart in the line. The experimental plots consisted of four 1.2m long rows with five plants per linear meter. A randomized complete blocks design with three replications was used. Two evaluations of root system morphology using the digital image analysis system WinRHIZO and also evaluations of roots and plant canopy were done at 14 and 21 days after seeding. Significant differences were observed for root morphological attributes and root and canopy growth. Drought tolerant inbred lines showed distinct root system than sensitive, by presenting larger root length, surface area, volume, and greater contribution of roots with diameter less than 0.5 mm to total root length, in plants grown under low phosphorus availability conditions.
Key words: corn, morphological markers, phosphorus, root, WhinRHIZO.
CARACTERISTICAS MORFOLÓGICAS DO SISTEMA RADICULAR DE GENÓTIPOS DE MILHO COM DIFERENTES TOLERÂNCIAS À SECA EM
RESPOSTA A ESTRESSE DE FÓSFORO
RESUMO – Este trabalho foi conduzido com o objetivo de avaliar atributos morfológicos de sistema radicular e características de crescimento da parte aérea de raízes de linhagens endogâmicas de milho pré-selecionadas para tolerância à seca, do programa de melhoramento genético da Embrapa Milho e Sorgo. Foram utilizadas duas linhagens tolerantes e duas sensíveis à seca, em canteiros experimentais
preparados isoladamente para dois níveis de fósforo (4 e 20 mg.dm-3). O experimento foi implantado no espaçamento de 0,20 m entre plantas e 0,20 m entre linhas e as parcelas experimentais foram estabelecidas em quatro linhas de 1,2 m linear e cinco plantas por metro linear. O delineamento experimental utilizado foi o de blocos casualizados, repetidos três vezes. Foram realizadas duas avaliações de morfologia de sistema radicular, com o auxílio do sistema de análise de imagens digitais WinRHIZO e de características de crescimento de raízes e parte aérea, aos 14 e 21 dias após a semeadura. As linhagens tolerantes à seca apresentaram sistema radicular diferenciado das linhagens sensíveis, por apresentarem maior comprimento total, área de superfície, volume e maior contribuição de raízes com diâmetro inferior a 0,5 mm no comprimento total das raízes, em condição de baixa disponibilidade de fósforo.
Palavras-chave: milho, marcadores morfológicos, fósforo, raízes, WinRHIZO. Phosphorus can be considered omnipresent
in all plants because it is involved in almost all of the metabolic processes (Schünmann et al., 2004; Coelho et al., 2006). Its low availability is one of the main reasons for low yield in natural ecosystems as well as in agricultural ones due to the large number of processes in which it takes part (Lynch & Brown, 2001). Plant species differ according to their ability to use nutrients, and many studies have proved this fact to phosphorus (Fidélis et al., 2008). As far as corn is concerned, it is possible that the genetic variability between hybrids and varieties gives it distinct strength and productive potential, which may be responsible for the their capacity to absorb P (Horn, 2006).
In the soil system, absorption of P by the roots is the result of interaction among morpho-physiological characteristics of roots, rhizosphere, and soil characteristics that determine the flow of nutrients to the soil-root interface (Alves, 1998).
The plant’s ability to develop in low phosphorus availability soil has been associated to many factors including morphological and physiological differences as well as differences in root hair density (Hocking et al., 1997).
Among these traits, can be mentioned: length, surface area, diameter, root mass/canopy mass ratio, density, and length of root hairs (Machado, 2000; Brasil, 2003; Brasil et al., 2007; Cantão, 2007).
Thus, the objectives of this paper were to characterize the morphology of the root system, to evaluate the features of canopy and root growth, and to utilize the digital image analysis technology for studying the root system of corn genotypes contrasting in drought tolerance, according to the different phosphorus levels.
Materials and Methods
The experiment was carried out at Embrapa Maize and Sorghum, located in Sete Lagoas, MG, at 19º 28’ S latitude, 44 15’ 08’’ W longitude and 732m altitude. According to Köopen , climate in the region is Aw (savanna climate with dry winter).
Four lines were evaluated, two of them (L 29.1.1 and L 31.2.1.2) being tolerant and the other two (L 14.1.1 and L 2.3.2.1) being sensitive to drought. All have different origins and genetic backgrounds and they belong to the Maize Breeding program for drought
tolerance, of Embrapa Maize and Sorghum. These lines were sowed in experimental plots whose soils were separately prepared with two different phosphorus levels: low (4 mg .dm-3) and high (20 mg.dm-3). The plots were 12.0 m long, 1.2 m wide, and 0.4 m deep, under a 50% mesh screen for protection, in DARK RED LATOSOL medium textured soils.
The special variability of the plots, according to their fertility, was verified through soil analysis, as follows. The experimental plots were divided into six two-meter-long sub-plots from which six simple samples were collected, making up a composite soil sample, which were sent to the Soil Fertility Laboratory of Embrapa Maize and Sorghum for analysis. The results of the soil chemical analysis are in Table 1.
The experiment was manually seeded, being the planting furrow prepared by using a wooden plow with 0.20m spaced blades. The use of this tool was essential for the planting lines to be as even as possible, and also for maintaining equidistant spacing between the plants in the experimental plots. As a result, plants 0.20 m spaced in the planting line and 0.20m row spacing was attained. Experimental units consisted of 20 plants per genotype planted in a 0.8 m² area (four 1.2-linear-meters lines and five plants per linear meter). A randomized blocks design was used, with three replications.
Two evaluations of canopy and root system morphology were performed 14 and 21 days after sowing (DAS), as follows: for each TABLE 1. Soil chemical characteristics (depth 0-20 cm).
P levels pH H+Al Al Ca Mg K P SB CTC V m
(H2O) ---(cmolc dm-³)--- (mg dm-³) (cmolc dm-³)
---(%)---Low P 6.21 4.18 0.18 4.09 0.76 84.00 4.58 5.07 9.24 54.66 3.87
High P 5.61 5.80 0.40 3.19 0.21 82.89 20.67 3.62 9.42 38.42 9.98
evaluation, two plants per plot per replication were collected, adding up to six plants per genotype per evaluation period.
Whole plants were collected (root system and canopy) by removing blocks from the soil using a metal trowel. This procedure was essential to effectively reduce losses in the samples. Soil blocks holding an entire plant (root system and canopy) were immediately transported to the Plant Physiology Laboratory of Embrapa Maize and Sorghum.
The samples were submerged in bowls filled with distilled water, for 30 minutes. This procedure aimed at facilitating the root washing process, which was performed using
water jets, until the seedling root systems were free from any soil particles. In order to avoid losing material during this procedure, a 20 and 60 Mesh sieve set was used.
After washing the root systems, plants were separated into root system (RS) and canopy (PA). Clean roots were then stored in jars containing a 70% ethanol solution, to avoid dehydration.
Evaluated characteristics
a) Canopy dry matter: after weighing the canopy (stem and leaves), the material was stored in paper bags and moved into a forced circulation oven at 72ºC where it remained until
the attainment of constant mass. After drying, the material was weighed in order to determine its dry matter.
b) Root dry matter: after determining the morphological characteristics of the root, the material was stored in paper bags and moved into a forced circulation oven at 72ºC where it remained until the attainment of constant mass. After drying, the material was weighed in order to determine its dry matter.
c) Determining the morphology of the root system: A WinRHIZO Pro 2007a (Régent Instr. Inc.) system was used, connected to a Epson XL 10000 professional scanner equipped with an additional light unit (TPU). A 400 (dpi) resolution was used for measuring roots morphology, as described by Bauhus & Christian (1999), Bouma et al. (2000) and Costa et al. (2002). The roots were arranged in a 20 cm wide and 30 cm long acrylic container, containing approximately 1cm of water. With this device, three dimensional images were acquired and superposition of the roots was avoided; the readings were done in six plants per genotype per period.
The analyses were performed immediately after the images were acquired and the files were saved in TIFF format so that it could later be accessed from an Excel spreadsheet with integrated XLRhizo system. The following root characteristics were determined: total root length (cm), root surface area (cm²), root volume (cm³), mean root diameter (mm), and root length per diameter class (cm). The roots were divided into three classes of diameter, as follows: very thin roots (Ø below 0.5 mm), thin roots (> 0.5 Ø < 2.0 mm), and thick roots (Ø > 2.0 mm). The establishment of these classes was based on the sorting criterion proposed by Bhom (1979).
The data were submitted to analysis of variance (F test) and the means of significant effects were compared by using Scott-Knott test at 5% probability.
Results and Discussion
Dry matter yield
The genotype vs. P level interaction was not significant, indicating that the effect of P was independent of the evaluated genotypes. The yield of root dry matter (RDM), canopy dry matter (CDM), total dry matter (TDM) and root dry matter (R) and canopy (C) ratio (R/C) did not present significant differences between phosphorus levels and genotypes, at 14 DAS (days after sowing) (Table 2).
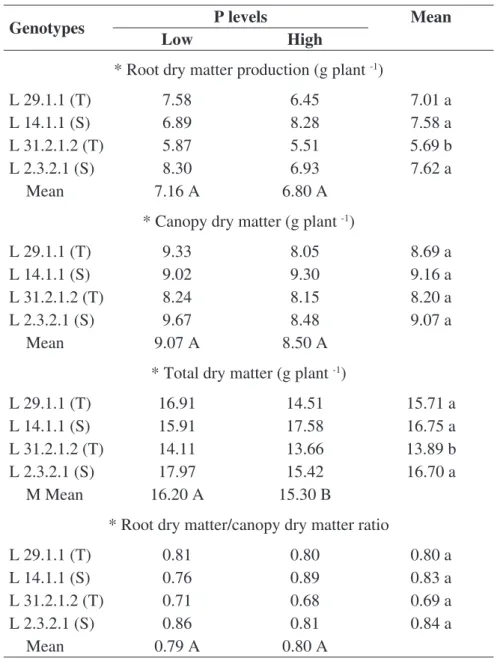
Significant results were observed at 21 DAS, the RDM and TDM characteristics presented significant differences among genotypes. In general, the drought tolerant line L 29.1.1 and the drought sensitive L 14.1.1 and L 2.3.2.1 showed results superior to L 31.2.1.2 drought tolerant (Table 3). The TDM yield differed significantly among genotypes and levels of P. As can be observed from Table 3, under low phosphorus availability conditions, a bigger buildup of TDM was observed.
Tables 2 and 3 also show an increase in the values obtained from the characteristic ratio (R/C), although no significant differences were found between genotypes and P levels, at the different evaluation periods. However, dry matter yield gain was more evident in the root system than in the canopy, thus resulting in increased values for the characteristic R/C.
Many studies have demonstrated this tendency of increase in the MS R/C ratio for several species under P deficiency conditions (Halsted & Lynch, 1996). Brasil (2003),
TABLE 2. Root dry matter production, canopy dry matter, total dry matter and root dry matter/ canopy dry matter ratio of maize genotypes; in response to low level (4 mg dm-3) and high level of P (20 mg dm-3) at 14 DAS.
Genotypes P levels Mean
Low High
* Root dry matter production (g plant -1)
L 29.1.1 (T) 5.71 6.51 6.11 a
L 14.1.1 (S) 6.90 6.61 6.76 a
L 31.2.1.2 (T) 5.25 6.28 5.77 a
L 2.3.2.1 (S) 7.24 7.53 7.39 a
Mean 6.28 A 6.73 A
* Canopy dry matter (g plant -1)
L 29.1.1 (T) 8.86 9.52 9.19 a
L 14.1.1 (S) 8.94 9.58 9.26 a
L 31.2.1.2 (T) 8.17 8.82 8.49 a
L 2.3.2.1 (S) 8.86 8.82 8.84 a
Mean 8.70 A 9.19 A
* Total dry matter (g plant -1)
L 29.1.1 (T) 14.57 16.03 15.30 a
L 14.1.1 (S) 15.84 16.19 16.02 a
L 31.2.1.2 (T) 13.42 15.10 15.10 a
L 2.3.2.1 (S) 16.11 16.36 16.23 a
Mean 14.99 A 15.92 A
* Root dry matter/canopy dry matter ratio
L 29.1.1 (T) 0.64 0.69 0.66 a
L 14.1.1 (S) 0.76 0.69 0.73 a
L 31.2.1.2 (T) 0.64 0.71 0.67 a
L 2.3.2.1 (S) 0.81 0.85 0.83 a
Mean 0.72 A 0.74 A
*Means followed by the same lower case letters in vertical and upper case letters in horizontal did not differ significantly from each other by Scott-Knott test at 5% probability.
TABLE 3. Root dry matter production, canopy dry matter, total dry matter and root dry matter/ canopy dry matter ratio of maize genotypes; in response to low level (4 mg dm-3) and high level of P (20 mg dm-3) at 21 DAS.
Genotypes P levels Mean
Low High
* Root dry matter production (g plant -1)
L 29.1.1 (T) 7.58 6.45 7.01 a
L 14.1.1 (S) 6.89 8.28 7.58 a
L 31.2.1.2 (T) 5.87 5.51 5.69 b
L 2.3.2.1 (S) 8.30 6.93 7.62 a
Mean 7.16 A 6.80 A
* Canopy dry matter (g plant -1)
L 29.1.1 (T) 9.33 8.05 8.69 a
L 14.1.1 (S) 9.02 9.30 9.16 a
L 31.2.1.2 (T) 8.24 8.15 8.20 a
L 2.3.2.1 (S) 9.67 8.48 9.07 a
Mean 9.07 A 8.50 A
* Total dry matter (g plant -1)
L 29.1.1 (T) 16.91 14.51 15.71 a
L 14.1.1 (S) 15.91 17.58 16.75 a
L 31.2.1.2 (T) 14.11 13.66 13.89 b
L 2.3.2.1 (S) 17.97 15.42 16.70 a
M Mean 16.20 A 15.30 B
* Root dry matter/canopy dry matter ratio
L 29.1.1 (T) 0.81 0.80 0.80 a
L 14.1.1 (S) 0.76 0.89 0.83 a
L 31.2.1.2 (T) 0.71 0.68 0.69 a
L 2.3.2.1 (S) 0.86 0.81 0.84 a
Mean 0.79 A 0.80 A
* Means followed by the same lower case letters in vertical and upper case letters in horizontal did not differ significantly from each other by Scott-Knott test at 5% probability, S: sensitive to drought, T: tolerant to drought.
working with hybrids and contrasting lines for use and P use efficiency, observed significant differences for the yield of RDM and TDM characteristics for the mean of the evaluated genotypes.
According to Clarkson et al. (1985), some nutrients limit the plants growth, especially N and P, causing modifications in the source-sink relations, turning the roots into the preferred sink and the products from the photosynthesis are directed to promoting the formation and development of the root system, aiming at increasing nutrient absorption area, what might explain the increase in the RDM production. These results strengthen the hypothesis that the primary effects from P deficiency are related to alterations in the roots characteristics, which include modifications in the radicular architecture (Lynch & Brown, 2001), in the ramification pattern (Borch et al., 1999; López-Bacio et al., 2002), in the total root growth, and in the stretching of root hairs (Lynch, 1998; López-Bacio et al., 2002).
Total length, surface area, mean diameter, and root volume
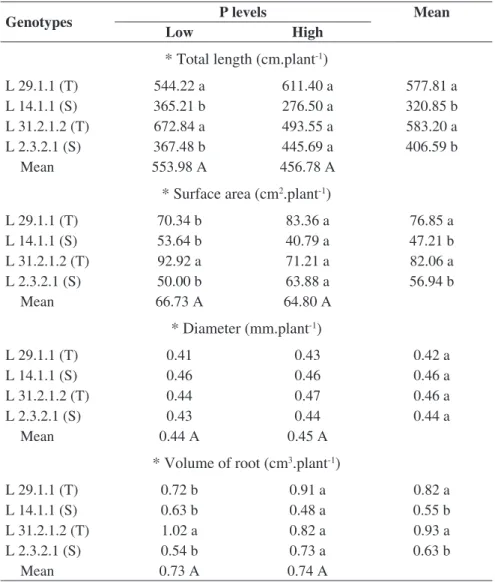
Total length (TRL), surface area (RSA), mean diameter (RAD), and root volume (RV) did not present significant differences among P-stressed genotypes, at 14 DAS. However, significant differences among genotypes were observed, considering plants developed in the highest P level. In general, the drought tolerant lines L 29.1.1 and L 31.2.1.2 presented the highest levels of TRL, RSA, and RV, in comparison to the sensitive lines (Table 4).
One possible explanation for these results lies in the fact that at 14 DAS the seedlings are still being nourished by the P reserves, originating from the seed endosperm; this is demonstrated by the results from observations
at 21 DAS (Table 5). The drought tolerant lines L 29.1.1 and L 31.2.1.2 present the highest levels for RTL, RSA, and RV characteristics. These results indicate that these lines could be more efficient in the acquisition of nutrients, since plants with a bigger root system have an increased capacity to absorbing nutrients that are less mobile in the soil, like P (Brasil et al., 2007). These results are similar to the obtained by Schachtman et al. (1998), who considered surface area and root length the main characteristics responsible for P use efficiency, once this nutrient has low mobility in the soil and is transported by means of diffusion (Horst et al., 2001). Thus, by absorbing this nutrient, the plant is contributing to a spatial heterogeneity, which, later, makes its absorption harder (Lynch & Brown, 2001).
The increase of the root system characteristics in response to low P availability has been frequently observed in several plant species (Föhse et al., 1988; Machado et al., 2001) and it strengthens the hypothesis that the roots become preferential drains of photoassimilates when some nutrients are limiting factors to plant growth, especially P and N. This might be an adaptation strategy developed in order to increase absorption efficiency when these nutrients are limited (Horst et al., 2001).
According to Parentoni et al. (1999), corn genotypes that are inefficient in the use of P when cultivated in nutritive solution with omission of this element do not present any differences in the root system morphology, while the efficient ones increased root mass and length under low P availability.
It is important to point out that the studies of root systems under field conditions present certain limitations that, often times, can result
TABLE 4. Total length, surface area, diameter and mean volume of maize root genotypes in response to low level (4 mg.dm-3) and high level of P at 14 DAS.
Genotypes P levels Mean
Low High
* Total length (cm.plant-1)
L 29.1.1 (T) 477.04 a 548.43 a 512.73 a L 14.1.1 (S) 339.00 a 339.87 b 339.43 b L 31.2.1.2 (T) 378.32 a 451.01 a 414.66 a L 2.3.2.1 (S) 275.71 a 548.43 b 293.80 b
Mean 367.51 A 471.93 A
* Surface area (cm2.plant-1)
L 29.1.1 (T) 58.40 a 66.12 a 62.26 a L 14.1.1 (S) 43.21 a 42.14 b 42.67 b L 31.2.1.2 (T) 52.32 a 59.65 a 55.99 a L 2.3.2.1 (S) 35.44 a 38.22 b 36.83 b Mean 43.34 A 51.53 A * Diameter (mm.plant-1) L 29.1.1 (T) 0.39 0.51 0.45 a L 14.1.1 (S) 0.40 0.39 0.39 a L 31.2.1.2 (T) 0.43 0.41 0.42 a L 2.3.2.1 (S) 0.41 0.39 0.40 a Mean 0.40 A 0.43 A
* Root Volume (cm3.plant-1)
L 29.1.1 (T) 0.57 a 0.63 a 0.60 a
L 14.1.1 (S) 0.44 a 0.41 b 0.42 b
L 31.2.1.2 (T) 0.57 a 0.63 a 0.60 a
L 2.3.2.1 (S) 0.36 a 0.37 b 0.37 b
Mean 0.48 A 0.51 A
* Means followed by the same lower case letters in vertical and upper case letters in horizontal did not differ significantly from each other by Scott-Knott test at 5% probability, S: sensitive to drought, T: tolerant to drought.
TABLE 5. Total length, surface area, diameter and mean volume of maize root genotypes in response to low level (4 mg dm-3) and high level of P at 21 DAS.
Genotypes P levels Mean
Low High
* Total length (cm.plant-1)
L 29.1.1 (T) 544.22 a 611.40 a 577.81 a
L 14.1.1 (S) 365.21 b 276.50 a 320.85 b
L 31.2.1.2 (T) 672.84 a 493.55 a 583.20 a
L 2.3.2.1 (S) 367.48 b 445.69 a 406.59 b
Mean 553.98 A 456.78 A
* Surface area (cm2.plant-1)
L 29.1.1 (T) 70.34 b 83.36 a 76.85 a L 14.1.1 (S) 53.64 b 40.79 a 47.21 b L 31.2.1.2 (T) 92.92 a 71.21 a 82.06 a L 2.3.2.1 (S) 50.00 b 63.88 a 56.94 b Mean 66.73 A 64.80 A * Diameter (mm.plant-1) L 29.1.1 (T) 0.41 0.43 0.42 a L 14.1.1 (S) 0.46 0.46 0.46 a L 31.2.1.2 (T) 0.44 0.47 0.46 a L 2.3.2.1 (S) 0.43 0.44 0.44 a Mean 0.44 A 0.45 A
* Volume of root (cm3.plant-1)
L 29.1.1 (T) 0.72 b 0.91 a 0.82 a
L 14.1.1 (S) 0.63 b 0.48 a 0.55 b
L 31.2.1.2 (T) 1.02 a 0.82 a 0.93 a
L 2.3.2.1 (S) 0.54 b 0.73 a 0.63 b
Mean 0.73 A 0.74 A
* Means followed by the same lower case letters in vertical and upper case letters in horizontal did not differ significantly from each other by Scott-Knott test at 5% probability, S: sensitive to drought, T: tolerant to drought.
in high variation levels. This was particularly observed by Pagotto (2001), in a study with tropical grass plants under field conditions. Thus, studying the root through digital image analysis becomes a promising technology since it allowed determining the differential growth of the root system of corn genotypes in their early phase of development, and with low variation levels.
Root length per diameter class
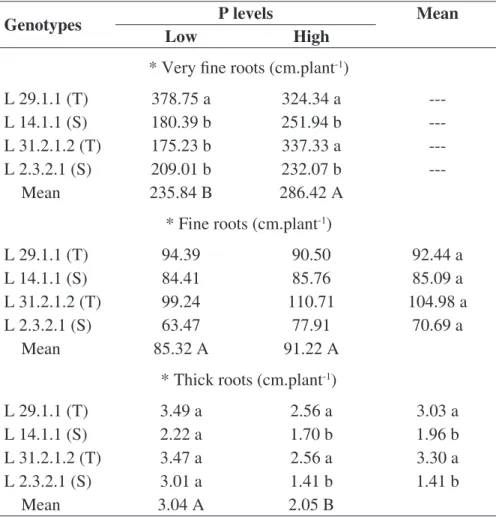
Using the WinRhizo digital image analysis system allowed for a categorization of the root system length, according to diameter class. Differences among lengths of very thin, thin, and thick roots were observed from 14 DAS. In this evaluation, the genotype and P level interaction was significant to the very thin roots characteristic, indicating that the effect of the P level was dependent on the considered genotypes and on the evaluation period (Table 6).
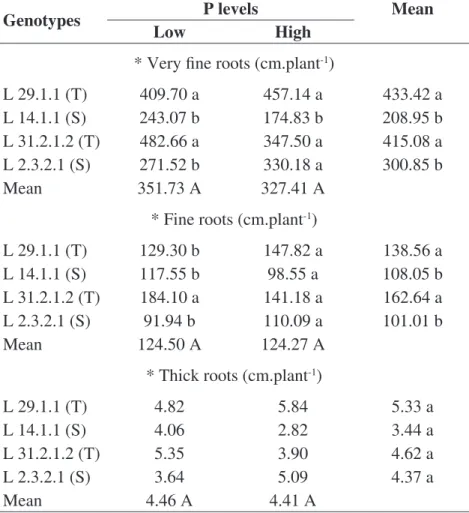
In general, the drought tolerant lines L 29.1.1 and L 31.2.1.2 presented the highest root length at 21 DAS in the very thin and thin diameter classes (Table 7). The differential behavior demonstrated by the drought tolerant genotypes might be an indication that these materials are more efficient in P acquisition, since plants with a root system comprised by smaller diameter roots have a larger surface area, which might increase the absorption of nutrients with low soil mobility, such as P.
Roselem et al. (1994) observed that a corn genotype with elevated efficiency in the acquisition and use of soil nutrients presented a larger proportion of thin roots. Schenk & Barber (1980) suggested that the formation of thinner and longer roots is a mechanism that plants use to increase nutrient absorption surface area.
According to Nielsen & Barber (1978), in addition to improvements in the absorption
characteristics, thinner root systems have an architecture that is more favorable to the absorption of nutrients with low soil mobility. Clarkson & Hanson (1980), believe that, in general, a root system with a large number of ramifications and comprised of roots with smaller diameter would be more effective in the absorption of nutrients.
Costa et al. (2002), while working with three different corn genotypes contrasting in canopy architecture and system morphology characteristics, observed that the biggest contribution for the total root length came from roots with diameter classes between 0.2 and 0.4 mm. These results are in agreement with other results reported for corn crop. Pallant et al. (1993) reported that 70% of the roots belong to the very thin roots class (diameter lower than 0.5 mm).
The biggest contribution to the length of roots with a diameter smaller than 0.5 mm, to a same mass value, associated to the improvement in the absorption kinetics, has been believed to be a strategy that the plant uses, in low P availability conditions, allowing for an increase of the root surface area and favoring the increase of the efficiency in the absorption of nutrients with low soil mobility, such as P (Brasil, 2003).
Conclusions
Corn genotypes that are tolerant and sensitive to drought, cultivated under different P levels, showed alterations in root morphological attributes and in growth characteristics of roots and canopy. In general, the drought tolerant pre-selected lines presented more developed root systems compared to the sensitive lines, indicating that these materials, when selected
Genotypes P levels Mean
Low High
* Very fine roots (cm.plant-1)
L 29.1.1 (T) 378.75 a 324.34 a
---L 14.1.1 (S) 180.39 b 251.94 b ---
L 31.2.1.2 (T) 175.23 b 337.33 a
---L 2.3.2.1 (S) 209.01 b 232.07 b
---Mean 235.84 B 286.42 A
* Fine roots (cm.plant-1)
L 29.1.1 (T) 94.39 90.50 92.44 a
L 14.1.1 (S) 84.41 85.76 85.09 a
L 31.2.1.2 (T) 99.24 110.71 104.98 a
L 2.3.2.1 (S) 63.47 77.91 70.69 a
Mean 85.32 A 91.22 A
* Thick roots (cm.plant-1)
L 29.1.1 (T) 3.49 a 2.56 a 3.03 a
L 14.1.1 (S) 2.22 a 1.70 b 1.96 b
L 31.2.1.2 (T) 3.47 a 2.56 a 3.30 a
L 2.3.2.1 (S) 3.01 a 1.41 b 1.41 b
Mean 3.04 A 2.05 B
TABLE 6. Root length by diameter classes, very fine roots (Ø < 0,5 mm), fine roots (> 0,5 Ø < 2,0 mm), thick roots (Ø > 2,0 mm) of maize genotypes in response to low level (4 mg dm-3) and high level of P at 14 DAS.
* Means followed by the same lower case letters in vertical and upper case letters in horizontal did not differ significantly from each other by Scott-Knott test at 5% probability, S: sensitive to drought, T: tolerant to drought.
according to water use efficiency, are indirectly selected for efficiency in the use of P.
The technical analysis of digital images of the root systems allowed for differentiation
of corn genotypes contrasting in drought tolerance, in response to different P levels, with the most significant results being observed at 21 DAS.
TABLE 7. Root length by diameter classes, very fine roots (Ø < 0,5 mm), fine root (> 0,5 Ø <
2,0 mm), thick roots (Ø > 2,0 mm) of maize genotypes in response to low level (4 mg dm
-3) and
high level of P at 21 DAS.
Genotypes P levels Mean
Low High
* Very fine roots (cm.plant-1)
L 29.1.1 (T) 409.70 a 457.14 a 433.42 a L 14.1.1 (S) 243.07 b 174.83 b 208.95 b L 31.2.1.2 (T) 482.66 a 347.50 a 415.08 a L 2.3.2.1 (S) 271.52 b 330.18 a 300.85 b
Mean 351.73 A 327.41 A
* Fine roots (cm.plant-1)
L 29.1.1 (T) 129.30 b 147.82 a 138.56 a L 14.1.1 (S) 117.55 b 98.55 a 108.05 b L 31.2.1.2 (T) 184.10 a 141.18 a 162.64 a L 2.3.2.1 (S) 91.94 b 110.09 a 101.01 b
Mean 124.50 A 124.27 A
* Thick roots (cm.plant-1)
L 29.1.1 (T) 4.82 5.84 5.33 a
L 14.1.1 (S) 4.06 2.82 3.44 a
L 31.2.1.2 (T) 5.35 3.90 4.62 a
L 2.3.2.1 (S) 3.64 5.09 4.37 a
Mean 4.46 A 4.41 A
* Means followed by the same lower case letters in vertical and upper case letters in horizontal did not differ significantly from each other by Scott-Knott test at 5% probability, S: sensitive to drought, T: tolerant to drought.
References
ALVES, V. M. C.; NOVAIS, R. F.; OLIVEIRA, M. F. G.; SANT’ANNA, R. Cinética e translocação de fósforo em híbridos de milho. Pesquisa Agropecuária Brasileira, Brasília, DF, v. 33, n. 7, p. 10-47-52, jul. 1998.
BAUHUS, J.; CHRISTIAN MESSIER. Evaluation of Fine Root Length and Diameter Measurements Obtained Using WinRhizo Image Analysis. Agronomy Journal, Madison, v. 91, n. 1, p. 142-147, Jan./Feb. 1999.
BOHM, W. Methods of studying root systems. New York: Springer-Verlag, 1979. 189 p.
BORCH, K.; BOUMA, T. J.; LYNCH, J. P.; BROWN, K. M. Ethylene: Aregulator of root architecture response to soil phosphorus availability. Plant Cell and Enviroment, Oxford, v. 22, n. 4, p. 425-431, Apr. 1999. BOUMA, T. J.; NIELSON, K. L.; KOUTSTAAL, B. A. S. Sample preparation and scanning protocol for computerised analysis of root length and diameter. Plant and Soil, Dordrecht, v. 218, p. 185-196, 2000.
BRASIL, E. C. Mecanismos envolvidos na eficiência de aquisição de fósforo em genótipos de milho. 2003. 161 F. Tese (Doutorado em Solos e Nutrição de Plantas) - Universidade Federal de Lavras, Lavras, MG.
BRASIL, E. C.; ALVES, V. M. C.; MARRIEL, I. E.; PITTA, G. V. E.; CARVALHO, J. G. Matéria seca e acúmulo de nutrientes em genótipos de milho contrastantes quanto a aquisição de fósforo. Ciência e Agrotecnologia, Lavras, v. 31, n.3, p. 704-712, maio/jun. 2007. CLARKSON, D. T. Factors affecting mineral nutrient acquisiton by plants. Annual Review of Plant Physiology, Palo Alto, v. 36, p. 77-115, 1985.
CLARCKSON, D. T.; HANSON, J. B. The mineral nutrition of higher plants. Annual Review of Plant Physiology, Palo Alto, v. 3, p. 239-298, 1980.
COELHO, G. T. C. P.; SOUZA, I. R. P.; CARNEIRO, N. P.; SCHAFFERT, R. E.; BRANDÃO, R. L.; ALVES,V. M. C.; PAIVA, L. V.; CARNEIRO, A. A. Formação de
arênquima em raízes de milho sob estresse de fósforo. Revista Brasileira de Milho e Sorgo, Sete Lagoas, v. 5, n. 3, p. 443-449, 2006. COSTA, C.; DWYER, L. M.; ZHOU, X.; DUTILLEUL, P.; HAMEL, C.; REID, L. M.; SMITH, D. L. Root morphology of contrasting maize genotypes. Agronomy Journal, Madison, v. 94, n. 1, p. 96-101, Jan./Feb. 2002.
FERNANDES, C. Eficiência de diferentes culturas e híbridos de milho quanto à utilização de fósforo em solos do cerrado. 2001. 51 f. Dissertação (Mestrado em Solos e Nutrição de Plantas) - Escola Superior de Agricultura “Luiz de Queiroz”, Universidade de São Paulo, Piracicaba.
FIDÉLIS, R. R.; AFFERRI, F. S.; PELUZIO, J. M.; SANTOS, G. R.; LEMUS, E. A. E. Classificação de populações de milho quanto a eficiência e resposta ao uso de fósforo em solos naturais de cerrado. Bioscience Journal, Uberlândia, v. 24, n.3, p. 39-45, July/Sept. 2008.
FÖHSE, D.; CLAASSEN, N.; JUNGK, A. Phosphorus efficiency of plants. I External and internal P requeriment and uptake efficiency of different plants species. Plant and Soil, Dordrecht, v. 110, n. 1, p. 101-109, Aug. 1988.
HALSTED, M.; LYNCH, J. Phosphorus responses of C3 and C4 species. Journal of Experimental Botany, Oxford, v. 47, n. 297, p. 497-505, Apr. 1996.
HOCHING, P. J.; KEERTHISINGLE, G G., SMITH, F. W., RANDALL, P. J. Comparation
of the ability of different crop species to acess poorly-available soil phosphorus. In: TANDO, T.; FUJITA, K.; MAE, T.; MATSUMOTO, H.; MORI, S.; SEKIYA, J. (Ed.). Plant nutrition for sustainable food. production and environment. Dordrecht: Kluwer Academic, 1997. p. 365-308.
HORN, D.; ERNANI, P. R.; SANGOI, L.; SCHWATZER.; CASSOL, P. C. Parâmetros cinéticos e morfológicos da absorção de nutrientes em cultivares de milho com variabilidade genética contrastante. Revista Brasileira de Ciência do Solo, Viçosa, v. 30, n. 1, p. 77-85, jan./fev. 2006.
HORST, W. J.; KAMH, M.; JIBRIN, J. M.; CHUDE, V. O. Agronomic measurements for increasing P availability to crops. Plant and Soil, Dordrecht, v. 237, n. 2, p. 211-233, Dec. 2001.
LYNCH, J. P. The role of nutrient efficient crops in modern agriculture. Journal Crop of production, Binghamton, v. 1, p. 241-264, 1998.
LYNCH, J. P.; BROWN, K. M. Topsoil foraging: an architectural adaptation to low phosphorus availability. Plant and Soil, Dordrecht, v. 237, n. 2, p. 225-237, Dec. 2001.
MACHADO, C. T. de T. Caracterização de genótipos de milho quanto a parâmetros morfológicos, fisiológicos e microbiológicos associados à eficiência de absorção e uso de fósforo. 2000. 362 f. Tese (Doutorado em Ciência do Solo) – Universidade Federal Rural do Rio de Janeiro, Seropédica.
MACHADO, C. T. de T.; FURLANI, A. M. C.; MACHADO, A. T. Índices de eficiência de variedades locais e melhoradas de milho ao fósforo. Bragantia, Campinas, v. 60, n. 3, p. 225-238, 2001.
NIELSEN, K. L.; MILLER, C. R.; BECK, D.; LYNCK, J. P. Fractal geometry of root system: Field observations of contrasting genotype of common bean (Phaseolus vulgaris) grown under different phosphorus regimes. Plant and Soil, Dordrecht, v. 206, n. 2, p. 181-190, 1998. ROSOLEN, C. A.; ASSIS, J. S.; SANTIAGO, A. D. Root grown and mineral nutrition of corn. Comunication in Soil Science and Planta Analysis, New York, v. 25, n. 13-14, p. 2491-2499, 1994.
SCHACHTMAN, D. P.; REID, R. J.; AYLING, S. M. Phosphourus uptake by plants: from soil to cell. Plant Physiology, Rockville, v. 116, n. 2, p. 147-153, Feb. 1998.
SCHÜNMANN, P. H. D.; RICHARDSON, A. E.; VICKERS, C. E.; DELHAIZE, E. Promoter analysis of the barley pht1;1 phosphate transporter gene identifies regions controlling root expression and responsiveness to phosphate deprivation. Plant Physiology, Bethesda, v. 136, n. 4, p. 4205-4214, 2004.
SHENK, N. K.; BARBER, S. A. Potassium and phosphorus uptake by corn genotypes growth in the field as influenced by root characteristics. Plant and Soil, Dordrecht, v. 54, n. 1, p. 65-76, 1980.
PAGOTTO, D. S. Comportamento do sistema radicular do capim tanzânia (Panicum
maximum, Jacq) sob irrigação e submetido a diferentes intensidades de pastejo. 2001. 51 f. Dissertação (Mestrado) Escola Superior de Agricultura “Luiz de Queiroz”, Universidade de São Paulo, Piracicaba.
PALLANT, E.; HOLMGREN, R. A.; SCHULER, G. E.; MCCRAKEN, K. L.; DRBAL, B. Using a fine root extraction device to quantify small diameter maize root (0,025 mm) in field soils. Plant and Soil, Dordrecht, v. 153, p. 273-279, 1993.
PARENTONI, S. N.; GAMA, E. E. G.; SANTOS, M. X.; LOPES, M. A.; ALVES, V. M. C.;
BAHIA FILHO, A. F. C.; VASCONCELLOS,
C. A.; MAGNAVACA, R.; PACHECO, C. A. P.; MEIRELLES, W. F.; GUIMARÃES, P. E. O.; SILVA, A. E.; NASPOLINI FILHO, W.; MORO, J. R.; VIANA, R. T.; PITTA, G. V. E.; FRANCA, G. E.; PURCINO, A. A. C.; SOUZA, I. R. P.; ARRIEL, I. E.; MACHADO, A. T.; CORREA, L. A.; OLIVEIRA, A. C.; PAIVA, E. Adaptação de milho a solos ácidos: Tolerância à toxidez de alumínio e eficiência no uso de nutrientes no programa de pesquisa da EMBRAPA - Milho e Sorgo. In: REUNION LATINOAMERICANA DEL MAIZ, 18., 1999, Sete Lagoas. Memórias... Sete Lagoas: Embrapa Milho e Sorgo; México: CIMMYT, 1999. p. 179-199.