Ana Teresa Tavares de Lima e Crujeira
Diploma in Chemical EngineeringInstituto Superior Técnico
Identification of atmospheric pollutants
control mechanisms during co-combustion of
coal and non-toxic wastes
Doctoral dissertation for Ph.D. degree in Sustainable Chemistry
Supervisor Prof. Isabel Maria Palma Aleixo Cabrita, LNEG, I.P. Co-Supervisors: Prof. Ibrahim Kadri Gülyurtlu, LNEG, I.P.
Prof. Manuel Luís Magalhães Nunes da Ponte, REQUIMTE, FCT/UNL
Jury:
President: Prof. Maria Adelaide de Almeida Pedro de Jesus, FCT/UNL Examiners: Prof. Carlos Alberto Diogo Soares Borrego, Aveiro University
Prof. Maria Arminda Costa Alves, Engineering Faculty of Oporto University Members: Prof. Francisco Manuel da Silva Lemos
Prof. José Carlos Fernandes Teixeira, Minho University Prof. Isabel Maria Palma Aleixo Cabrita, LNEG, I.P. Prof. Ibrahim Kadri Gülyurtlu, LNEG, I.P.
Prof. Manuel Luís Magalhães Nunes da Ponte, REQUIMTE, FCT/UNL
Title: Identification of atmospheric pollutants control mechanisms during co-combustion of coal and
non-toxic wastes
Author: Ana Teresa Tavares de Lima e Crujeira
Copyright © A Faculdade de Ciências e Tecnologia e a Universidade Nova de Lisboa têm o direito, perpétuo
e sem limites geográficos, de arquivar e publicar esta dissertação através de exemplares impressos reproduzidos em papel ou de forma digital, ou por qualquer outro meio conhecido ou que venha a ser inventado, e de a divulgar através de repositórios científicos e de admitir a sua cópia e distribuição com objectivos educacionais ou de investigação, não comerciais, desde que seja dado crédito ao autor e editor.
To the memory of my father, Fernando Amante Crujeira. To my dear daughter, Ana Leonor Crujeira da Silva Curto.
Acknowledgments
To Prof. Isabel Cabrita, Supervisor of this Thesis, for the constant stimulus and confidence in all these years, for the encouragement to achieve this goal and for helping me to reach it, as well as for the orientation, discussions and exchange of ideas while developing this Dissertation.
To Prof. Ibrahim Gulyurtlu, co-Supervisor of this Thesis, for the orientation and opportunity given to me to achieve my Ph.D. as a result of the COPOWER Project, a 6th Framework Project of the European Commission under his coordination in which I had the privilege of participating, and also by the valuable and rich discussions within the area of fluidised bed technology and pollutants emissions.
To Prof. Nunes da Ponte, coordinator of the 1st Portuguese Doctoral Programme in Sustainable Chemistry, to which this thesis was submitted, and co-Supervisor of this Thesis, for the orientation and the support namely related to the modelling work.
To Prof. Luís Moreira, for the advice and support given with the statistical treatment of the results and Prof. Susana Piçarra Gonçalves for the help with the thermodynamic calculations.
To the COPOWER project colleagues M. Helena Lopes, Pedro Abelha, and David Salema, for the excellent team spirit achieved along the project development and a special thanks to M. Helena Lopes for the constant stimulus and scientific discussion.
Ackowledgements
To INETI (today the National Laboratory of Energy and Geology - LNEG), for the possibility of developing the experimental work and framework, which allowed me to get valuable knowledge in several domains.
To the Head of Department of INETI and Heads of Unit of LNEG and the Director of LEN, in LNEG, for the conditions given for the development and writing of this Thesis.
To Ricardo Rodrigues (IDAD) and to Pedro Antunes (APA), for the helpful discussions and suggestions while implementing and validating PCCD/F sampling methodology.
To all the DEECA/UEZ colleagues and ex-colleagues, for the encouragement and good company in this long way.
To Paulo Torres Martins and Sandra Espadana, for assuring me the conditions that enabled me to achieve this goal.
To my parents, for the extraordinary education provided and to my mother, for her constant support in the raising of my daughter and to be always available for everything. As well as to my sisters Ana Margarida, Ana Rita e Ana Sofia, and my brother-in-law Jorge, and my nieces Caetana and Ana Pilar, for the permanent enthusiasm, joy and for sharing with me this journey through life.
To my mother‘s mother, Maria Otília, the first woman in the family to achieve a higher education degree, for my not being so present to assist her as much as she would like at her 96 years old; and also to my other ―grand-mother‖ Ti Juca, also with 96 years old, for the constant enthusiasm in witnessing this Thesis conclusion.
To all my Girl Guide friends, both from Portugal and Japan and São Tomé e Princípice, with whom I lived unforgetable adventures that enriched me and upgraded my individual formation.
To Maria Elvira, Dapakara Karunaratne, Tatiana Diall, Paulo Curto, Helder Curto, Custódia Curto, Carlos Franco and Pedro Azevedo, for their friendship.
To ´João Seabra e Barros, for the remarkable teachings on QA/QC and metrology, who took me to IPAC, the Portuguese accreditation body.
Acknowledgments
To IPAC for the opportunity of enlarging my sights by auditing stack-gas emissions Laboratories and also for the comprehension along the last months of this thesis writing.
To Alexandra Passos Silva (IDAD) for the uncountless talks about sampling stack-gas emissions.
To Manuela Jogo, for the helpful discussions on uncertainties.
To all my friends, who supported and encouraged me and understood my absences.
To Sérgio, for his unlimited patience and support while writing this Thesis.
Abstract
The use of renewable energy sources (RES) for energy will contribute to meet the targets set up by the commitments of the Portuguese State with the European Union (EU) in energy and climate change combat policies. The reduction of CO2 emissions is the primary goal when partially replacing coal with RES of biomass origin, but could also lead to the reduction of other pollutant emissions. At the same time, this particular renewable resource (pRES), i.e. biomass, could be mixed with coal, reducing the amount of fossil fuel used and due to positive synergies arising from the introduction of different amounts of volatile matter, ash, sulphur, calcium, chlorine, and heavy metals that react, may contribute to lower levels of certain emissions bringing environmental advantages.The option for the co-combustion of coal with biomass type of fuel using fluidised bed technology presents some advantages related to the control of operation conditions, energetically and also towards lower levels of certain emissions, which could contribute to the fulfilment of the EU objectives in terms of environmental protection and sustainable energy production.
The aim of this work was the identification of the controlling mechanisms for the formation of pollutants and their subsequent destruction, during co-combustion of coal with biomass or non-toxic wastes, in a fluidised bed pilot unit. Different combinations of fuels were burned with the aim of identifying the main parameters that will lead to minimising the level of emissions, including CO2, through the application of the principles of sustainable chemistry.
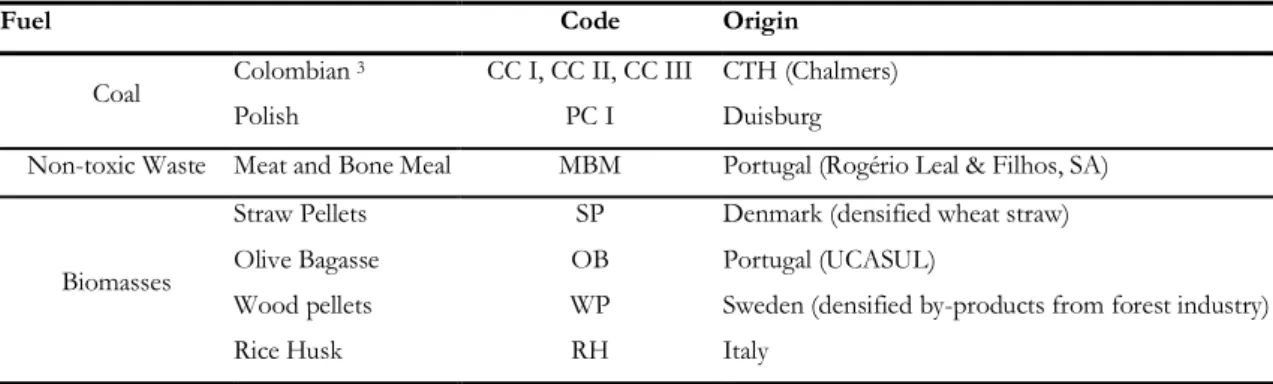
Two different bituminous coals were used as the base fossil fuel, a Colombian and a Polish coal. The coals were partly replaced by different pRES (straw and olive cake) and a non-toxic waste (Meat and Bone Meal). Rice husk was also tested as a renewable energy source.
Emissions of particulate matter, CO, SO2, NOX, heavy metals (HM), Cl, and dioxins and furans (PCDD/F) were evaluated, comparing the values obtained with different fuels compositions, i.e. different contents of volatile matter, ash, Cl, S, Ca, and HM.
Abstract
Special attention was given to emissions of PCCD/F compounds, both in the gas and solid phases. It was also studied the catalytic effect of Cu and the fly ash particle size distribution in these emissions.
It was observed that, in general, the emissions resulting from biomass combustion were lower than those observed for conventional fossil fuels. In addition, most of the combustion of pRES occurred in the gas phase, which is believed to be due to the release of volatiles, which constitute about 70% of the fuel mass.
It was possible to establish a diagram for prediction of SO2 and HCl emissions simply by the knowledge of Ca, S and Cl fuel content. Separate equations were obtained for two ranges of S-Fuel (%, d.b.) - < 0.15 and > 0.15 – and for two ranges of Cl-fuel (%, d.b.) - < 0.03 and > 0.03.
A statistical analysis by standard multiple linear regressions (MLR) was performed, using the Data Analysis add-in, available in Microsoft Excel, as well as a statistical validation test to ensure the reliability of the model. It was possible to identify a relation between the total PCDD/F formed and the chlorine and sulphur content of the fuels:
y(D+F)Total α xCl /xS2.5
When the PCDD/F data was disaggregated by the different streams, i.e. 1st Cyclone, 2nd Cyclone and Stack gas, two relations were found:
a) The stack-gas PCDD/F emissions were correlated with the Ca, S and Cl content of the fuel by the following general relation:
y(D+F)Stack-gas α
n
Ca/(n
S+ n
Cl)/x
S*x
ClThe reproductibility of the results between the two installations were confirmed.
b) The PCDD/F in the 1st and 2nd Cyclones was correlated within each series of tests, by the following relation:
y(D+F)Cyclones α Cuash*Clash%Cash*T/d50
where Cuash and Clash are the Cu and Cl contents in the cyclone ashes, T is the Cyclone temperature and d50 is the mean diameter of the fly ash.
It was also possible to find a condition, for which PCDD/F emissions in a fluidized bed combustor are lower than the Emission Limit Value (ELV), when S>0.15% (d.b.) and Cl > 0.03% (d.b.):
Abstract
Finally, it was also developed a kinetic model, the FB-OWL model, to estimate possible PCDD/F emissions from the co-combustion of renewable fuels mixed with coal in fluidized bed through precursors and de novo mechanisms.
Key-words: Co-combustion, Fluidised bed, Emissions, PCDD/F, Non-toxic wastes, Renewable energy sources.
Resumo (Abstract in Portuguese)
A utilização de fontes de energia renovável (FER) contribuirá para atingir os compromissos de Portugal com a União Europeia (UE) em termos de políticas de energia e de alterações climáticas. A substituição de carvão por FER de origem biomássica tem por principal objectivo a redução das emissões de CO2, podendo também levar à redução de outras emissões poluentes. Simultaneamente, estas fontes de energia de origem renovável em particular (FERp), como a biomassa, pode ser misturada com carvão, reduzindo a quantidade de fonte fóssil e, dadas as sinergias positivas que resultam da introdução de diferentes quantidades de material volátil, cinzas, enxofre, cálcio, cloro e metais pesados, terá vantagens também relativamente às emissões de poluentes.A opção pela tecnologia de leito fluidizado para a co-combustão de carvão com combustíveis de origem biomássica poderá contribuir para um melhor controlo de operação tanto energeticamente como no que se refere ao controlo de emissões poluentes e, assim, contribuir para o cumprimento dos objectivos da UE em termos de protecção ambiental e produção sustentável de energia.
O objectivo deste trabalho foi a identificação de mecanismos de controlo da formação de poluentes e a sua subsequente destruição durante a co-combustão de carvão com biomassa ou resíduos não-tóxicos, numa unidade piloto de leito fluidizado. Foram testadas diferentes combinações de combustíveis, procurando determinar os parâmetros fundamentais para minimizar o nível de emissões produzidas, incluindo o CO2, aplicando os princípios da química sustentável.
Dois carvões betuminosos diferentes foram utilizados como combustível de base, um carvão Colombiano e um carvão Polaco.
Resumo (Abstract in Portuguese)
Os carvões foram parcialmente substituídos por diferentes FERp (palha e bagaço de azeitona) e resíduos não-tóxicos (farinha de carne). Foi também testada a casca de arroz, uma fonte de energia de origem renovável.As emissões de partículas, CO, SO2, NOX, Metais Pesados (MP), Cl e Dioxinas e Furanos (PCDD/F) foram avaliadas, comparando os valores obtidos para as diferentes composições dos combustíveis, isto é, diferentes teores introduzidos em material volátil, cinzas, Cl, S, Ca, e MP.
Foi dada especial atenção às emissões de PCDD/F, quer na fase sólida quer na fase gasosa; foi também avaliado o possível efeito catalítico do cobre e da distribuição granulométrica das partículas nessas emissões.
Foi possível desenhar um diagrama para prever as emissões de SO2 e HCl simplesmente através do conhecimento dos teores em Ca, S e Cl no combustível. Foram obtidas diferentes equações para duas gamas de teores em S-Fuel (%, d.b.), <0,15 e >0,15, e duas gamas para Cl-fuel (%, d.b.), < 0,03 e > 0,03.
Realizou-se uma análise estatística por regressão linear múltipla, assim como teste de validação estatística por forma a assegurar a confiança no modelo. Foi possível identificar uma correlação entre a quantidade total de PCDD/F formados e os teores em cloro e enxofre no combustível:
y(D+F)Total α xCl /xS2,5
Quando os dados foram desagregados pelos diferentes fluxos, isto é, 1º Ciclone, 2º Ciclone e Emissões Gasosas, encontraram-se duas relações:
a) As emissões de PCDD/F estavam correlacionadas com os teores em Ca, S e Cl do combustível através da seguinte relação geral:
y(D+F)Efluentes Gasosos α
n
Ca/(n
S+ n
Cl)/x
S*x
ClFoi ainda verificada a reproductibilidade dos resultados obtidos em ambas as instalações. b) Os teores de PCDD/F nos 1º e 2º Ciclones estavam correlacionados entre si para cada série de testes através da seguinte relação:
y(D+F)Cyclones α Cuash*Clash%Cash*T/d50
onde Cuash e Clash são os teores em Cu e Cl nas cinzas dos ciclones, T é a temperatura do ciclone e d50 é o diâmetro médio das cinzas dos ciclones.
Foi ainda apossível identificar umacondição para que as emissões de PCDD/F dum sistema de Leiro fluidizado sejam inferiores ao VLE (Valor Limite de Emissão) quando S>0,15% (d.b.) e Cl > 0,03% (d.b.):
Resumo (Abstract in Portuguese)
Finalmente, foi também desenvolvido um modelo conético, o modelo FB-OWL, para estimar as possíveis emissões de PCDD/F através dos mecanismos ―Precursores‖ e ―de novo‖ resultantes da co-combustão de carvão com combustíveis de origem renovável em leito fluidizado.
Palavras-chave: Co-combustão, Leito Fluidizado, Emissões, PCDD/F, Resíduos não-tóxicos, Fontes de Energia Renováveis.
Table of Contents
Acknowledgments ... i
Abstract ... v
Resumo (Abstract in Portuguese) ... ix
Table of Contents ... xiii
List of abbreviations and definitions ... xvii
List of Tables... xxi
List of Figures ... xxiii
1. Preamble ... 1
2. Introduction ... 5
2.1 Energy Outlook ... 5
2.2 Environmental concerns and legislation ... 9
2.2.1 United Nations... 10 2.2.2 European Union ... 13 2.2.3 United States ... 16 2.2.4 India ... 20 2.2.5 China ... 21 2.3 Energy Resources ... 23 2.3.1 Coal ... 23 2.3.2 Biomass ... 24 2.3.3 Wastes... 25
2.4 Fluidized bed technology ... 27
3. Formation and control of pollutant emissions in combustion processes ... 31 3.1 Combustion ... 31 3.2 Particulate matter... 32 3.2.1 Mechanical/inertial collectors ... 34 3.2.2 Wet srubbers ... 35 3.2.3 Electrostatic precipitators ... 35 3.2.4 Fabric Filters ... 36
3.2.5 Hybrids Particle Collectors ... 37
3.2.6 Multipollutant control devices ... 38
3.3 Sulphur oxides... 39
3.4 Halogen Compounds ... 40
3.5 Heavy Metals ... 42
3.6 Persistent Organic Pollutants: Polycyclic Aromatic Hydrocarbons, Dioxins & Furans and Polychlorinated Biphenyls ... 47
3.6.1 Polycyclic Aromatic Hydrocarbons... 47
3.6.2 Dioxins and Furans ... 48
3.6.3 Polychlorinated Biphenyls ... 50
4. Mechanisms of formation of Dioxins and Furans ... 53
5. Experimental work ... 65
5.1 Experimental Programme ... 65
5.2 Materials used ... 66
5.3 Experimental Installation Description ... 69
5.3.1 Experimental Installation Operation ... 71
5.3.2 Fluidized bed characteristics... 72
5.4 Flue gases characterization ... 72
5.4.1 CO, CO2, O2, SO2 and NOx analysis ... 74
5.4.2 Particulate matter: total particulate matter and granulometric classification ... 75
5.4.3 Chlorinated compounds ... 75
5.4.4 Heavy Metals ... 75
5.4.5 Dioxins and Furans ... 76
5.5 Ashes characterization ... 77
5.5.1 Granulometric analysis ... 77
5.5.2 Carbon, hydrogen, nitrogen and sulphur content in the ashes ... 77
5.5.3 Heavy metals analysis in the ashes ... 78
6. Experimental Results ... 79
6.1 Operational conditions ... 79
6.1.1 Fluidization velocity ... 79
6.1.2 Gases residence time... 79
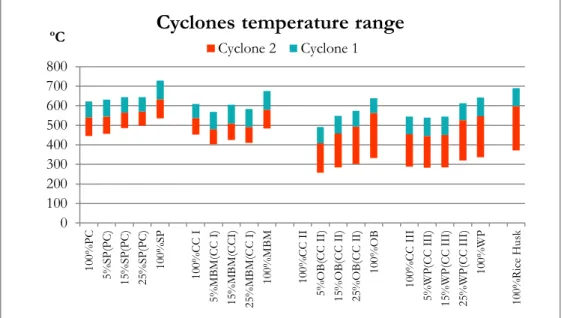
6.1.3 Cyclones temperature ... 81
6.1.4 Combustion efficiency ... 81
6.3 Flue gas composition ... 86
6.3.1 CO emissions ... 87
6.3.2 NOX emissions ... 87
6.3.3 SOX emissions ... 87
6.3.4 Chlorine emissions ... 95
6.3.5 Particulate matter emissions ... 98
6.3.5.1 Total Particulate Matter emissions... 98
6.3.5.2 Granulometric Classification of Particulate Matter emissions ... 99
6.3.6 Heavy metal emissions ... 99
6.4 Emission Limit Values ... 103
6.5 Ash streams ... 105
6.5.1 Ash yields ... 105
6.5.2 Ashes size analysis ... 106
6.5.3 Carbon and Sulphur ashes characterization... 107
6.5.4 Heavy metals in ashes ... 109
6.6 Dioxins and Furans ... 111
6.6.1 PCDD/F tests characterization ... 111 6.6.2 PCDD/F stack-gas emissions ... 112 6.6.3 Content of PCDD/F in ashes... 120 6.6.4 PCDD/F Homologue Profiles ... 128 6.6.5 PCCD/F distribution synthesis ... 133 6.7 Statistical analysis ... 134
6.7.1 Flue gas PCDD/F formation ... 137
6.7.2 Cyclone 1 and Cyclone 2 PCDD/F formation ... 137
6.8 Inhibition of PCDD/F formation ... 139
6.9 Percursor vs. de novo mechanism formation ... 141
7. Kinetic mechanism for the formation and destruction of PCDD/F ... 143
7.1 Model basic assumptions ... 143
7.2 Kinetic formula ... 145
7.3 PCDD/F formation model ... 146
7.4 FB-OWL model for PCDD/F stack emission ... 153
7.5 Model validation, data correlation and discussion ... 154
7.5.1 PCDD and PCDF collected in the cyclones ... 154
7.5.2 PCDD and PCDF emitted by the stack ... 156
8. Conclusions and Future Work ... 159
8.1 Conclusions ... 159
8.2 Future Work ... 161
9. Epilogue ... 163
List of abbreviations and definitions
a.r. as received
BA Bed Ash
BAT Best Available Technology
BREF Best available technology REFerence document CAA Clean Air Act
CAFE Clean Air For Europe CAIR Clean Air Interstate Rules CAMR Clean Air Mercury Rule CC Colombian Coal
CFR 40 Code of Federal Regulations
CLTRAP Convention on Long-Range Transboundary Air Pollution CSI Clear Skies Initiative
Cyc 1 Cyclone 1 Cyc 2 Cyclone 2
CO2-eq Carbon dioxide equivalent
d Particle diameter
d10 Particle aerodynamic diameter corresponding to 10% of the mass of a sample of fly ash d50 Particle aerodynamic diameter corresponding to 50% of the mass of a sample of fly ash d90 Particle aerodynamic diameter corresponding to 90% of the mass of a sample of fly ash dp Particles mean diameter
dSV Mean particle diameter corrected for the surface/volume ratio
d.b. dry basis
EIPCCB European Integrated Pollution Prevention and Control Bureau ELV Emission Limit Value
List of abbreviations and definitions
EMEP European Monitoring and Evaluation Programme EPER European Pollutant Emission Register
ESP Electrostatic Precipitator EU European Union F Fisher‘s value
FBC Fluidised Bed Combustor FC Fixed Carbon
FDG flue-gas desulphurization
FER Fontes de Energia Renovavéis (Portuguese) FF Fabric Filters
GHG Green House Gases HCB HexaChloroBenzene HM Heavy Metals
IED Industrial Emmisions Directive
IPCC Intergovernmental Panel on Climate Change I-TEF International Toxicity Emission Factor I-TEQ International Toxic Equivalent LCP Large Combustion Plants
MACT Maximum Achievable Control Technology MBM Meat and Bone Meal
MSW Municipal Solid Waste OB Olive Bagasse
PAC Polycyclic Aromatic Compounds PAH Polycyclic Aromatic Hydrocarbons PBDD PolyBrominated Dibenzo-p-Dioxins PBDF PolyBrominated DibenzoFurans PC Polish Coal PCB Polychlorinated Biphenyls PCBz Polychlorinated Benzenes PCPh Polychlorinated Phenols PCDD PolyChlorinated Dibenzo-p-Dioxins PCDF PolyChlorinated DibenzoFurans PIC Products from Incomplete Combustion PM Particulate Matter
Q2 Cross-validated leave-one-out correlation coefficient r2 Regression coefficient
R2 Determination coefficient
List of abbreviations and definitions
RES Renewable Energy Source RH Rice Husk
s Standard deviation
SIP State Implementation Plans SL Significance Level
SP Straw Pellets TEQ Toxic Equivalent toe tonnes of oil equivalent Uf Fluidization velocity
Umf Minimum fluidization velocity
Ut Particle terminal velocity
UNECE United Nations Economic Commission for Europe UNEP United Nations Environment Programme
UNFCCC United Nations Framework Convention on Climate Change VM Volatile Matter
VOC Volatile Organic Compounds WHO World Health Organisation WMO World Meteorological Organization WP Wood Pellets
xi molar fraction of the i element in terms of the total fuel mol
List of Tables
Table 2.1 - Protocols of the Convention on Long-Range Transboundary Air Pollution (CLRTAP). ... 11 Table 2.2 - Milestones in the evolution of the Clean Air Act (EPA CAA, 1990). ... 17 Table 2.3 - Current regulations applicable to air emissions of gaseous SO2 and NOx (CFR, 2013). ... 18Table 2.4 - Evolution of reduction targets of Clear Skies initiative. ... 20 Table 2.5 - Particulate Matter Emission Limits (CPCB, 2008). ... 20 Table 2.6 - Minimum Stack Height (CPCB, 2008). ... 21 Table 2.7 - Particulates and SO2 emission standards for thermal power plants in China (SEPA, 2003). ... 22
Table 2.8 - NOx emission standards (mg/Nm3) for thermal power plants in China (SEPA, 2003). ... 22
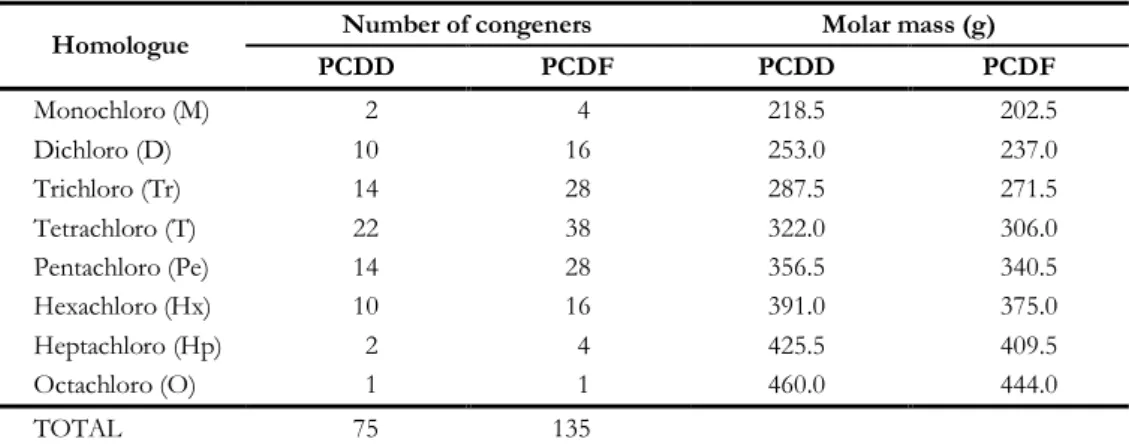
Table 2.9 – Coal ranks and approximate C and H contents (Gulyurtlu, 1989). ... 23 Table 2.10 – Age of coal (Gulyurtlu, 1989). ... 23 Table 2.11 – Solid biofuels from LCP BREF (Lopes et al., 2006). ... 26 Table 2.12 – The 12 Green Chemistry Principles (Anastas and Warner, 1998)... 29 Table 3.1 – Synthesis of the currently used particulate matter control devices (Pinto et al., 2009). ... 36 Table 3.2 - Synthesis of the currently used particulate matter control devices (based in LCP BREF, 2006). ... 41 Table 3.3 - Heavy Metals emissions from LCP in the EU-25 in 2004 (EPER, 2013). ... 42 Table 3.4 - Typical concentrations of As, Cd, Cr, Cu, Hg, Ni, Pb, and Zn in coals (Raask, 1985). ... 43 Table 3.5 - Classes of heavy metals (from Raask, 1985)... 44 Table 3.6 – Toxic PAH‘s (Lerda, 2010)... 47 Table 3.7 – Number of possible congeners and molar mass of PCCD and PCDF within each homologue group... 49 Table 3.8 - International Toxicity Emission Factors (I-TEF) for PCCD/F. ... 49 Table 3.9 - WHO Toxicity Emission Factors (WHO-TEF) for PCBs (Van der Berg et al., 2006). ... 50 Table 4.1 – Effect of different parameters in PCDD/F formation. ... 64 Table 5.1 – Identification and codification of the monocombustion and co-combustion tests. ... 65 Table 5.2 – Fuels characterization methodologies (COPOWER, 2007). ... 66 Table 5.3 - Fuels analyses (COPOWER, 2007 and INETI, 2007d). ... 67
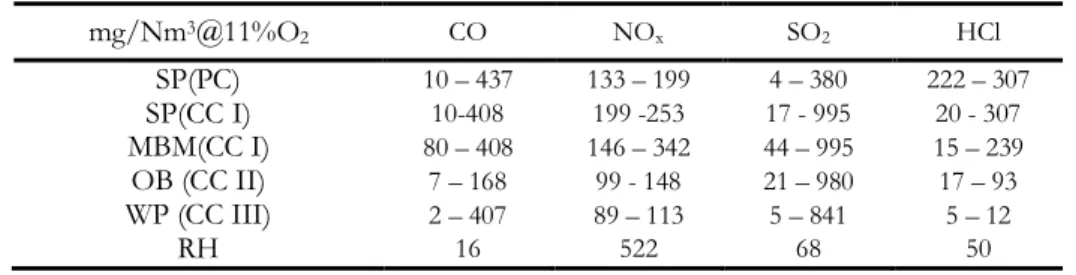
Table 5.4 – PCCD/F content in selected fuels. ... 68 Table 5.5 - Summary of the flue gas sampling methodologies... 74 Table 6.1 – Freeboard residence time of the gases for the PCDD/F tests. ... 80 Table 6.2 – Residence time of the gases in Cyclones 1 and 2 for the PCDD/F tests. ... 80 Table 6.3 – Operational conditions for the test runs (INETI, 2005a, 2005b, 2007a, 2007b, 2007c)... 83 Table 6.4 – Characterization of isokinetic test runs for PM, GC, HM and Halogens sampling (INETI, 2005a, 2005b, 2007a, 2007b, 2007c and Lopes et al., 2009). ... 86 Table 6.5 – Range of the gaseous emissions for the tested fuels (INETI, 2005a, 2005b, 2007a, 2007b, 2007c). ... 86 Table 6.6–Heavy metals emissions (INETI, 2005a, 2005b, 2007a, 2007b, 2007c). ... 100 Table 6.7 – Operational conditions for the PCDD/F test runs (INETI, 2005a, 2005b, 2007c, 2007d)... 111 Table 6.8 - Molar ratios between S, Cl and Ca, for the PCDD/F tests. ... 111 Table 6.9 – Copper concentration in the cyclones and fly ashes for the PCDD/F tests... 111 Table 6.10 - Copper mass in the cyclones and fly ashes for the PCDD/F tests. ... 112 Table 6.11 – Characterization of isokinetic test runs for PCDD/F sampling (INETI, 2005a, 2005b, 2007c, 2007d). ... 112 Table 6.12 – PCCD/F Stack gas emissions of MBM/Colombian Coal Tests (ng/Nm3@11%O2). ... 113
Table 6.13 – PCCD/F Stack gas emissions of Straw/Polish Coal Tests (ng/Nm3@11%O2). ... 115
Table 6.14 – PCCD/F Stack gas emissions of Straw/Cerejon coal tests (ng/Nm3@11%O2). ... 116
Table 6.15 – PCCD/F Stack gas emissions of Rice Husk test (ng/Nm3@11%O2). ... 117
Table 6.16 – PCCD/F Stack gas emissions (ng I-TEQ/Nm3@11%O2)... 119
Table 6.17 – PCCD/F Content in the cyclone ashes from MBM/Cerejon Coal Tests. ... 120 Table 6.18 – PCCD/F distribution for the MBM/Cerejon Coal Tests. ... 121 Table 6.19 – PCCD/F Content in the cyclones ashes from Straw/Polish Coal Tests. ... 122 Table 6.20 – PCCD/F distribution for the SP/Polish Coal Tests. ... 122 Table 6.21 – PCCD/F Content in the cyclones ashes from Straw/Cerejon Coal Tests. ... 124 Table 6.22 – PCCD/F distribution for the SP/Cerejon Coal Tests. ... 125 Table 6.23 – PCCD/F Content in the cyclones ashes from Straw/Polish Coal Tests. ... 125 Table 6.24 – PCCD/F distribution for the 100%RH test. ... 127 Table 6.25 – Tested parameters. ... 134 Table 6.26 – Molar fractions of selected parameters. ... 134 Table 6.27 – Correlation coefficients between descriptors. ... 135 Table 6.28 – Mass ratio PCDF/PCDD in the cyclones and stack gas (ngPCDF/ngPCDD). ... 142
Table 7.1 –Comparison between FB-OWL and Duo models. ... 145 Table 7.2 – Thermodynamic data (Atkins, 1991). ... 147 Table 7.3 – Thermodynamic equilibrium constants for reactions (4.2) to (4.5)... 147 Table 7.4 – Calculated thermodynamic equilibrium constants for reactions (4.2) to (4.5). ... 148
List of Figures
Figure 2.1 - World Primary Energy Demand Growth projected in the IEA ―New Policies‖ Scenario (WEO, 2011). ... 6 Figure 2.2 - World Primary Energy Demand Growth projected in the IEA ―Current Policies‖ Scenario (WEO, 2011). ... 7 Figure 2.3 - World Primary Energy Demand Growth projected in the IEA ―450 parts per million targeted‖ Scenario (WEO, 2011). ... 7 Figure 2.4 – Electricity from RES in Portugal, 2010 (from DGEG, 2012). ... 8 Figure 2.5 – Portuguese final energy consumption, 2010 (from DGEG, 2012). ... 9 Figure 2.6 – Agricultural and forest biomass residues in Portugal (COPOWER, 2007). ... 25 Figure 3.1 – Schematic illustration of different combustion stages (adapted from Aurell, 2008). ... 32 Figure 3.2 – Coal typical comminution processes (from Chirone et al., 1991). ... 33 Figure 3.3 - Modes of occurrence of trace elements in coal (from Davidson, 2000). ... 44 Figure 3.4 – Equilibrium distribution of Cd (%(mol Cd/mol Cd total)) at standard oxidizing conditions (in the Cd/O system) as a function of the temperature, in a flue gas from combustion of a subbituminous coal: =1.2 and cCd,O = 0.05 ppmw (Frandsen et al., 1994). ... 45Figure 3.5 – Equilibrium distribution of Cd (%(mol Cd/mol Cd total)) at standard oxidizing conditions (in the Cd/O/Cl system) as a function of the temperature, in a flue gas from combustion of a subbituminous coal: =1.2 and cCd,O = 0.05 ppmw and cCl,O = 300 ppmw (Frandsen et al., 1994). ... 45
Figure 3.6 – Equilibrium distribution of Pb (%(mol Pb/mol Pb total)) at standard oxidizing conditions for a Cd/O system as a function of temperature in a flue gas from combustion of a sub-betuminous coal: =1.2 and cPb,O = 25ppmw (Frandsen et al., 1994).. ... 46
Figure 3.7 – Equilibrium distribution of Pb (%(mol Pb/mol Pb total)) at standard oxidizing conditions (in the Cd/O system) as a function of the temperature, in a flue gas from combustion of a subbituminous coal: =1.2 and cPb,O = 25 ppmw and cCl,O = 300 ppmw (Frandsen et al., 1994). ... 46
Figure 3.8 – Basic structure of (a) dibenzo-para-dioxin; (b) dibenzofuran. ... 48 Figure 3.9 – General structure of PCBs. ... 50
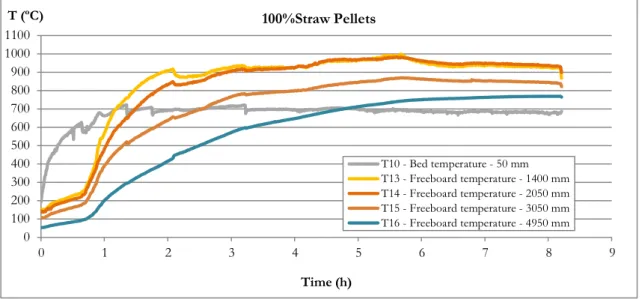
Figure 3.10 – The contribution made by different sectors to emissions of PCDD/F (from EEA, 2011). ... 51 Figure 4.1 – The competing behaviour of formation and decomposition reactions (from Wehrmeier, 1998). 53 Figure 4.2 – Schematic representation of PCDD/F formation pathways (from Tuppurainen, 1998). ... 55 Figure 4.3 – Interaction between fuel composition and effects... 64 Figure 5.1 – Selected tests. ... 66 Figure 5.2 – Molar ratios for the test runs. ... 67 Figure 5.3 – PDCF and PCDD homologue mass distribution in the fuels. ... 69 Figure 5.4 – Temperature measurement points along the reactor... 69 Figure 5.5 – Schematic view of the pilot fluidised bed combustors. ... 70 Figure 5.6 – Views of the LNEG pilot fluidised bed ‖New installation‖. ... 71 Figure 5.7 – Temperature profile evolution in the heating and test run periods of the 100%Straw pellets test. ... 72 Figure 5.8 – Over-isokinetic, under-isokinetic and isokinetic sampling. ... 73 Figure 5.9 – Granulometric classification: a) Andersen Mark III Sampler, b) a classification level detail (adapted from Salema, 2008). ... 75 Figure 5.9 – EN 1948-1 filter/condensator sampling train (EN 1948-1). ... 76 Figure 5.10 – View of the PCDD/F sampling assembly. ... 77 Figure 6.1 – 1st and 2nd cyclone temperature range for the different campaigns. ... 81
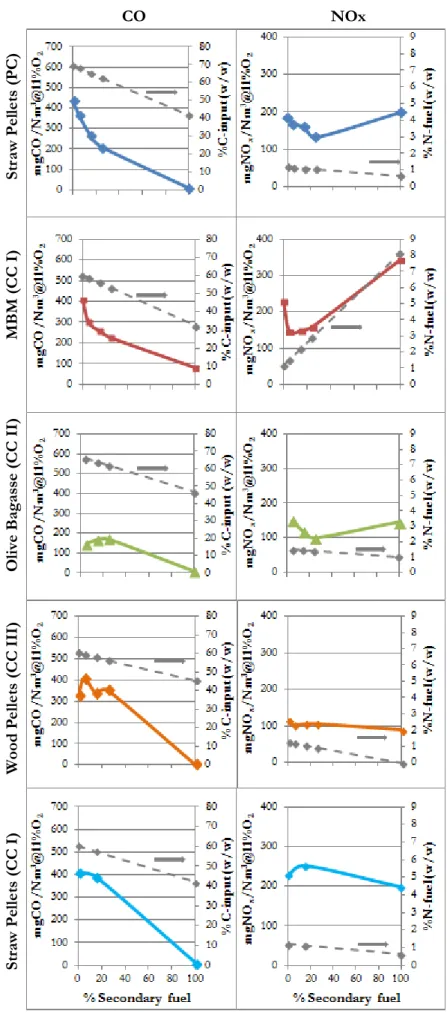
Figure 6.2 – Combustion efficiency for the different campaigns (COPOWER, 2007)... 82 Figure 6.3 – Temperature profile along the combustor height for the test runs (COPOWER, 2007; INETI, 2007c). ... 84 Figure 6.4 – Temperature profile along the combustor height for the test Straw/CC I test runs (COPOWER, 2007; INETI, 2007d). ... 85 Figure 6.5 – CO and NOx emissions obtained for the five campaigns (INETI 2005a, 2005b, 2007a, 2007b,
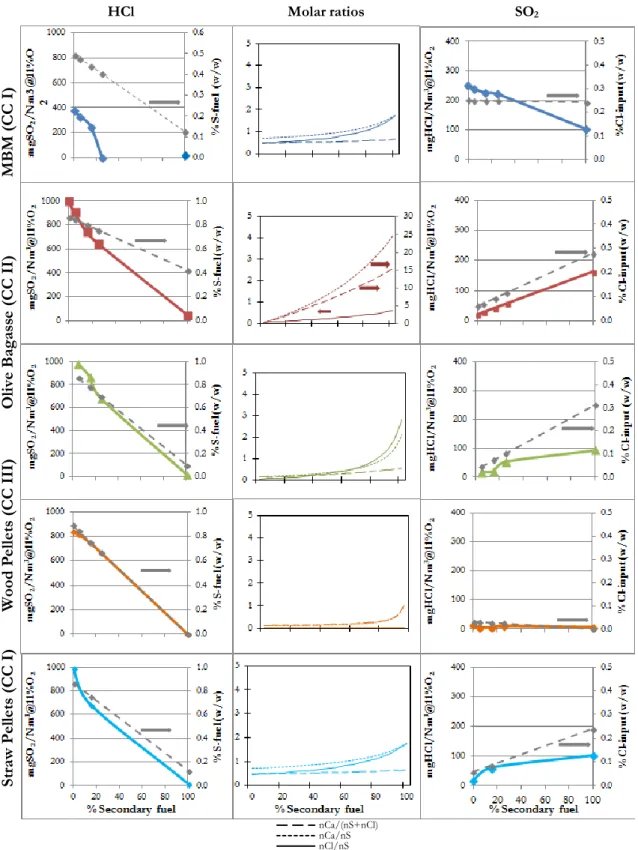
2007d). ... 88 Figure 6.6 – HCl, SO2 and molar ratios for the five campaigns (INETI 2005a, 2005b, 2007a, 2007b, 2007d).
... 89 Figure 6.7 – Plot of SO2 emissions versus nCa/nS (left: with all MBM tests; right: tests without MBM). ... 90
Figure 6.8 – Relation between SO2 emisisons and the sulphur content of the mixtures. ... 91
Figure 6.9 - Sulphur and chlorine content of the tested mixtures and fuels... 91 Figure 6.10 -Sulphur emissions vs. the sulphur, calcium and chlorine content of the tested mixtures. ... 92 Figure 6.11 – Relation between SO2 emisisons and the sulphur content of the mixtures. ... 92
Figure 6.12 – Plot of SO2 emissions versus [nCa/(nS+nCl)]/(%Cl-Fuel,db)/(%S-Fuel,db) < 20. ... 93
Figure 6.13 – Plot of SO2 emissions versus [nCa/(nS+nCl)]/(%Cl-Fuel,db)/(%S-Fuel,db) > 20. ... 93
Figure 6.14 – Plot of the predicted vs. experimental SO2 emissions. ... 94
Figure 6.15 – Plot of SO2 emissions versus nCa/nS (recalculated for MBM/CC tests). ... 94
Figure 6.16 - Relation between HCl emisisons and the sulphur content of the mixtures... 95 Figure 6.17 – Plot of HCl emissions versus [nCa/(nS+nCl)]/(%Cl-Fuel,db)/(%S-Fuel,db). ... 95 Figure 6.18 – Plot of HCl emissions versus [nCa/(nS+nCl)]/(%Cl-Fuel,db)/(%S-Fuel,db) < 20. ... 96 Figure 6.19 – Plot of HCl emissions versus [nCa/(nS+nCl)]/(%Cl-Fuel,db)/(%S-Fuel,db) > 20. ... 96 Figure 6.20 – Dependence of SO2 and HCl emissions of the S-Fuel and Cl-Fuel content. ... 97
Figure 6.21 – Predicted emissions of SO2 and HCl from the knowledge of Ca, S and Cl fuel content. ... 97
Figure 6.22 – PM stack-gas emissions and fuel ash content for the test runs (based in COPOWER, 2007). .. 98 Figure 6.23 – Fly ash diameter range for the five campaigns (based in COPOWER, 2005 and 2007). ... 99 Figure 6.24 – Comparison between the PM emissions and Cu and Pb emissions for the MBM/CC I test. .. 101 Figure 6.25 – Comparison between the PM emissions and Cu and Pb emissions for the SP/PC test. ... 102 Figure 6.26 – Stack emissions of Hg for CC II/OB tests... 104 Figure 6.27 – Stack emissions of As+Cu+Cr+Pb+Mn+Ni for CC II/OB tests. ... 104 Figure 6.28 – Stack emissions of Hg for CC III/WP tests. ... 104 Figure 6.29 – Stack emissions of Cd for CC III/WP tests ... 104 Figure 6.30 – Stack emissions of As+Cu+Cr+Pb+Mn+Ni for CC III/WP tests... 104 Figure 6.31 - Ash Partitioning in MBM/Cerejon Coal tests (COPOWER, 2007). ... 105 Figure 6.32 - Ash Partitioning in Straw/Polish Coal Tests (COPOWER, 2007). ... 106 Figure 6.33 – Mean diameter d50 for the 1st and 2nd cyclone ashes (COPOWER, 2007; INETI, 2007c)... 107
Figure 6.34 – Carbon and sulphur content for the 1st and 2nd cyclone ashes (COPOWER, 2007). ... 108
Figure 6.35 – Chlorine and copper content for the 1st and 2nd cyclone ashes... 109
Figure 6.36 – Relative enrichment of the ashes streams, corrected for the carbon content... 110 Figure 6.37 – 1st and 2nd cyclone temperature range for the different PCDD/F campaigns (Old pilot: SP/CC
I and MBM/CC I tests –; New pilot: 15SP(CC I) + 100%Rice Husk tests). ... 112 Figure 6.38 – PCDD/F distribution in the stack-gas emissions of the MBM/Coal Cerejon tests. ... 114 Figure 6.39 – PCDD/F distribution in the stack-gas emissions of the Straw Pellets/Polish coal tests. ... 115 Figure 6.40 – PCDD/F distribution in the stack-gas emissions of the Straw Pellets/Cerejon coal tests. ... 117 Figure 6.41 – Comparison between PCDD/F stack-gas emissions congeners with the Rice Husk fuel
congeners. ... 118 Figure 6.42 – PCDD/F distribution in the stack-gas emissions of the Rice Husk test and comparison with the other 100% combustion tests... 118 Figure 6.43 – PCDD/F distribution in the 1st and 2nd Cyclone ashes of the MBM/Coal Cerejon tests. ... 121
Figure 6.44 – PCDD/F distribution in the 1st and 2nd Cyclone ashes of the Straw/Polish Coal tests. ... 123
Figure 6.45 – PCDD/F distribution in the 1st and 2nd Cyclone ashes of the Straw/Cerejon coal tests. ... 124
Figure 6.46 – PCDD/F congener distribution in the 1st and 2nd Cyclone ashes of Rice Husk test. ... 126
Figure 6.47 – PCDD/F distribution in the 1st and 2nd Cyclone ashes of the 100%RH test and comparison
with the other 100% combustion tests. ... 127 Figure 6.48 – Homologue distribution in MBM and Coal Cerejon (ng PCDD/F/kg fuel). ... 128
Figure 6.49 – Homologue distribution in the 1st and 2nd cyclone ashes for the MBM(CC I) tests (as measured,
ng PCDD/F). ... 129
Figure 6.50 – Homologue distribution in the stack-gas emissions of the MBM/Coal Cerejon tests (ng
PCDD/F/Nm3)... 129
Figure 6.51 – Homologue distribution in the 1st and 2nd cyclone ashes for the SP(PC I) tests (as measured, ng PCDD/F). ... 130
Figure 6.52 – Homologue distribution in the 1st and 2nd cyclone ashes and in the stack gas emitted for the
Figure 6.53 – Homologue distribution in the 1st and 2nd cyclone ashes for the SP(CC I) tests (as measured, ng PCDD/F). ... 131
Figure 6.54 – Homologue distribution in the 1st and 2nd cyclone ashes and in the stack gas emitted for the
SP(PC I) tests (as measured, ng PCDD/F). ... 132
Figure 6.55 – Homologue distribution in the 1st and 2nd cyclone ashes and in the stack gas emitted for the
100%RH test (as measured, ng PCDD/F). ... 132
Figure 6.56 – PCDD and PCDF distribution between the 1st and 2nd cyclone ashes and the stack gas emitted
(in terms of measured molPCDD/F). ... 133
Figure 6.57 – Predicted vs. Experimental log yD+F (◊ - data for 15%SP/85%CC). ... 136
Figure 6.58 – Correlation between the different fractions of PCDD and PCDF and the factor xCl/103.xS.... 137
Figure 6.59 – Correlation between the different fractions of PCDD and PCDF and the factor Cuash*Clash
%Cash*T/d50. ... 138
Figure 6.60 – SO2 emissions in the PCDD/F tests vs. [nCa/(nS+nCl)]/S-fuel (%, d.b.)*Cl-fuel (%, d.b.). ... 139
Figure 6.61 - HCl emissions in the PCDD/F tests vs. [nCa/(nS+nCl)]/S-fuel (%, d.b.)*Cl-fuel (%, d.b.). .... 139 Figure 6.62 - PCDD/F emissions vs. [nCa/(nS+nCl)]/S-fuel (%, d.b.)*Cl-fuel (%, d.b.). ... 140 Figure 6.63 - PCDD/F emissions in ng I-TEQvs. [nCa/(nS+nCl)]/S-fuel (%, d.b.)*Cl-fuel (%, d.b.) ... 140 Figure 7.1 – Equilibrium gas concentrations calculated for the reaction (4.2), at 20% H2O and 10% O2. ... 148
Figure 7.2 – Equilibrium gas concentrations calculated for the reaction (4.2) for the MBM/CC and SP/PC experimental test conditions. ... 149 Figure 7.3 – Equilibrium gas concentrations calculated for the reaction (4.2) for the SP/CC and Rice Husk experimental test conditions. ... 149 Figure 7.4 – Equilibrium gas concentrations calculated for the reaction (4.4), at 5.5% O2. ... 150
Figure 7.5 – Equilibrium Cl2 concentration calculated for the sulphur reaction and the Deacon reaction at
20% H2O, 10% O2, with 20 ppm HCl, and with =10. . ... 150
Figure 7.6 – Correlation between FB-OWL model for precursor and de novo mechanisms and experimental PCDD/F data obtained in Cyclone 1. ... 155 Figure 7.7 – Correlation between FB-OWL model for precursor and de novo mechanisms and experimental PCDD/F data obtained in Cyclone 2. ... 156 Figure 7.8 – Estimation of PCDD/F desorption free Gibbs energy from the experimental data. ... 157
1.
Preamble
This thesis focuses on a theoretical kinetic model for the formation and destruction of dioxins and furans in combustion and co-combustion processes with coal and different types of wastes. For this work, experimental results obtained in a European project funded by the 6th EU Framework Programme were used. The project entitled COPOWER - ―Synergy Effects of Co-Processing of Biomass with Coal and Non-Toxic Wastes for Heat and Power Generation‖ was coordinated by the National Institute of Engineering Technology and Innovation (INETI) through the Department of Energy Engineering and Environmental Control, with the collaboration of the Faculty of Sciences and Technology of the University Nova of Lisbon through the Unit of Environmental Biotechnology, among other European participating entities.
Various mixtures of different types of wastes and biomasses were studied, mixed and non-mixed with two types of coal (Colombian and Polish), having determined the levels of emissions of dioxins and furans for mixtures containing MBM and straw as biomassic materials. These mixtures were selected based on Chlorine and Sulphur compositions present in the mixtures, expected to lead to different kinds of synergies related to the presence of those elements that would have an impact on the reactions‘ mechanisms. The project was proven successful in immediate terms, as it introduced a new perspective in the context of multi-fuel systems which could avoid the dependence on any one fuel for energy production. The studies aimed at improving the knowledge for fuel blending. Combinations of coal, biomass and waste were tried and the results show that multi-fuel use could lead to overcoming many problems like reducing heavy metal vaporisation by the presence of S and Cl. It was also identified beneficial effects of fixing mainly sulphur and chlorine, in the ashes rather than their emissions to the atmosphere. Thus, the combination of high S fuels with high Cl ones could have beneficial effect on suppressing dioxin emissions.
Furthermore, fifteen positive synergies were identified in the co-combustion of fuel blends while only five negative synergies were found. At present, it gives the opportunity to investigate further on the mechanisms of formation and destruction of chemical species like dioxins and furans, essential to identify parameters that can be used to control their emissions.
Not only the data produced during the course of work were used but also results from other combustion tests using rice husk and a different mixture from those used in the COPOWER project studies, with straw and Colombian coal. The sampling of the stack-gas emissions, as well as the implementation and validation of PCDD/F sampling, was done by the author, who contributed to the experimental runs including planning of the experiments. These studies were previously analysed and validated for publication, with a significant contribution by the author to the writing of the papers submitted to international journals and conferences. These publications are listed below:
Paper 1 - Lopes M. Helena, Gulyurtlu I., Abelha P., Teixeira P., Crujeira T., Boavida D., Marques F., Cabrita I., (2006) ―Co-combustion for Fossil Fuel Replacement and Better Environment‖, Proceedings of the 7th European Conference on Industrial Boilers and Furnaces, April, Porto, Portugal, Paper Infub_92; ISBN 972-99309-1-0.
Paper 2 - Gulyurtlu, I., Lopes, H., Crujeira, T., Boavida, D., Abelha, P., (2007a)
―COPOWER - Co-Firing of Biomass and other Wastes in Fluidised Bed Systems‖, Proceedings of the International Conference on Coal Science and Technology, August 28 – 31, Nottingham, United Kingdom.
Paper 3 - Crujeira T., Lopes H., Abelha P., Cabrita I., Gulyurtlu I., (2007) ―Minimization of Flue Gas Emissions Produced by Co-combustion with Biomass and Wastes‖ (paper in Portuguese), Proceedings of the 9th National Environmental Conference, April 18 – 20, Aveiro, Portugal, Ed. Borrego, C. et al., pp. 723-731; ISBN 978-972-789-230-3.
Paper 4 - Gulyurtlu I., Abelha P., Lopes H., Crujeira A., Cabrita I., (2007b)
―Considerations on Valorization of Biomass Origin Materials in Co-combustion with Coal in Fluidized Bed‖, Proceedings of the 3rd International Conference on Clean Coal Technologies for Our Future, May 15 – 17, Sardinia, Italy.
Paper 5 - Gulyurtlu I., Crujeira A. T., Abelha P., Cabrita I., (2007c) ―Measurements of
dioxin emissions during co-firing in a fluidised bed‖, Fuel 86, pp. 2090–2100; DOI:10.1016/j.fuel.2007.01.037.
Paper 6 - Crujeira, T., Gulyurtlu, I., Lopes, H., Abelha, P., Cabrita, I., (2008) ―Bioenergy originating from biomass combustion in a fluidized bed‖, Proceedings of the International Conference and Exhibition on Bioenergy - Bioenergy: Challenges and Opportunities, April 6 – 9, Minho University, Guimarães, Portugal.
Paper 7 – Abelha P., Gulyurtlu I., Crujeira T., Cabrita I., (2008) ―Co-Combustion of
Several Biomass Materials with a Bituminous Coal in a Circulating Fluidised Bed Combustor‖, Proceedings of 9th International Conference on Circulating Fluidized Beds, May 13–16, Hamburg, Germany.
Paper 8 - Lopes H., Gulyurtlu I., Abelha P., Crujeira T., Salema D., Freire M., Pereira R., Cabrita I., (2009) ―Particulate and PCDD/F emissions from coal co-firing with solid biofuels in a bubbling fluidised bed reactor‖, Fuel 88, pp. 2373-2384; DOI:10.1016/j.fuel.2009.02.024.
Paper 9 - Crujeira T., Moreira L., Cabrita I., Gulyurtlu I., (2013) , ―PCDD/F formation in the co-combustion of biomass and coal: the influence of chlorine, copper, calcium and sulphur‖, Proceedings of the 1st International Congress on Bioenergy, 23-25 May, Portalegre, Portugal, ISBN 978-989-98406-2-1.
2.
Introduction
2.1 Energy Outlook
In the last century the use of fossil fuels as energy source, namely oil, coal and natural gas, allowed a significant increase in economic, scientific and technical development. More recently, the sustainability of the energy systems and the environmental concerns due to the fossil fuels combustion emissions are key issues to tackle. In 2011, oil reserves were estimated to last for 54.2 years, natural gas for 63.6 years and coal for 112 years (BP, 2012) considering that consumption would be maintained at 2011‘s rate.
Coal and peat accounted in 1973‘s world energy balance with 24.6 %, contribution that increased in 2010 to 27.3% (IEA, 2012). Projections to 2015 depend upon the success of policy implementation towards near-zero emissions and the technical and economic progress on carbon capture, use and sequestration technologies; however, coal is expected to continue having a significant role, especially in the power sector (IEA, 2010).
World Energy Outlook (WEO, 2011) considers three scenarios for the world primary energy demand, depending on assumptions made with regard to policy orientations. The ―New Policies‖ Scenario takes into account existing government policies and declared policy intentions; the ―Current Policies‖ Scenario is a ―Business-as-usual‖ scenario that considers existing government policies and measures enacted or adopted by mid-2011, considering that they remain unchanged; the third Scenario is an Outcome-driven Scenario, which considers a 50% chance of limiting the increase in the average global temperature to 2°C. This last scenario is the most stringent one, which would require a concentration of greenhouse gases in the atmosphere to be limited to about 450 ppm of CO2-eq (i.e. carbon dioxide equivalent) on a long-term basis.
In the New Policies Scenario, world primary energy demand is projected to increase at a rate of 1.3% per year, from 12 150 million tonnes of oil equivalent (Mtoe) in 2009 to 16 950 Mtoe in 2035, leading to a 40% overall increase (Figure 2.1). Coal is projected to have a share of 28% in the overall demand by 2035, compared to a 27% contribution in the year 2009.
0.000 2.000 4.000 6.000 8.000 10.000 12.000 14.000 16.000 18.000 20.000 1980 2009 2020 2035
Mtoe New Policies Scenario
27% 33% 21% 10% 2% 1% 3% Other Renewables Gas Nuclear Hydro Biomass+Waste Coal Oil 10% 3% 2% 6% 22% 30% 28%
Figure 2.1 - World Primary Energy Demand Growth projected in the IEA ―New Policies‖ Scenario (WEO, 2011).
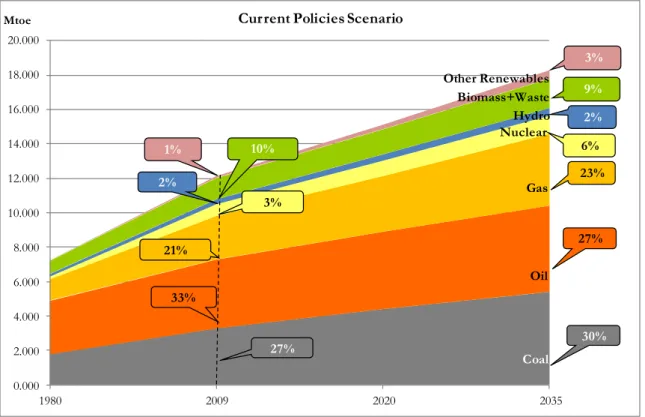
Figure 2.2 shows the global energy demand in the Current Policies Scenario, showing a faster increase in the overall primary energy demand (1.6% per year), reaching 18 300 Mtoe in 2035, 51% higher than demand in 2009.
In the ―450 ppm targeted‖ Scenario, illustrated in Figure 2.3, the global energy demand still increases between 2009 and 2035, reaching 14 850 Mtoe in 2035, which represents a global increase of 23%, i.e. 0.8% per year. In 2035, energy demand is 9% lower than in the Current Policies Scenario and more than 12% lower than in the New Policies Scenario.
The differences accounted in the three scenarios are basically related to the extent to which policies are implemented to improve energy efficiency. In terms of the use of coal, its share increases to 30% in the Current Policies Scenario; however, in the more stringent Greenhouse gases‘ emissions scenario, Figure 7.3 shows a lower share for coal contribution in the overall balance, of 16%. In all scenarios, fossil fuels (coal, oil and natural gas) remain the dominant sources of energy in 2035, varying each share in the energy mix.
0.000 2.000 4.000 6.000 8.000 10.000 12.000 14.000 16.000 18.000 20.000 1980 2009 2020 2035
Mtoe Current Policies Scenario
27% 33% 21% 10% 2% 1% 3% Other Renewables Gas Nuclear Hydro Biomass+Waste Coal Oil 9% 2% 3% 6% 23% 27% 30%
Figure 2.2 - World Primary Energy Demand Growth projected in the IEA ―Current Policies‖ Scenario (WEO, 2011).
0.000 2.000 4.000 6.000 8.000 10.000 12.000 14.000 16.000 18.000 20.000 1980 2009 2020 2035 Mtoe 450 Scenario 27% 33% 21% 10% 2% 1% 3% Other Renewables Gas Nuclear Hydro Biomass+Waste Coal Oil 16% 3% 8% 11% 22% 25% 16%
Figure 2.3 - World Primary Energy Demand Growth projected in the IEA ―450 parts per million targeted‖ Scenario (WEO, 2011).
The share of fossil fuels decreases from 81% of world primary energy supply in 2009 to: 80%, in 2035, in the Current Policies Scenario;
75%, in 2035, in the New Policies Scenario; 62%, in 2035, in the ―450‖ Scenario.
Coal is projected to account in all scenarios with more than 16%, competing strongly with other resources. However, coal use is seen worldwide as having a significant environmental impact. From 1990 to 2006, the world carbon emissions had an increase of 30% (Rühl, 2007). The world average carbon intensity between 1971 and 1999 decreased from 0.82 to 0.745 ton carbon/ton primary energy and, in 2006, was 0.76 ton carbon/ton primary energy; over the same period, China‘s carbon intensity decreased from 1.02 to 0.95 ton carbon/ton primary energy.
Portugal is a country with scarce endogeneous energy fossil resources. Portugal faces a high energy dependency from foreign countries through the import of primary resources (76.6% in 2010) (DGEG, 2012). Since 2005, these imports have been decreasing through the higher contribution of renewable energy resources such as hydro, wind, solar, geothermic and biomass to the Portuguese fuel mix.
In 2010, oil still represented 49.1% of the total primary energy consumption (-0.4% than in 2009) wheras natural gas contribution rose to 19.7% in 2010 (+1.8% than in 2009). Coal‘s share was 7.2% and renewables rose to 23.1% (+3.1% than in 2009) (DGEG, 2012).
The installed capacity for electricity production from RES reached 9777.98 MW in 2010, with 784.5 MW being from biomass (DGEG, 2012).
In 2010, the electricity production from RES reached 29566 GWh (DGEG, 2012), distributed as presented in Figure 2.4.
Looking into the Portuguese final energy consumption, it reached 17 276 ktoe in 2010 (DGEG, 2012), with the distribution of sources illustrated in Figure 2.5.
Figure 2.5 – Portuguese final energy consumption, 2010 (from DGEG, 2012).
2.2 Environmental concerns and legislation
Environmental quality has been the original driver for environmental legislation, including in Europe. In fact, the deterioration in air quality led authorities to find a way to reduce ambient concentrations of pollutants. Recently, a technology driven approach was introduced, which enables a progressive reduction in emissions resulting from the developments in improving control technologies. In Europe the concept introduced is the Best Available Technology (BAT) and in the United States of America is the Maximum Achievable Control Technology (MACT). Both mechanisms are based on a technology driven approach.
Legislation has been published around the world with the objective of eliminating environmental degradation. Most of it imposes emissions‘ limits for industrial processes. In accordance with the severity of the environmental impact of the various processes, countries establish their own targets and define mechanisms to guarantee a better environmental control. These can be grouped as follows (Sloss et al., 2003):
Emission limits
The establishment of emissions limits are generally linked to ambient pollution concentrations. These limits are based on epidemiological data, ambient air quality and ambient air quality standards.
Cap and trade
This is a regulatory approach which recognizes that allowing the market to find its own means of emission reduction may be more cost effective than strict emission limits. The CO2 market is an example.
30% 37% 17% 6% 11% Industry Transportation Household Others Services
Best Available Technologies (BAT) and Maximum Achievable Control Technologies (MACT) Much of the existing legislation, such as that for SO2 and NOx in Europe and the United States, includes requirements for Best Available Technologies (BAT) or Maximum Achievable Control Technologies (MACT). It is generally recognized that BAT for individual sources may be different, due to the technical characteristics of the installations, the geographical location and local environmental conditions. In Europe, the European Integrated Pollution Prevention and Control Bureau (EIPPCB, 2013) exists to catalyse an exchange of technical information on BAT and to create BAT Reference documents (BREFs).
Integrated pollution prevention and control (IPPC)
This technology based approach goes further than the implementation of BAT/MACT. The main goal of the ‗IPPC‘ is the integration and the prevention of pollution, including not only management and organization issues, but also focusing in energy efficiency. The application of the IPPC Directive to all existing plants in Europe was required by 2007, at the latest. Although, following the BAT was not mandatory, the recent recast of the IPPC is pointing to stricter emissions limits, forcing industry to apply the BAT existing in each moment, in order to achieve lower pollutant emissions to the atmosphere.
Economic mechanisms
The payment of financial penalties (fines) are commonly based on the Polluter Pays Principle, and are a way of penalizing sources for non-compliance with emission legislation.
Given the importance of international organizations‘ role like the United Nations, as well as the role that some countries can play like the European Union and the United States of America for their leadership and dimension, information about policies undertaken are presented below. In this context, it is also important to look at countries like India and China that can have a significant impact on the environment in terms of dimension related to their contribution within the scope of the energy sector. Information on these countries‘ strategies is also presented.
2.2.1 United Nations
The United Nations (UN) has several protocols and programmes considering environmental protection, which member countries decide whether or not to sign and/or to ratify on an individual basis.
The Chemicals branch of the United Nations Environment Programme (UNEP) works to protect humans and the environment from adverse effects caused by chemicals throughout their lifecycle, and includes hazardous waste. It is the focal point of UNEP activities chemicals issues and this
programme is the main catalytic force in the UN system for concerted global action on the environmentally sound management of hazardous chemicals (UNEP, 2013).
Some highlights of the work performed related to heavy metals‘ enissions are presented below. In the case of mercury, in 2001, UNEP undertook a global assessment of emissions and mercury compounds. A Global Mercury Assessment report was published in December 2002 (GMA, 2002). There was sufficient evidence of significant global adverse impacts from mercury and its compounds to warrant further international action to reduce the risks to human health and to the environment. It was requested to UNEP to initiate technical assistance and capacity building activities to support the efforts of countries to take action regarding mercury pollution. In response to this request, UNEP established a mercury programme within UNEP Chemicals.
In the case of Lead and Cadmium, UNEP also undertook a number of activities related to these emissions. In 2005/2006, UNEP Chemical's work plan focused its activities towards developing reviews of scientific information on lead and cadmium, focusing especially on long-range environmental transport.
In a sectorial manner, the United Nations Economic Commission for Europe (UNECE) designs regulations to safeguard the environment and human health, whilst promoting sustainable development in its member states.
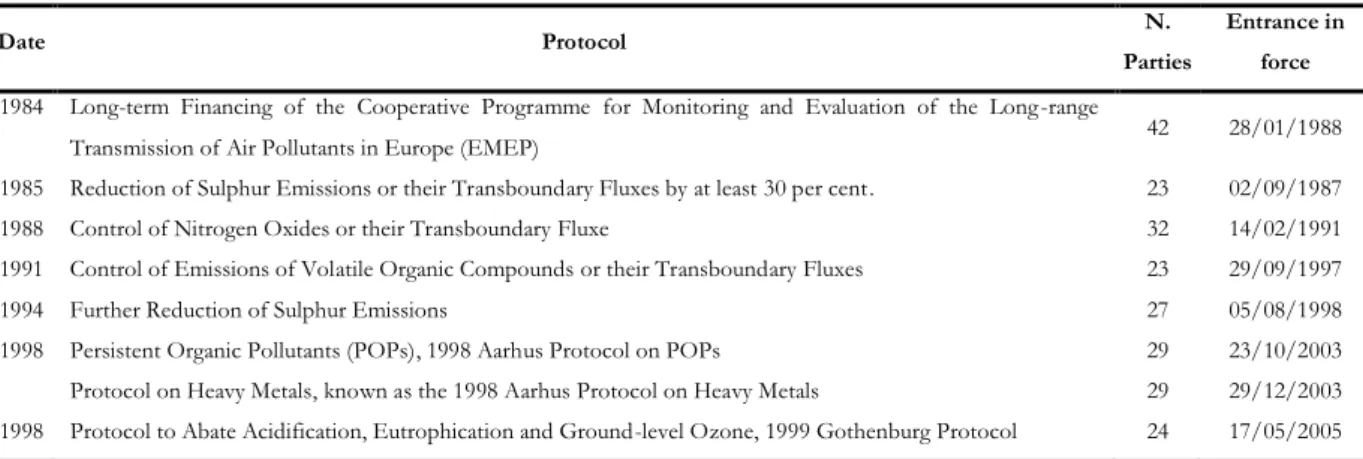
In 1979, it was launched the Convention on Long-Range Transboundary Air Pollution (CLRTAP), which since then addressed major environmental problems of the UNECE region through scientific collaboration and policy negotiation. The Convention has been extended by eight protocols, presented in Table 2.1, which identify specific measures to be taken by 51 Parties at the moment, to cut their emissions of air pollutants. The aim of the Convention is that Parties shall endeavor to limit and, as far as possible, gradually reduce and prevent air pollution including long-range transboundary air pollution. Parties develop policies and strategies to combat the discharge of air pollutants through exchanges of information, consultation, research and monitoring.
Table 2.1 - Protocols of the Convention on Long-Range Transboundary Air Pollution (CLRTAP).
Date Protocol N.
Parties
Entrance in force
1984 Long-term Financing of the Cooperative Programme for Monitoring and Evaluation of the Long-range
Transmission of Air Pollutants in Europe (EMEP) 42 28/01/1988 1985 Reduction of Sulphur Emissions or their Transboundary Fluxes by at least 30 per cent. 23 02/09/1987 1988 Control of Nitrogen Oxides or their Transboundary Fluxe 32 14/02/1991 1991 Control of Emissions of Volatile Organic Compounds or their Transboundary Fluxes 23 29/09/1997 1994 Further Reduction of Sulphur Emissions 27 05/08/1998 1998 Persistent Organic Pollutants (POPs), 1998 Aarhus Protocol on POPs 29 23/10/2003 Protocol on Heavy Metals, known as the 1998 Aarhus Protocol on Heavy Metals 29 29/12/2003 1998 Protocol to Abate Acidification, Eutrophication and Ground-level Ozone, 1999 Gothenburg Protocol 24 17/05/2005
Within the scope of CLRTAP it was created the EMEP - European Monitoring and Evaluation Programme (EMEP, 2008), in order to ―regularly provide Governments and subsidiary bodies under the LRTAP Convention with qualified scientific information to support the development and further evaluation of the international protocols on emission reductions negotiated within the Convention‖.
The EMEP Programme action includes the collection of emission data, measurements of air and precipitation quality and modelling of atmospheric transport and deposition of air pollution. Another mechanism that is important to consider is the Intergovernmental Panel on Climate Change (IPCC) that was established to provide decision makers and others interested entities in climate change with an objective source of information about climate change (IPCC, 2013). This UN's top scientific body, set in 1988, by the United Nations Environment Programme (UNEP) and the World Meteorological Organization (WMO), is a scientific inter-governmental body. The IPCC does not conduct any research nor monitors climate related data or parameters. Its role is to assess on a comprehensive, objective, open and transparent basis to the latest scientific, technical and socio-economic literature produced worldwide relevant to understanding the risk of human-induced climate change.
The findings of the first IPCC Assessment Report of 1990 played a decisive role in leading to the United Nations Framework Convention on Climate Change (UNFCCC), which was opened for signature in the Rio de Janeiro Summit in 1992 and entered into force in 1994. It provided the overall policy framework for addressing the climate change issue. The IPCC Second Assessment Report of 1995 provided key input for the negotiations of the Kyoto Protocol in 1997 and the Third Assessment Report of 2001, as well as the Special and Methodology Reports provided further information relevant for the development of the UNFCCC and the Kyoto Protocol.
In 2007 it was released the Fourth Assessment Report, which represents the IPCC‘s most comprehensive and definitive statement to date on climate change. The main conclusions are (IPCC, 2013):
a) There is strong certainty that most of the observed warming of the past half-century is due to human influences, and a clear relationship between the growth in manmade greenhouse gas emissions and the observed impacts of climate change;
b) The climate system is more vulnerable to abrupt or irreversible changes than previously thought;
c) Avoiding the most serious impacts of climate change, i.e. including irreversible changes, will require significant reductions in greenhouse gas emissions;
d) Mitigation efforts must also be combined with adaptation measures to minimize the risks of climate change.
The Fifth Assessment Report (AR5) is expected between released in four parts between September 2013 and November 2014 and will be the most comprehensive assessment of scientific knowledge on climate change since 2007.
The IPCC continues to be a major source of information for the negotiations under the UNFCCC.
2.2.2 European Union
The industrial energy sector is one of the major contributors for the emission of most atmospheric pollutants. In order to achieve a reduction of the environmental impact of the industrial energy sector, legislation initiatives have been promoted both at a National and European levels. However, legislation to be applied with success need to be both technical and economically applicable, to guarantee the environmental benefits without the need to close industrial units, which will have a very negative social impact. Flexible goals and voluntary agreements have proved to be successfull as it allows adequate adaptations of each involved partner ensuring the maintenance of their competitiveness. Alternatively, the definition of incentives also have been leading to good results in terms of compliance wit restricted emnission limits, which most likely will lead to environmental benefits.
Considering that one of the main goals of the European Union is the protection of the environment, as presented in the Article 175 EC, the European Parliament and Council aim at the definition of a comprehensive legal framework for the reduction of industrial emissions. The most recent approach has been the definition of a simplified model, which combines several formerly existing directives into a single document (Directive 2010/75/EC).
Setting up goals with the objective to improve ambient air quality, should also consider harmonization within Europe with the definition of common analysis methods and evaluation criteria. This can provide enough information on air quality, ensuring that the information provided on air quality status is exact, together with emergency alerts when any pollutant exceeds its predefined maximum levels.
A detailed collection of the most recent European Union directives that are related with environmental protection and improvement of air quality is presented below.
Directive 96/62/EC, 27 September 1996: Ambient air quality assessment and management This directive was applied in the initial stage to pollutants like SO2, NOx, fine particulate matter, Lead and Ozone. Other air pollutants to be controlled include Benzene, Carbon monoxide, Poly-aromatic hydrocarbons and other elements like Cadmium, Arsenic, Nickel and Mercury. These limit levels must consider the specific conditions of each zone like the
population density, climatic conditions, sensitivity of flora and fauna, the possibility of long-range transport and the economic and technical feasibility.
Directive 1999/13/EC (VOC Directive), 11 March 1999: Limitation of emissions of volatile organic compounds due to the use of organic solvents in certain activities and installations This Directive aims the prevention and reduction of the effects and risks to human health of emissions into air of Volatile Organic Compounds (―VOCs‖). It applies to a large range of industries using solvents.
Directive 1999/30/EC, 22 April 1999: Limit values for sulphur dioxide, nitrogen dioxide and oxides of nitrogen, particulate matter and lead in ambient air
This Directive establishes the emission limits and threshold levels required to the prevention and reduction of the effects and risks to human health. It defines the maximum concentrations of each of these pollutants, with regard to different averaging periods between 1 hour and 1 calendar year.
Directive 2000/76/EC (Waste Incineration Directive), 4 December 2000: The incineration of waste
This Directive extends previously existing legislation on non-hazardous municipal waste, to the incineration of non-hazardous non-municipal waste (like sewage sludge, tyres and hospital waste) and hazardous wastes like waste oils and solvents.
Directive 2001/80/EC (LCP Directive), 23 October 2001: Limitation of emissions of certain pollutants into the air from large combustion plants
This Directive applies to combustion plants with more than 50 MW of thermal input, using solid, liquid or gaseous fuels. It contains detailed tables for limits of SO2, NOX and dust emissions that will be applied to new or existing plants. These limits depend mainly on the kind of fuel (solid, liquid or gaseous) or fuels obtained from other industrial processes like the gasification of coal, biomass or refinery residues. Some exceptions are also made for some European Countries and for some specific industrial units. The Directive defines also the procedures for measuring and evaluating emissions and for the determination of total annual emissions from combustion plants.
Directive 2004/107/EC, 15 December 2004: Limitation of emissions of arsenic, cadmium, mercury, nickel and polycyclic aromatic hydrocarbons in ambient air
Following previous scientific evidence on the genotoxic carcinogenic effects on humans of arsenic, cadmium, mercury, nickel and polycyclic aromatic hydrocarbons (PAHs), this directive establishes maximum levels to be accepted on ambient air.