Versão impressa ISSN 1676-689X / Versão on line ISSN 1980-6477 http://www.abms.org.br
MATHEMATICAL MODELING OF DRYING MAIZE GRAINS IN DIFFERENT TEMPERATURES
PAULO CARTERI CORADI1, LÉLIA VANESSA MILANE2,
CHARLES FABIAN DIAS3, FÁBIO HENRIQUE ROJO BAIO4
1Federal University of Mato Grosso do Sul (UFMS), Campus of Chapadão do Sul, Chapadão do Sul, MS, paulo.coradi@ufms.br; 2Federal University of Mato Grosso do Sul (UFMS), Campus of Chapadão do Sul;
3Federal University of Mato Grosso do Sul (UFMS), Campus of Chapadão do Sul; 4Federal University of Mato Grosso do Sul (UFMS), Campus of Chapadão do Sul
Revista Brasileira de Milho e Sorgo, v.14, n.2, p. 247-259, 2015
ABSTRACT - The need to maintain the quality of the maize grains during the drying evidences the importance of to
know the processes that occur at this stage. The objective of this study was to model the drying of grains at different air temperatures. Drying was carried out at three temperatures (80, 100 and 120oC) in an oven with forced air circulation
and convection. In order to adjust the mathematical models to the experimental data, non-linear regression analysis was accomplished using the Statistica 7.0® program. It was observed that the higher the temperature of the drying air
(120°C) the faster the product reached the equilibrium moisture content. The Midilli model was the best to define the corn drying curves at air temperatures of 80, 100 and 120°C. The effective diffusivity obtained from the drying of corn was higher (5.4 x 10⁻¹³ m2 s-1) at a temperature of 120°C. In conclusion, drying the grain at higher temperatures (above
100°C) also increased the isosteric desorption energy (3885 kJ kg-1) to carry out the process.
Key words: agricultural crop, post-harvest, optimization, simulation, Zea mays L.
MODELAGEM MATEMÁTICA DA SECAGEM DE GRÃOS DE MILHO EM DIFERENTES TEMPERATURAS
RESUMO - A necessidade de manter a qualidade dos grãos de milho durante a secagem torna-se de relevante
importância no conhecimento dos fenômenos que ocorrem nesta etapa. Assim, o objetivo deste estudo foi modelar a secagem de grãos de milho em diferentes temperaturas do ar. A secagem foi realizada com três temperaturas de secagem (80, 100 e 120oC) em estufa com circulação do ar forçado e convecção. Para o ajuste dos modelos matemáticos aos
dados experimentais, realizou-se análise de regressão não-linear, através do programa computacional Statistica 7.0®.
Observou-se que, quanto maior foi a temperatura do ar de secagem (120°C), mais rápido o produto atingiu o teor de água de equilíbrio. Verificou-se que o modelo de Midilli foi o melhor para definir as curvas de secagem do milho nas temperaturas do ar de 80, 100 e 120°C. A difusividade efetiva obtida a partir da secagem do milho foi maior (5.4 x 10⁻¹³
m2 s-1) a uma temperatura de 120°C. Concluiu-se que a secagem dos grãos de milho com temperaturas mais elevadas
(acima de 100°C) também aumentou a energia de dessorção isostérica (3885 kJ kg-1) para realizar o processo.
Coradi et al.
248
Corn (Zea mays L.) is a native crop of Central America, grown in much of the world and its economic importance is evidenced by the various forms of use, whether in animal or human consumption. Drying of agricultural products is the most used process to ensure quality and stability, whereas the decrease in the amount of the material water reduces biological activity and chemical and physical changes that occur during storage (Brooker et al., 1992).
Moreover, this drying air in the form of water vapor also exerts a partial pressure designated partial pressure of water vapor in air (Coradi et al. 2014a). Thus, the drying process aims to partial removal of water from the grains, through the simultaneous transfer of heat from the air to the kernels and mass flow through the water vapor, the beans into the air (Goneli et al., 2011). According to Corrêa et al. (2010), information about the behavior of the phenomenon of heat and mass transfer between the biological material and the element of drying are essential for design, operation simulations of drying, dryers and grain quality systems.
The simulation study of the grain drying under constant external conditions, for a given processing time can be divided into two main groups: empirical and theoretical models (Coradi et al., 2014b). Theoretical models consider the internal resistance and the heat and mass transfer between the product and the hot air. Since the empirical usually based on the product external variables such as temperature and relative humidity of the drying air. However, no indication on energy and mass transport phenomena inside the grains and consider that all the drying process occurs only in the falling rate period (Resende et al., 2008).
The water can move inside the material by different mechanisms. In porous hair care products,
as most agricultural products, possible water transport mechanisms are: liquid diffusion; capillary diffusion; diffusion on the surface; hydrodynamic flow; vapor diffusion; and thermal diffusion (Niamnuy et al., 2012).
The theory of liquid diffusion assumes that there is no influence of capillary despises the effects of energy and mass transfer from one body to another and also considers that the bodies come into thermal equilibrium with the air instantly, which may lead to discrepancies between results (Niamnuy et al., 2012).
It can be said that the diffusivity is the ease way which water is removed from the material. As the diffusivity varies change the drying conditions, and this is not intrinsic to the material, convention to call it the effective diffusivity (Niamnuy et al., 2012). The effective diffusion coefficient can be used when the grains are considered homogeneous material. Countless studies have been conducted in order to identify the characteristics of various agricultural products during drying, such as turnip (Sousa et al, 2011.) crambe (Costa et al, 2011.); and corn on the cob (Corrêa et al., 2011).
The study drying systems, their dimensioning, optimization and determining the feasibility of its commercial application can be made by mathematical simulation, whose principle is based on the successive thin layers drying the product, using a mathematical model that is satisfactorily water loss. The use of mathematical models to simulate the drying process dryers operating at high temperature is an important tool for engineers working in the field of drying and storing grains (Corrêa et al., 2010; Goneli et al, 2011; Coradi et al., 2014b). There are numerous kinetic models drying. Thus, the objective of this study was to model the drying of corn grains in different temperature of the air.
Revista Brasileira de Milho e Sorgo, v.14, n.2, p. 247-259, 2015
Versão impressa ISSN 1676-689X / Versão on line ISSN 1980-6477 - http://www.abms.org.br
Material and Methods
The experiment was conducted at the Federal University of Mato Grosso do Sul (UFMS), Campus of Chapadão do Sul (CPCS), Postharvest of Agricultural Products Laboratory, in the year at 2014. The corn grains were harvested at random with 21.5% (w.b.) of water content, and possession of specimen’s manual separation of impurities was taken damaged grains. Then, the grains were dried in a convection oven with forced air ventilation at temperatures of 80, 100 and 120°C. Drying was carried out until the seeds reach the hygroscopic moisture balance. For each temperature of the drying air three tests were performed and for each test, 2 kg of corn grains
were used. The temperature and relative humidity were studio monitors, throughout drying with the aid of a psychrometer.
The water content of grains (% w.b.) was determined by weighing 15 g of sample. Then, the samples were placed in an oven with air heating and ventilation regulated at 103 °C ± 1 °C for 24 h, according to the recommendations of (Brazil, 2009). After the samples were removed and placed in desiccators for cooling. The water content (% w.b.) was determined by mass difference between the initial and the final sample. Tests were performed in three replicates.
The drying curves were fitted to the experimental data using thirteen different semi-empirical and empirical equations discriminated below:
Equation
Model
k
t
exp
RU
Newton
(1)
k
t
n
exp
RU
Page
(2)
k
t
n
exp
RU
Page Modified
(3)
Henderson and Pabis
(4)
kt
c
aexp
RU
Logarithmic
(5)
k
t
b
exp
k
t
exp
a
RU
o
1
Two Terms
(6)
k
t
1
a
exp
k
a
t
exp
a
RU
Two Exponential Terms
(7)
2
RU 1 a t b t
Wang and Singh
(8)
k
t
b
exp
k
t
c
exp
k
t
exp
a
RU
o
1
Henderson and
Pabis Modified
(9)
k
t
b
t
exp
a
RU
n
Midilli
(10)
RU a exp k t
1 a exp k b t
Diffusion approximation
(11)
wherein,
RU: moisture ratio (dimensionless),
t: drying time (h),
k, k
o, k
1: drying constant (h
-1),
a, b, c: model coefficients,
n: number of terms of the equation,
D: diffusion coefficient (m
2s
-1),
L: product thickness (m).
For determining the ratios of moisture during drying air under different conditions it was
used the following expression:
* * e * * i e
U U
RU
U U
(12)
wherein,
U* = water content of product (d.b.),
Ui* = initial water content of the product (d.b.),
Ue* = equilibrium water content of the product (d.b.).
It is usual to consider the value of the diffusion coefficient constant or linearly
dependent on the temperature of the air drying. This relationship has been expressed by the
Arrhenius model (Mohapatra & Rao, 2005).
k
t
exp
a
RU
Coradi et al.
250
wherein,
RU: moisture ratio (dimensionless), t: drying time (h),
k, ko, k1: drying constant (h-1),
a, b, c: model coefficients,
n: number of terms of the equation, D: diffusion coefficient (m2 s-1),
L: product thickness (m).
For determining the ratios of moisture during drying air under different conditions it was used the following expression:
(12) wherein,
U* : water content of product (d.b.),
Ui* : initial water content of the product (d.b.), Ue* : equilibrium water content of the product (d.b.).
It is usual to consider the value of the diffusion coefficient constant or linearly dependent on the temperature of the air drying. This relationship has been expressed by the Arrhenius model (Mohapatra & Rao, 2005).
(13) wherein,
A : constant (m2 s-1),
E : activation energy (kJ kmol-1),
R : universal gas constant (8,314 kJ kmol-1
K-1),
Tabs : absolute temperature (K).
The coefficients of the Arrhenius expression were linearized by applying the logarithm of the form:
(14) The values of water activity, temperature, and water content equilibrium was obtained from the corn grains desorption isotherms, using the model that best fit the experimental data. The dynamic-gravimetric method was used to obtain the corn grains water content in hygroscopic equilibrium (Coradi et al., 2014a). For the calculation of the integral isosteric heat of desorption it was used the following equation:
st *e
Q = q + L = a exp(-b U ) + L
st
⋅
⋅
(15)
wherein,
Qst : integral isosteric heat of sorption (kJ kg-1),
L : latent heat of vaporization of free water (kJ kg-1),
Ue* : equilibrium water content (d.b.), a, b : coefficient model.
The free water latent heat of vaporization was obtained using the average temperature by the following equation:
m
L = 2502,2 - 2,39.T
(16)
wherein,
L : latent heat of vaporization of free water (kJ kg-1),
T m : average temperature (°C).
To adjust the mathematical models of analysis drying grains were performed nonlinear regression, Quasi-Newton method, using the computer program Statistica 7.0®. To check the degree of fit of each
model was considered the significance of the regression coefficient by t-test, adopting the 5% level of probability, the magnitude of the coefficient of determination (R2), the mean relative error values
(P) and the average estimated error (SE) and verified the behavior of distribution of residuals. The relative
* * e * * i e
U
U
RU
U
U
−
=
−
exp E D A RT = − E 1 LnD = LnA RT TaRevista Brasileira de Milho e Sorgo, v.14, n.2, p. 247-259, 2015
Versão impressa ISSN 1676-689X / Versão on line ISSN 1980-6477 - http://www.abms.org.br
average error and the average error estimated for each model were calculated according to the following expressions, respectively:
∑
−
=
Y
Yˆ
Y
n
100
P
(17)
(
)
GLR
Yˆ
Y
SE
2∑
−
=
(18)
wherein,Y : experimentally observed value;
Yˆ
: value calculated by the model;
n :
number of experimental observations;
GLR: degrees of freedom of the model (the
number of observations minus the number
of model parameters).
Results and Discussion
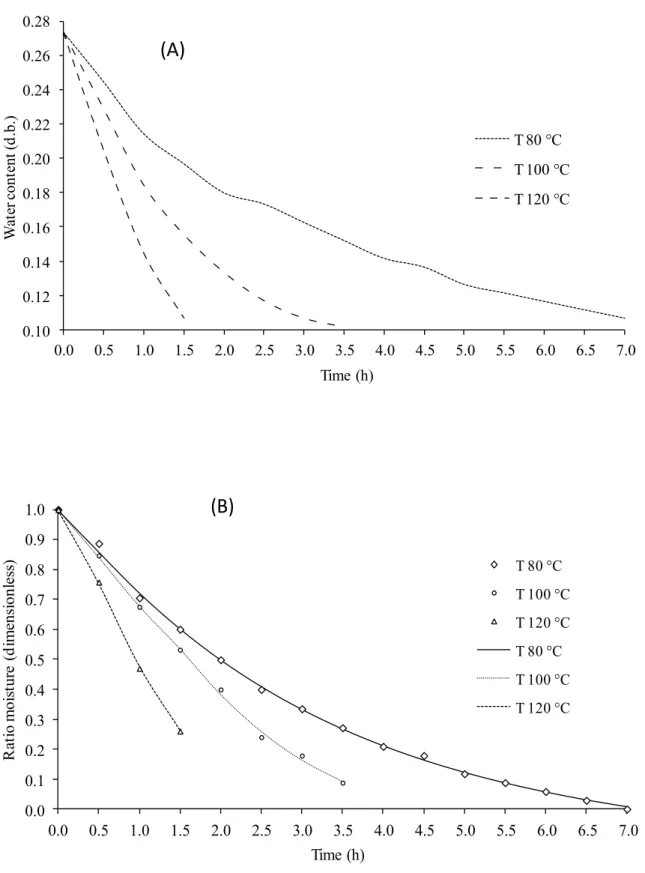
Figure 1 shows the average values of the moisture content of corn kernels submitted to different drying conditions. It can be seen in Figure 1A, the time required for the corn kernels reach the equilibrium water content was 1.5, 3.5 and 7.0 h for drying temperatures of 120, 100 and 80°C respectively. Note also that with the increase of the drying air temperature was increased product water removal rate. Therefore, the temperature increase caused a reduction in the drying time of corn, evidencing the increased drying rate, which was observed by various investigators for many agricultural products (Goneli et al 2011; Coradi et al., 2014a). As the drying process continues toward the equilibrium water content, the drying representative curves are similar, differing in the time of drying.
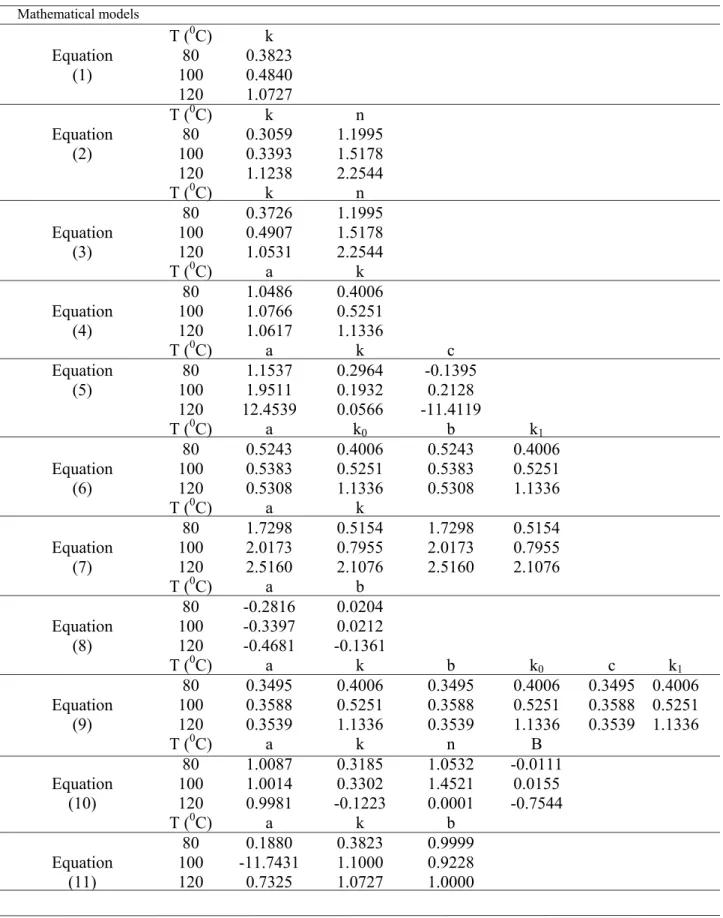
The coefficients of the models adjusted for corn grains, analyzed during drying at different drying air temperatures are in the Table 1. Among the models that gave good statistics results (Table 2), the Midilli model was selected to represent the phenomenon of drying corn grains due to its simplicity compared to other models and also was selected to present a number of significant coefficients according study realized by Santos et al. (2014). From Midilli model, it was observed that the drying coefficients “k”, “a”, and “b” increased with increasing temperature, while the constant “n” decreased with increasing temperature. The coefficients “k”, “a”, and “ b” represent the effects of external drying conditions, according to Babalis et al. (2004), the constant “k”, “a”, and “b” can be used as an approach to characterize the effect of temperature related to the effective diffusivity in the drying process period and the descending liquid diffusion controlling the process. While the constant “n” reflects the internal strength of the product drying. The coefficient of determination is a good parameter to check the fit of nonlinear models and typically has higher values for the models that best fit the experimental data. It appears that all the mathematical models had coefficients of determination (R2) greater
than 98%, indicating according to Madamba et al. (1996), Mohapatra & Rao (2005), a satisfactory representation of the drying process. However, it is emphasized that the model Midilli showed the highest determination coefficient values (Table 2), the results found by Radünz et al., (2010). It is also noted that all of the models showed average values of relative error less than 10% for the four conditions tested, indicating as Mohapatra & Rao (2005), are suitable for representing the phenomenon.
As the estimated average error (SE), all models had low values near zero, representing good fit SE
Coradi et al.
252
behavior of distribution of residuals. The relative average error and the average error
estimated for each model were calculated according to the following expressions,
respectively:
Y
Yˆ
Y
n
100
P
(17)
GLR
Yˆ
Y
SE
2
(18)
wherein,
Y:
experimentally observed value;
Yˆ :
value calculated by the model;
n :
number of experimental observations;
GLR:
degrees of freedom of the model (the number of observations minus the number
of model parameters).
Results and Discussion
Figure 1 shows the average values of the moisture content of corn kernels submitted to
different drying conditions. It can be seen in Figure 1A, the time required for the corn kernels
reach the equilibrium water content was 1.5, 3.5 and 7.0 h for drying temperatures of 120, 100
and 80°C respectively. Note also that with the increase of the drying air temperature was
increased product water removal rate. Therefore, the temperature increase caused a reduction
in the drying time of corn, evidencing the increased drying rate, which was observed by
various investigators for many agricultural products (Goneli et al 2011; Coradi et al., 2014a).
As the drying process continues toward the equilibrium water content, the drying
representative curves are similar, differing in the time of drying.
0.10 0.12 0.14 0.16 0.18 0.20 0.22 0.24 0.26 0.28 0.0 0.5 1.0 1.5 2.0 2.5 3.0 3.5 4.0 4.5 5.0 5.5 6.0 6.5 7.0 W at er cont ent (d .b.) Time (h) T 80 °C T 100 °C T 120 °C 0.0 0.1 0.2 0.3 0.4 0.5 0.6 0.7 0.8 0.9 1.0 0.0 0.5 1.0 1.5 2.0 2.5 3.0 3.5 4.0 4.5 5.0 5.5 6.0 6.5 7.0 R at io mo ist ur e (d ime ns io nle ss ) Time (h) T 80 °C T 100 °C T 120 °C T 80 °C T 100 °C T 120 °C
(A)
(B)
Revista Brasileira de Milho e Sorgo, v.14, n.2, p. 247-259, 2015
Versão impressa ISSN 1676-689X / Versão on line ISSN 1980-6477 - http://www.abms.org.br
TABLE 1. Parameters obtained from models fitted to the data for drying of corn grains.
Mathematical models T (0C) k Equation (1) 100 80 0.3823 0.4840 120 1.0727 T (0C) k n Equation (2) 100 80 0.3059 0.3393 1.1995 1.5178 120 1.1238 2.2544 T (0C) k n Equation (3) 80 0.3726 1.1995 100 0.4907 1.5178 120 1.0531 2.2544 T (0C) a k Equation (4) 80 1.0486 0.4006 100 1.0766 0.5251 120 1.0617 1.1336 T (0C) a k c Equation (5) 100 80 1.1537 1.9511 0.2964 0.1932 -0.1395 0.2128 120 12.4539 0.0566 -11.4119 T (0C) a k 0 b k1 Equation (6) 80 0.5243 0.4006 0.5243 0.4006 100 0.5383 0.5251 0.5383 0.5251 120 0.5308 1.1336 0.5308 1.1336 T (0C) a k Equation (7) 80 1.7298 0.5154 1.7298 0.5154 100 2.0173 0.7955 2.0173 0.7955 120 2.5160 2.1076 2.5160 2.1076 T (0C) a b Equation (8) 80 -0.2816 0.0204 100 -0.3397 0.0212 120 -0.4681 -0.1361 T (0C) a k b k0 c k1 Equation (9) 80 0.3495 0.4006 0.3495 0.4006 0.3495 0.4006 100 0.3588 0.5251 0.3588 0.5251 0.3588 0.5251 120 0.3539 1.1336 0.3539 1.1336 0.3539 1.1336 T (0C) a k n B Equation (10) 80 1.0087 0.3185 1.0532 -0.0111 100 1.0014 0.3302 1.4521 0.0155 120 0.9981 -0.1223 0.0001 -0.7544 T (0C) a k b Equation (11) 80 0.1880 0.3823 0.9999 100 -11.7431 1.1000 0.9228 120 0.7325 1.0727 1.0000
Coradi et al.
254
models to experimental data. According to Draper & Smith (1988), the ability of a model to represent adequately a given physical process is inversely proportional to the estimated average error value. With the analysis of statistical parameters, it appears that all models showed good fits to the experimental data. However, Midilli model was selected to represent the phenomenon of drying of maize grains, as had the highest R2 values, and smaller P, SE, for all
temperatures studied.
Figure 1B the drying curves for the corn grains adjusted by the Midilli model at temperatures of 80, 100 and 120°C. It is found that the satisfactory adjustment was predicted by Midilli curves to the experimental data model, regardless of the conditions tested (Figure 2). The successful tuning obtained by Midilli model occurred due to the drying of corn grains have occurred in the falling rate period, wherein the greater resistance to heat and mass transfer occurs from the product to the surface, and therefore, broadcasting the primary mechanism to govern the movement of water. It appears that during the drying the effective diffusion coefficient increased significantly (P<0.05), with the rise of temperature and increase (Figure 3A), agreement with results obtained by other researchers (Siqueira et al., 2012; Goneli et al., 2014). According to Siqueira et al. (2012), the higher the temperature of the drying air, the smaller the grain’s resistance to removal of water, then the diffusivity is higher.
The grain diffusion coefficients provided magnitudes between 4.5 x 10⁻¹³ and 5.4 x 10⁻¹³ m2
s-1. These values are consistent with those reported
by Corrêa et al. (2006) evaluated beans are presented in the order of 2.21 x 10⁻¹⁰ to 9.08 x 10⁻¹⁰ m2 s-1,
considering the shrinkage of grains and between 2.77 x 10 -10. However, Santos et al. (2014) found in corn grain
(Pioneer P3646) magnitude of diffusion coefficients
between 2.54 x 10-09 to 8.91 x 10-09 m2 s-1 using the
initial equivalent diameter of the grains or neglecting the volume reduction of the product during drying and between 2.66 x 10-09 to 8.91 x 10-09 m2 s-1, considering
the shrinkage of the grain. However, with increasing temperature, the values of the diffusion coefficient increased significantly, confirming the results reported by Doymaz & Pala (2003) for okra, ranging from 4.27 x 10⁻¹⁰ to 1.30 x 10-09 m2 s-1 for the temperature
range between 50 and 70 °C. The dependence of the effective diffusion coefficient of corn grain with respect to the drying air temperature is represented by the Arrhenius expression (Figure 3B). It is observed that the values of Ln (D) as a function of the inverse absolute temperature (1/Ta) show different behavior to the ranges of temperatures.
As the activation energy indicates the ease with which water molecules overcome the energy barrier for migration within the product, the lower the activation energy of the higher diffusivity of water in the product (Doymaz & Pala, 2003; Santos et al., 2014). Siqueira et al. (2012) explain that the smaller the higher activation energy is the rate at which water is removed from the material, indicating that the products with higher water contents, present lower activation energy.
In this study, the activation energy for drying corn phenomenon was 3775 to 3855 kJ kg -1, respectively, for the temperature range studied.
According to Zogzas et al. (1996), the activation energy for agricultural products ranges from 12.7 to 110 kJ mol-1. Thus, it can be inferred that there
was no interference of external conditions drying temperatures. The activation energy found increased with the increase of air temperature of drying (Figure 4). The activation energy is a barrier that must be overcome so that the diffusion process can be triggered in the product (Kashaninejad et al., 2007).
Revista Brasileira de Milho e Sorgo, v.14, n.2, p. 247-259, 2015
Versão impressa ISSN 1676-689X / Versão on line ISSN 1980-6477 - http://www.abms.org.br
Mathematical modeling of drying maize grains in... 255
that all the mathematical models had coefficients of determination (R2) greater than 98%,
indicating according to Madamba et al. (1996), Mohapatra & Rao (2005), a satisfactory representation of the drying process. However, it is emphasized that the model Midilli showed the highest determination coefficient values (Table 2), the results found by Radünz et al., (2010). It is also noted that all of the models showed average values of relative error less than 10% for the four conditions tested, indicating as Mohapatra & Rao (2005), are suitable for representing the phenomenon.
TABLE 2. Coefficient of determination (R2), mean relative error (P), estimated values of
average error (SE) drying of corn grains due to different temperatures.
Mathematical models 80 0C 100 0C 120 0C R2 (%) k t exp RU 99.33 99.67 98.70
k tn
exp RU 99.81 99.92 99.42
n
t k exp RU 99.81 99.92 99.42 99.48 98.24 98.00 kt c aexp RU 99.94 99.70 99.42 k t b exp k t exp a RU o 1 99.48 98.24 98.10 k t 1 aexp k a t exp a RU 99.80 99.83 98.56 2 RU 1 a t b t 99.79 99.65 99.87 k t b exp k t c exp k t exp a RU o 1 99.49 98.24 98.10
k t
b t exp a RU n 99.96 99.94 99.99 RU a exp k t 1 a exp k b t 99.33 99.88 98.70 k t exp a RU SE (decimal) k t exp RU 0.0366 0.0722 0.1535
k tn
exp RU 0.0199 0.0137 0.0580
k t n
exp RU 0.0199 0.0137 0.0580 0.0304 0.0602 0.1768 kt c aexp RU 0.0831 0.0244 0.3817 k t b exp k t exp a RU o 1 0.0330 0.0737 0.2500 k t 1 aexp k a t exp a RU 0.0209 0.0206 0.0909 2 RU 1 a t b t 0.0215 0.0301 0.0259 k t b exp k t c exp k t exp a RU o 1 0.0365 0.1042 0.2500
k t
b t exp a RU n 0.0116 0.0151 0.0078 RU a exp k t 1 a exp k b t 0.0396 0.0196 0.2659 k t exp RU 18.43 14.89 06.34
k tn
exp RU 20.87 02.36 05.68
k t n
exp RU 20.87 02.36 05.68 27.36 04.37 12.28 kt c aexp RU 40.48 03.48 10.85 k t b exp k t exp a RU o 1 27.36 04.37 12.28 k t 1 aexp k a t exp a RU 21.37 06.86 55.14 2 RU 1 a t b t 13.69 13.33 02.70 k t b exp k t c exp k t exp a RU o 1 27.36 04.37 07.35
k t
b t exp a RU n 03.80 01.53 02.15 RU a exp k t 1 a exp k b t 18.43 05.26 08.31 k t exp RU T T A
k tn
exp RU A A A
k t n
exp RU T A A A T A kt c aexp RU A A A k t b exp k t exp a RU o 1 T T A k t 1 aexp k a t exp a RU A A A 2 RU 1 a t b t A A A k t b exp k t c exp k t exp a RU o 1 T T A
k t
b t exp a RU n A A A RU a exp k t 1 a exp k b t T A AAs the estimated average error (SE), all models had low values near zero, representing good fit models to experimental data. According to Draper & Smith (1988), the ability of a model to represent adequately a given physical process is inversely proportional to the estimated average error value. With the analysis of statistical parameters, it appears that all models showed good fits to the experimental data. However, Midilli model was selected to
k t exp a RU k t exp a RU k t exp a RU
TABLE 2. Coefficient of determination (R2), mean relative error (P), estimated values of average error (SE)
drying of corn grains due to different temperatures.
P (%)
Revista Brasileira de Milho e Sorgo, v.14, n.2, p. 247-259, 2015
Versão impressa ISSN 1676-689X / Versão on line ISSN 1980-6477 - http://www.abms.org.br Coradi et al.
256
FIGURE 2. Experimental data and estimated the ratio moisture of corn grains, calculated by the model of
Midilli.
grain. However, with increasing temperature, the values of the diffusion coefficient increased
significantly, confirming the results reported by Doymaz & Pala (2003) for okra, ranging from
4.27 x 10
-10to 1.30 x 10
-09m
2s
-1for the temperature range between 50 and 70 °C. The
dependence of the effective diffusion coefficient of corn grain with respect to the drying air
temperature is represented by the Arrhenius expression (Figure 3B). It is observed that the
values of Ln (D) as a function of the inverse absolute temperature (1/Ta) show different
behavior to the ranges of temperatures.
FIGURE 3. Mean values for the effective diffusion coefficient (m
2s
-1), due to different air
temperatures in the drying of corn grains (A), representation of the Arrhenius relationship for
the effective diffusivity and air temperature drying of corn grains (B).
As the activation energy indicates the ease with which water molecules overcome the
energy barrier for migration within the product, the lower the activation energy of the higher
diffusivity of water in the product (Doymaz & Pala, 2003; Santos et al., 2014). Siqueira et al.
(2012) explain that the smaller the higher activation energy is the rate at which water is
removed from the material, indicating that the products with higher water contents, present
lower activation energy.
In this study, the activation energy for drying corn phenomenon was 3775 to 3855 kJ
kg
-1, respectively, for the temperature range studied. According to Zogzas et al. (1996), the
activation energy for agricultural products ranges from 12.7 to 110 kJ mol
-1. Thus, it can be
inferred that there was no interference of external conditions drying temperatures. The
activation energy found increased with the increase of air temperature of drying (Figure 4).
The activation energy is a barrier that must be overcome so that the diffusion process can be
triggered in the product (Kashaninejad et al., 2007).
D = 0.45 T + 4.0333 R² = 0.9959 4,30 4,50 4,70 4,90 5,10 5,30 5,50 80 100 120 D x 10 -13 (m ² s -1) Temperature (0C) ln D = 0.0118 T - 12.786 R² = 0.9786 -28,450 -28,400 -28,350 -28,300 -28,250 -28,200 28,30 26,80 25,40 ln D 1/T x 10-4 (K-1) (A) (B)
FIGURE 3. Mean values for the effective diffusion coefficient (m2 s-1), due to different air temperatures in
the drying of corn grains (A), representation of the Arrhenius relationship for the effective diffusivity and air temperature drying of corn grains (B).
grain. However, with increasing temperature, the values of the diffusion coefficient increased
significantly, confirming the results reported by Doymaz & Pala (2003) for okra, ranging from
4.27 x 10
-10to 1.30 x 10
-09m
2s
-1for the temperature range between 50 and 70 °C. The
dependence of the effective diffusion coefficient of corn grain with respect to the drying air
temperature is represented by the Arrhenius expression (Figure 3B). It is observed that the
values of Ln (D) as a function of the inverse absolute temperature (1/Ta) show different
behavior to the ranges of temperatures.
FIGURE 3. Mean values for the effective diffusion coefficient (m
2s
-1), due to different air
temperatures in the drying of corn grains (A), representation of the Arrhenius relationship for
the effective diffusivity and air temperature drying of corn grains (B).
As the activation energy indicates the ease with which water molecules overcome the
energy barrier for migration within the product, the lower the activation energy of the higher
diffusivity of water in the product (Doymaz & Pala, 2003; Santos et al., 2014). Siqueira et al.
(2012) explain that the smaller the higher activation energy is the rate at which water is
removed from the material, indicating that the products with higher water contents, present
lower activation energy.
In this study, the activation energy for drying corn phenomenon was 3775 to 3855 kJ
kg
-1, respectively, for the temperature range studied. According to Zogzas et al. (1996), the
activation energy for agricultural products ranges from 12.7 to 110 kJ mol
-1. Thus, it can be
inferred that there was no interference of external conditions drying temperatures. The
activation energy found increased with the increase of air temperature of drying (Figure 4).
The activation energy is a barrier that must be overcome so that the diffusion process can be
triggered in the product (Kashaninejad et al., 2007).
D = 0.45 T + 4.0333 R² = 0.9959 4,30 4,50 4,70 4,90 5,10 5,30 5,50 80 100 120 D x 10 -13 (m ² s -1) Temperature (0C) ln D = 0.0118 T - 12.786 R² = 0.9786 -28,450 -28,400 -28,350 -28,300 -28,250 -28,200 28,30 26,80 25,40 ln D 1/T x 10-4 (K-1) (A) (B)
Revista Brasileira de Milho e Sorgo, v.14, n.2, p. 247-259, 2015
Versão impressa ISSN 1676-689X / Versão on line ISSN 1980-6477 - http://www.abms.org.br
Conclusion
The higher the temperature of the drying air (120°C) the faster the product has reached the level the balance water. The Midilli model was the best set the drying curves of corn, for air temperatures of 80, 100 and 120 °C.
The effective diffusivity obtained from the drying of corn was higher (5.4 x 10⁻¹³ m2 s-1) to a
temperature of 120°C. The drying of the corn grains with higher temperatures (above 100 °C) also increases the amount of energy (3885 kJ kg-1), ie, the isosteric
heat desorption necessary to carry out the process.
Acknowledgement
The authors thank the UFMS – Federal University of Mato Grosso do Sul and the FUNDECT – MS - Foundation for Development Support of Education, Science and Technology of the State of Mato Grosso do Sul for financial support for the development of research.
References
BABALIS, S. J.; BELESSIOTIS, V. G. Influence of the drying conditions on the drying constants and moisture diffusivity during the thin-layer drying of figs. Journal of Food Engineering, Essex, v. 65, p. 449-458, 2004.
BRASIL. Ministério da Agricultura, Pecuária e Abastecimento. Secretaria de Defesa Agropecuária. Regras para analise de
sementes. Brasília, DF, 2009. 395 p.
BROOKER, D. B.; BAKKER-ARKEMA, F. W.; HALL, C. W. Drying and storage of grains
and oilseeds. Westport: AVI, 1992. 450 p.
CORADI, P. C.; MELO, E. C.; ROCHA, R. P. Evaluation of electrical conductivity as a quality parameter of lemongrass leaves (Cymbopogon
Citratus Stapf) submitted to drying process.
Drying Technology (Online), v. 32, n. 8, p.
969-980, 2014a.
CORADI, P. C.; BORÉM, F. M.; REINATO, C. H. Coffee cherries drying process and the
FIGURE 4. Experimental values and estimated integral isosteric heat of sorption as a function of moisture
Coradi et al.
258
influence of environment relative humidity in the mathematical modeling, moisture content, and enthalpy of vaporization. Energia na
Agricultura, Botucatú, v. 29, n. 2, p. 148-157,
2014b.
CORRÊA, P. C.; RESENDE, O.; RIBEIRO, D. M. Drying characteristics and kinetics of coffee berry. Revista Brasileira de Produtos
Agroindustriais, Campina Grande, v. 8, p.
1-10, 2006.
CORRÊA, P. C.; GONELI, A. L. D.; AFONSO JÚNIOR, P. C.; OLIVEIRA, G. H. H.; VALENTE, D. S. M. Moisture sorption isotherms and isosteric heat of sorption of coffee in different processing levels. International
Journal of Food Science and Technology,
Londres, v. 45, p. 2016-2022, 2010.
CORRÊA, P. C.; BOTELHO, F. M.; OLIVEIRA, G. H. H.; GONELI, A. L. G.; RESENDE, O.; CAMPOS, S. C. Mathematical modeling of the drying process of corn ears. Acta Scientiarum - Agronomy, Maringá, v. 33, p. 575-581, 2011. COSTA, L. M.; RESENDE, O.; SOUSA, K. A.;
GONÇALVES, D. N. Coeficiente de difusão efetivo e modelagem matemática da secagem de sementes de crambe. Revista Brasileira de
Engenharia Agrícola e Ambiental, Campina
Grande, v. 15, p. 1089-1096, 2011.
DOYMAZ, I.; PALA, M. The thin-layer drying characteristics of corn. Journal of Food
Engineering, Essex, v .60, p. 125-130, 2003.
DRAPER, N. R.; SMITH, H. Applied regression
analysis., 3th ed. New York: J. Wiley, 1998. 712
p.
GONELI, A. L. D.; CORRÊA, P. C.; MAGALHÃES, F. E. A.; BAPTESTINI, F. M. Contração volumétrica e forma dos frutos de mamona
durante a secagem. Acta Scientiarum.
Agronomy, Maringá, v. 33, n. 1, p. 1-8, 2011.
GONELI, A. L. D.; NASU, A. K.; GANCEDO, R.; ARAÚJO, W. D.; SARATH, K. L. L. Cinética de secagem de folhas de erva baleeira (Cordia
verbenacea DC.). Revista Brasileira de Plantas
Medicinais, Botucatu, v. 16, p. 434-443, 2014.
KASHANINEJAD, M.; MORTAZAVI, A.; SAFEKORDI, A.; TABIL, L. G. Thin-layer drying characteristics and modeling of pistachionuts. Journal of Food Engineering, Essex, v. 78, p. 98-108, 2007.
MADAMBA, P. S.; DRISCOLL, R. H.; BUCKLE, K. A. Thin-layer drying characteristics of garlic slices. Journal of Food Engineering, Essex, v. 29, p. 75-97, 1996.
MOHAPATRA, D.; RAO, P. S. A Thin layer drying model of parboiled wheat. Journal of Food
Engineering, Essex, v. 66, n. 4, p. 513-518,
2005.
NIAMNUY, C.; NACHAISIN, M.; POOMSA, N.; DEVAHASTIN, S. Kinetic modelling of drying and conversion / degradation of isoflavones during infrared drying of soybean. Food
Chemistry, Essex, v. 133, p. 946-952, 2012.
RESENDE, O.; CORRÊA, P. C.; GONELI, A. L. D.; BOTELHO, F. M.; RODRIGUES, S. Modelagem matemática do processo de secagem de duas variedades de feijão (Phaseolus
vulgaris L.). Revista Brasileira de Produtos
Agroindustriais, Campina Grande, v. 10, p.
17-26, 2008.
RADÜNZ, L. L.; MELO, E. C.; ROCHA, P. P.; BERBERT, P. A.; GRACIA, L. M. N. Study of essential oil from guaco leaves submitted to different drying air temperature. Engenharia na
Revista Brasileira de Milho e Sorgo, v.14, n.2, p. 247-259, 2015
Versão impressa ISSN 1676-689X / Versão on line ISSN 1980-6477 - http://www.abms.org.br
SANTOS, M. N. S.; OLIVEIRA, D. E. C.; RUFFATO, S.; PEREIRA, V. S. Cinética de secagem de grãos de milho da cultivar Pioneer P3646.
Global Science and Technology, Rio Verde,
v. 7, p. 119-129, 2014. Disponivel em: < http:// rv.ifgoiano.edu.br/periodicos/index.php/gst/ article/view/682>
SIQUEIRA, V. C.; RESENDE, O.; CHAVES, T. H. Difusividade efetiva de grãos e frutos de pinhão-manso. Semina: Ciências Agrárias, Londrina, v. 33, p. 2919-2930, 2012.
SOUSA, K. A.; RESENDE, O.; CHAVES, T. H.; COSTA, L. M. Cinética de secagem do nabo forrageiro (Raphanus sativus L.). Revista
Ciência Agronômica, Fortaleza, v. 2, p.
883-892, 2011.
ZOGZAS, N. P.; MAROULIS, Z. B.; MARINOS-KOURIS, D. Moisture diffusivity data compilation in food stuffs. Drying Technology, Rio Verde, v. 10, n. 14, p. 2225-2253, 1996. Disponivel em: < http://www.tandfonline.com/ doi/abs/ 10.1080/07373939608917205>