author
Gonçalo Nuno Beirão Rendeiro
tutored by
Flemming Nissen
presented on
August 25th, 2009
in
Southern Denmark University
Typeface:
titles
Myriad Pro®
rich text
Adobe™ Jenson Pro®
Colouring:
Pantone® Warm Red Quadchrome® Print
DANISH
ENERGY
MARKET
The Regulating Market & Renewable Energies
Electrical Power Engeneering Program
I am thankful to Th e Southern Denmark University for giving me this life changing experience which is the Erasmus Program.
To my supervisor Professor Flemming Nissen for all his support and for welcoming me so well.
To Henning Parbo, at Eneginet.dk, for all the help given when I needed and for the time spent with me.
To Ash for the company in the long working nights.
To my great friend João Saavedra for his patience helping me revising my speach.
And most of all, to my whole family for always being there and for everything they have done for me ever since I was born.
The Regulating Market & Renewable Energies
Since liberalization of electricity market in the Nordic countries, occurred in 90s, the Nordpool, created in 1996, has suff ered a huge progression in its installed capacity, on demand and, above all, in diff erent types of energy plants that are part of the electricity production system.
For the past 15 years, the concern regarding the
environment has grown and the politics around the Energy Market have changed with it. Th ere was also an imposition of limits on CO2 emissions that, if passed, countries would have had to pay fees. In this context, new ways of thinking about how to produce energy, and the need to start investing in renewable energies, such as wind power, emerged. A few years ago the above mentioned fees became stricter making the investments, which were already high, even higher. In Denmark, these investments start early, making Denmark by far the country with the highest share of its energy supply produced by wind turbines.
Th is study will observe the eff ects of having high wind power shares in the electricity supply system on the market prices.
Since the study will use the forecasted wind power instead of the produced wind power, it will look at how the Dk-West spot price varies with the injection of this energy and how this energy should be treated.
It will also observe the impact that the imbalances between the forecasts and the real values for wind power will have on the regulating market, and how these imbalances can be reduced.
Th e study also has a small analysis of how the imbalances between forecasts and real values can be reduced when the Elbas market is used.
In the end the study concludes that the forecasted wind power will aff ect the spot price and that the imbalances between that energy and the real wind power produced will not signifi cantly aff ect the regulating price.
Keywords: Wind Power; Wind Imbalances; Energy Markets.
Síntese/Abstract
Desde a liberalização do mercado energético nos países Nórdicos, anos 90, o Nordpool, criado em 1996, sofreu uma grande evolução na sua capacidade instalada, valores dos consumos e, acima de tudo, nos diferentes tipos de centrais eléctricas que fazem parte do sistema eléctrico de produção.
Nos últimos 15 anos, a preocupação pelo meio ambiente cresceu e as políticas relativas ao Mercado Energético mudaram com esta. Houve ainda uma imposição de limites às emissões de CO2 que, caso ultrapassados, teriam de ser pagas multas. Neste contexto, novas ideias sobre como abordar o sistema eléctrico de produção emergiram e com elas os investimentos em Energias Renováveis tais como a Energia Eólica. Mais tarde, os limites de CO2 fi caram mais restritos e isso levou a um aumento ainda maior dos mentos nas Energias Renováveis. Na Dinamarca os investi-mentos em Energia Eólica começaram na década de 80 e 90, o que fez com que o país seja o país com maior percentagem do seu consumo produzido por Energia Eólica.
Este estudo irá analisar os efeitos causados por um sistema com percentagens de Energia Eólica elevadas no Mercado de Electricidade nos preços dos mercados.
O estudo irá utilizar a Energia Eólica prevista e não a En-ergia Eólica produzida e irá avaliar como é que o preço do mercado Spot varia com a injecção desta.
Irá ainda observar o impacto dos erros nas previsões da Energia Eólica no preço do Mercado de Regulação.
O presente estudo inclui também uma pequena análise de como os erros das previsões da Eólica podem ser reduzidos apenas recorrendo ao Mercado de Ajustes (ELBAS).
No fi nal, o estudo conclui que a Energia Eólica prevista irá afectar o preço do mercado Spot e que os erros nas pre-visões desta energia não irão afectar signifi cativamente o preço do Mercado de Regulação.
Palavras Chave: Energia Eólica, Previsão de Eólica, Mercados Energéticos.
The Regulating Market & Renewable Energies
Acknowledgments Abstract List of Figures List of Graphics List of Tables Glossary Introduction Problem Description System DescriptionEnergy Market Description
Variables’ Description
Models
Consumption
Dk-West Spot Price Dk-West Regulating Price Down Regulation Up Regulation Conclusions References Appendix
Table of Contents
1. 1.1. 1.2. 1.3. 2. 3. 3.1. 3.2. 3.3. 3.3.1. 3.3.2. 4. ii iii vii xi xv xix 1 1 3 7 15 21 21 22 34 35 40 45 49 51Table of Contents
The Regulating Market & Renewable Energies
List of Figures
1. Introduction
1.2. System Description
Figure 1 - UCTE and Nordel Systems
Figure 2- HDVC (High Voltage Direct Current) Interconnections Between UCTE and Nordel Systems Figure 3 - Danish Transmission System Grid and interconnections to UCTE and Nordel Systems Figure 4 - Evolution of the Power Plants in Denmark from 1980 to 2000
Figure 5 - Grid connections to the off shore wind farms
Figure 6 - Distribution of Wind Turbines across DK-West zone
Figure 7 - Distribution of System Units across DK-West and DK-East in 2008 Figure 8 - Evolution of the Consumption and Production for DK-West
1.3. Energy Market Description
Figure 9 - Example of an Unbundled structure
Figure 10 - Example of Supply Curve for an Asymmetric Pool System
Figure 11 - Example of Supply and Demand Curve for a Symmetric Pool System Figure 12 - Example of Curves for System price and Dk-West price with bottlenecks Figure 13 - Example of Up- and Down-Regulation Curves at the NOIS List Figure 14 - Time-line for start and stop of the Reserves
Figure 15 - Time-line for start and stop of the Reserves Figure 16 - Timeline for the Nordpool Electricity Market
2. Variables’ Description
Figure 17 - Curve of power versus wind speed for a wind turbine
List of Figures
3 3 4 4 4 5 6 6 7 8 8 10 10 11 12 14 17Electrical Power Engeneering Program
3. Models
3.2. Dk-West Spot Price
Figure 18 - Example of Supply Curves for an hour of operation with and without Wind Energy Figure 19 - Example of Supply Curve for demand without wind energy
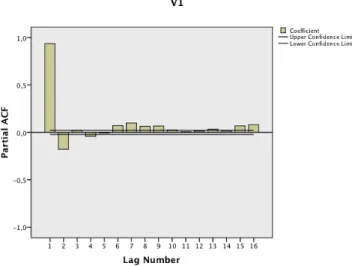
Figure 20 - Example of Dk-West spot price in function of wind energy Figure 21 - Autocorrelation Graphicic for Dk-West spot price Figure 22 - Partial Autocorrelation Graphicic for Dk-West spot price
3.3. Dk-West Regulating Price 3.3.1. Down Regulation
Figure 23 - Regulating Market scheme for variables
Figure 24 - Cross-correlation between Price for Down Regulate and Dk-West Spot Price - Full Data Figure 25 - Cross-correlation between Price for Down Regulate and Dk-West Spot Price - Limited Data Figure 26 - Cross-correlation between Price for Down Regulate and Wind Imbalances - Full Data Figure 27 - Cross-correlation between Price for Down Regulate and Wind Imbalances - Limited Data
Figure 28 - Cross-correlation between Price for Down Regulate and Consumption minus Wind Energy - Full Data Figure 29 - Cross-correlation between Price for Down Regulate and Consumption minus Wind Energy - Limited Data Figure 30 - Cross-correlation between Price for Down Regulate and the need for down regulation - Full Data
Figure 31 - Cross-correlation between Price for Down Regulate and the need for down regulation - Limited Data Figure 32 - Cross-correlation between Need for Down Regulate and Wind Imbalances - Full Data
3.3.2. Up Regulation
Figure 33 - Cross-correlation between Price for Up-Regulate and Dk-West Spot Price - Full Data Figure 34 - Cross-correlation between Price for Up-Regulate and Dk-West Spot Price - Limited Data
List of Figures
23 23 23 31 31 34 35 35 35 35 36 36 36 36 39 40 40The Regulating Market & Renewable Energies
Figure 35 - Cross-correlation between Price for Up-Regulate and Wind Imbalances - Full Data Figure 36 - Cross-correlation between Price for Up-Regulate and Wind Imbalances - Limited Data Figure 37 - Cross-correlation between Price for Up-Regulate and Consumption - Wind Energy - Full Data Figure 38 - Cross-correlation between Price for Up-Regulate and Consumption - Wind Energy - Limited Data Figure 39 - Cross-correlation between Price for Up-Regulate and Need for Up-Regulation- Full Data
Figure 40 - Cross-correlation between Price for Up-Regulate and Need for Up-Regulation - Limited Data
Appendix
Figure 41 - Autocorrelation Graphic for Mondays Data Figure 42 - Partial Autocorrelation Graphic for Mondays Data Figure 43 - Autocorrelation Graphic for Tuesdays Data Figure 44 - Partial Autocorrelation Graphic for Tuesdays Data Figure 45 - Autocorrelation Graphic for Wednesdays Data Figure 46 - Partial Autocorrelation Graphic for Wednesdays Data
Figure 47 - Autocorrelation Graphic for Th ursdays Data
Figure 48 - Partial Autocorrelation Graphic for Th ursdays Data
Figure 49 - Autocorrelation Graphic for Fridays Data Figure 50 - Partial Autocorrelation Graphic for Fridays Data Figure 51 - Autocorrelation Graphic for Saturdays Data Figure 52 - Partial Autocorrelation Graphic for Saturdays Data Figure 53 - Autocorrelation Graphic for Sundays Data Figure 54 - Partial Autocorrelation Graphic for Sundays Data
List of Figures
40 40 41 41 41 41 54 54 56 56 57 57 59 59 61 61 63 63 64 64The Regulating Market & Renewable Energies
List of Graphics
List of Graphics
2. Variables’ Description
Graphic 1 - Evolution of the Consumption from the 1st of June 2008 until the 1st of June 2009
Graphic 2 - Evolution of the Wind Power Production from the 1st of June 2008 until the 1st of June 2009
Graphic 3 - Evolution of the Wind Power Imbalances between forecasted and real production from the 1st of June 2008 until the 1st of June 2009
Graphic 4 - Evolution of the DK-West Spot Price from the 1st of June 2008 until the 1st of June 2009
Graphic 5 - Evolution of the Regulating Price for Up Regulation from the 1st of June 2008 until the 1st of June 2009
Graphic 6 - Evolution of the Regulating Price for Down Regulation from the 1st of June 2008 until the 1st of June 2009
Graphic 7 - Evolution of the Fuel Prices from the 1st of June 2008 until the 1st of June 2009
Graphic 8 - Relation between Reserves of capacity Price and Spot Price from the 1st of June 2008 until the 1st of June 2009
Graphic 9 - Relation between Elbas Average Price and Spot Price from the 1st of June 2008 until the 1st of June 2009
Graphic 10 - Relation between Regulating Price for Down Regulate and Spot Price from the 1st of June 2008 until the 1st of
June 2009
Graphic 11 - Relation between Regulating Price for Up Regulate and Spot Price from the 1st of June 2008 until the 1st of
June 2009
Graphic 12 - Relation between need for Regulating Power and Wind Imbalances from the 1st of June 2008 until the 1st of
June 2009
3. Models
3.1. Consumption
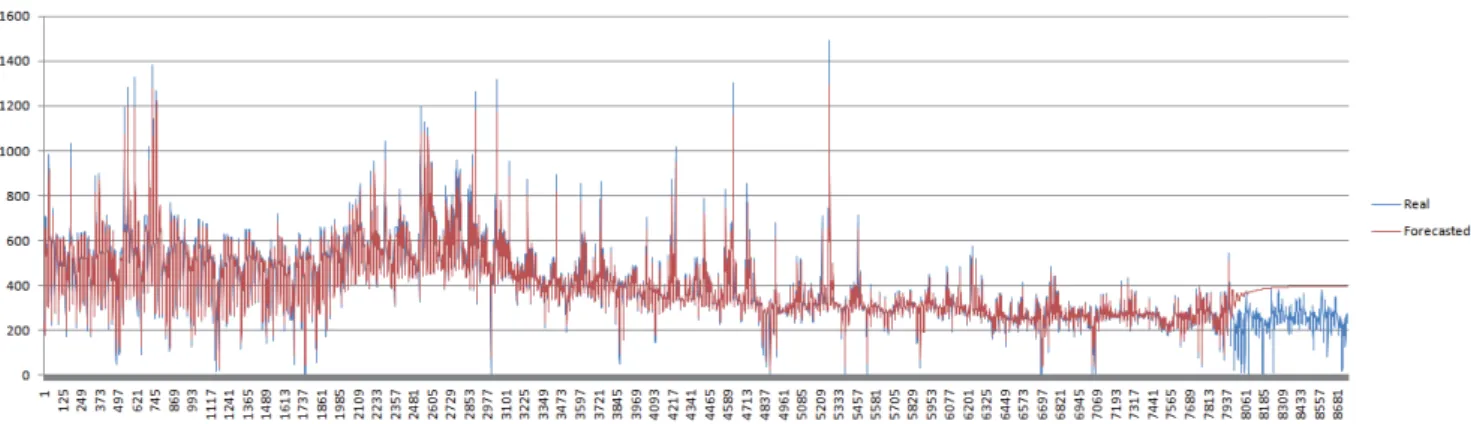
Graphic 13 - Real and Forecasted hourly consumption since 1st of June 2008 until 1st of June 2009
3.2. Dk-West Spot Price
Graphic 14 - Dk-West spot price vs. Wind Forecast Graphic 15 - System spot price vs. Wind Forecast Graphic 16 - Dk-West spot price vs. Demand
15 15 15 15 15 17 18 18 18 18 19 19 21 22 22 24
Electrical Power Engeneering Program
Graphic 17 - Dk-West spot price vs. Demand - Wind Forecast Graphic 18 - Spot Prices Dk-West, System and EEX - Average model
Graphic 19 - Average Dk-West spot price based on average values for the corrected demand - Average model
Graphic 20 - Average Dk-West spot price based on average values for the corrected demand with a trend line - Average model Graphic 21 - Dk-West spot price and forecasted spot price - Average model
Graphic 22 - Dk-West hourly spot price and forecasted hourly spot price - Average model Graphic 23 - Dk-West spot price and forecasted spot price - Average model 2
Graphic 24 - Dk-West hourly spot price and forecasted hourly spot price - Average model 2
Graphic 25 - Dk-west real and forecasted spot price - Matlab model for Dk-West Spot without fuel prices Graphic 26 - Dk-west real and forecasted spot price - Matlab model for Dk-West Spot with fuel prices Graphic 27 - Dk-west real and forecasted spot price - Regressive model for Dk-West Spot without fuel prices Graphic 28 - Dk-west real and forecasted spot price - Dk-West Spot ARIMA (1,0,0) model
Graphic 29 - Dk-west real and forecasted spot price - Dk-West spot fi nal model
3.3. Dk-West Regulating Price 3.3.1. Down Regulation
Graphic 30 - Dk-West real and forecasted Down Regulate price - full data Graphic 31 - Dk-West real and forecasted Down Regulate price - w/o outliers
Graphic 32 - Dk-West real and forecasted Down Regulate price - w/o outliers and w/o Wind Imbalances
3.3.2. Up Regulation
Graphic 33 - Dk-West real and forecasted Up Regulate price - w/o outliers and w/o Wind Imbalances
List of Graphics
24 25 25 26 27 27 28 28 29 30 31 32 33 37 38 39 42The Regulating Market & Renewable Energies
Appendix
Graphic 34 - Evolution of the Consumption from the 1st of January 2000 until the 1st of June 2009
Graphic 35 - Evolution of the Consumption from the 1st of January 2008 until the 23rd of June 2009
Graphic 36 - Evolution of the demand divided in weekdays from the 1st of January 2008 until the 23rd of June 2009
Graphic 37 - Evolution of the Consumption for Mondays from the 1st of January 2000 until the 23rd of June 2009
Graphic 38 - real and forecasted Consumption - ARIMA model for Mondays
Graphic 39 - Evolution of the Consumption for Tuesdays from the 1st of January 2000 until the 23rd of June 2009
Graphic 40 - real and forecasted Consumption - ARIMA model for Tuesdays
Graphic 41 - Evolution of the Consumption for Wednesdays from the 1st of January 2000 until the 23rd of June 2009
Graphic 42 - real and forecasted Consumption - ARIMA model for Wednesdays
Graphic 43 - Evolution of the Consumption for Th ursdays from the 1st of January 2000 until the 23rd of June 2009
Graphic 44 - real and forecasted Consumption - ARIMA model for Th ursdays
Graphic 45 - Evolution of the Consumption for Fridays from the 1st of January 2000 until the 23rd of June 2009
Graphic 46 - real and forecasted Consumption - ARIMA model for Fridays
Graphic 47 - Evolution of the Consumption for Saturdays from the 1st of January 2000 until the 23rd of June 2009
Graphic 48 - real and forecasted Consumption - ARIMA model for Saturdays
Graphic 49 - Evolution of the Consumption for Sundays from the 1st of January 2000 until the 23rd of June 2009
Graphic 50 - real and forecasted Consumption - ARIMA model for Sundays Graphic 51 - Average distribution of the consumption during the day
Graphic 52 - real and forecasted Consumption - Hourly consumption since 1st of June 2008 until 1st of June 2009
Graphic 53 - Dk-west real and forecasted spot price - Regressive model for Dk-West Spot with fuel prices Graphic 54 - Dk-West real and forecasted Up Regulate price - full data
Graphic 55 - Dk-West real and forecasted Up Regulate price - w/o outliers
List of Graphics
52 52 52 53 55 55 57 57 58 59 60 60 62 62 64 64 65 66 67 68 68 69The Regulating Market & Renewable Energies
List of Tables
List of Tables
3. Models
3.2. Dk-West Spot Price
Table 1 - Spot Prices Dk-West, System and EEX - Average model Table 2 - Constants for the model - Average model
Table 3 - Error for the model - Average model
Table 4 - Errors for the model applied to hourly values - Average model Table 5 - Errors for the model applied to hourly values - Average model 2
Table 6 - Train and Test Errors - Matlab model for Dk-West Spot without fuel prices Table 7 - Train and Test Errors - Matlab model for Dk-West Spot with fuel prices Table 8 - Model Parameters - Regressive model for Dk-West Spot without fuel prices Table 9 - Train and Test Errors - Regressive model for Dk-West Spot without fuel prices Table 10 - Model Parameters - Dk-West Spot ARIMA (1,0,0) model
Table 11 - Train and Test Errors - Dk-West Spot ARIMA (1,0,0) model Table 12 - Train and Test Errors - Dk-West fi nal model
3.3. Dk-West Regulating Price 3.3.1. Down Regulation
Table 13 - Model Parameters - Dk-West Down Regulation price - full data Table 14 - Train and Test Errors - Dk-West Down Regulation price - full data Table 15 - Model Parameters - Dk-West Down Regulation price - w/o outliers Table 16 - Train and Test Errors - Dk-West Down Regulation price - w/o outliers
Table 17 - Model Parameters - Dk-West Down Regulation price - w/o outliers and w/o Wind Imbalances Table 18 - Train and Test Errors - Dk-West Down Regulation price - w/o outliers and w/o Wind Imbalances
25 27 27 27 28 29 29 30 30 32 32 33 37 37 37 37 38 39
Electrical Power Engeneering Program
List of Tables
3.3.2. Up Regulation
Table 19 - Model Parameters - Dk-West Up Regulation price - w/o outliers and w/o Wind Imbalances Table 20 - Train and Test Errors - Dk-West Up Regulation price - w/o outliers and w/o Wind Imbalances
Appendix
Table 21 - Model Parameters - ARIMA model for Mondays Table 22 - Train and Test Errors - ARIMA model for Mondays
Table 23 - Some Data from the train group of values for the ARIMA model for Mondays Table 24 - Some Data from the test group of values for the ARIMA model for Mondays Table 25 - Model Parameters - ARIMA model for Tuesdays
Table 26 - Train and Test Errors - ARIMA model for Tuesdays
Table 27 - Some Data from the train group of values for the ARIMA model for Tuesdays Table 28 - Some Data from the test group of values for the ARIMA model for Tuesdays Table 29 - Model Parameters - ARIMA model for Wednesdays
Table 30 - Train and Test Errors - ARIMA model for Wednesdays
Table 31 - Some Data from the train group of values for the ARIMA model for Wednesdays Table 32 - Some Data from the test group of values for the ARIMA model for Wednesdays
Table 33 - Model Parameters - ARIMA model for Th ursdays
Table 34 - Train and Test Errors - ARIMA model for Th ursdays
Table 35 - Some Data from the train group of values for the ARIMA model for Th ursdays
Table 36 - Some Data from the test group of values for the ARIMA model for Th ursdays
Table 37 - Model Parameters - ARIMA model for Fridays
42 42 54 54 55 55 56 56 56 56 58 58 58 58 59 59 60 60 61
The Regulating Market & Renewable Energies
List of Tables
Table 38 - Train and Test Errors - ARIMA model for Fridays
Table 39 - Some Data from the train group of values for the ARIMA model for Fridays Table 40 - Some Data from the test group of values for the ARIMA model for Fridays Table 41 - Model Parameters - ARIMA model for Saturdays
Table 42 - Train and Test Errors - ARIMA model for Saturdays
Table 43 - Some Data from the train group of values for the ARIMA model for Saturdays Table 44 - Some Data from the test group of values for the ARIMA model for Saturdays Table 45 - Model Parameters - ARIMA model for Sundays
Table 46 - Train and Test Errors - ARIMA model for Sundays
Table 47 - Some Data from the train group of values for the ARIMA model for Sundays Table 48 - Some Data from the test group of values for the ARIMA model for Sundays Table 49 - Average distribution of the consumption during the day
Table 50 - Errors - Hourly consumption since 1st of June 2008 until 1st of June 2009
Table 51 - Model Parameters - Regressive model for Dk-West Spot with fuel prices Table 52 - Train and Test Errors - Regressive model for Dk-West Spot with fuel prices Table 53 - Model Parameters - Dk-West Up Regulation price - full data
Table 54 - Train and Test Errors - Dk-West Up Regulation price - full data Table 55- Model Parameters - Dk-West Up Regulation price - w/o outliers Table 56 - Train and Test Errors - Dk-West Up Regulation price - w/o outliers Table 57 - Forecast Errors - Spot and Persistence Models
Table 58 - Errors of Spot and Persistence forecasts from 1st of June 2008 and 1st of June 2009 - Energy values
61 62 62 63 63 63 63 65 65 65 65 66 67 67 67 68 68 69 69 69 70
The Regulating Market & Renewable Energies
Glossary
Glossary
Day of operation - Th is is the day when the energy dealt is going to be delivered.
Hour of operation - It is the hour when the energy will be
delivered.
Bottlenecks - whenever a connection between two diff erent
areas of the Nordpool system gets to its limit of capacity, it will cause a separation between these two areas and this separation is called the bottleneck. Th is situation will probably cause diff erences between these two area’s prices.
Balance Responsible Player - is any player on the market
that makes an agreement with the transmission system operator for ensuring a trade of energy and its respective values of time of operation, energy traded, etc...
System and Area Prices - A system price is the price that
the Nordpool retrieves for the spot market and it does not include the bottlenecks. Th e Area Price is the fi nal price for a specifi c area and is the price every player from that area has to pay for each unit of energy traded. If there are no bottlenecks at the Nordpool system than this price is the same as the system price, otherwise these two prices will be diff erent.
Trades of Energy - A trade of energy is any contract done
between two balance responsible players. Th is contract implies a player buying, a player selling, and a specifi c amount of energy circulating through the electricity transmission system from the seller to the buyer on a specifi c time.
Imbalances - An imbalance is the diff erence between
two comparable values. Th is errors can be related to production or consumption. An example of an imbalance is the diff erence between the energy a plant is supposed to produce and the real value of energy that it produces during a certain hour of operation. During this paper I’ll use the imbalances between the forecasted production of the wind power plants and their real production to create my model.
Notifi cation - A notifi cation is a paper that describes a
trade of energy. It includes data as name of the balance responsible players included in the trade of energy (might be one (only production or consumption with adjustable consumption) or more (trade between two players) BRPs per notifi cation) value of energy traded for a specifi c hour, etc.
The Regulating Market & Renewable Energies
Problem Description
I came to Denmark to do my fi nal graduation report because my Master is in Energy Markets and the Nordpool market is the best example of a well functioning liberalized energy market, hence my interest in wanting to know more about it.
Th e evolution of the wind power energy in Denmark has been huge and the investments made in this area are enormous and also expected to continue as such, or even grow more until the system achieves a bigger percentage of wind power in order to fulfi ll the national CO2 emissions’ goals for reduction.
Th e stability of the energy system which is being created will be highly dependent on the quality of wind forecasting, and the imbalances between real and forecasted values will have to be covered by fl exible “backup” plants at the Elbas and Regulating markets. Th is will reduce the need for continuous working fuel based plants but increase the need for the fl exible backup plants to deal at the Elbas and the
1. Introduction
Regulating markets immensely.
Th e idea of this study is to explore a specifi c part of the Nordpool Electricity Market called Regulating Market for the West Denmark zone (DK-West). Since very few research as been done on this market it is a challenge to conduct research on such an underdeveloped area due to a lack of data and studies one can use.
Th is report will study if the market can ensure the development of a system such as this and conclude how it will evolve. In order to reach these conclusions, within this paper, there is the need to describe the functioning of the entire market, from the beginning of the energy deal for a specifi c hour of operation, untill the respective hour of operation in a small introduction. However the focus will be on the Regulating market to explore this fl exible supply problem.
Electrical Power Engeneering Program
Note: All the data available, except for fuel prices is in hourly values and the variable for the analysis of the regulating market will be its price of energy (DKK/MWh).
Th e report will be composed in four major parts:
1. Description and analysis of the markets, description of the markets and of all the main mechanisms behind each one of them.
2. Introduction to some variables with some graphics to help the reader familiarize himself with these variables.
3. Creation and analysis of models that represent the regulating market and how it reacts to some variables to ensure the system’s stability. Th ese models will depend on Dk-west spot price so this will also have to be modeled. Th e variables available for this study are:
• Consumption; • Wind Forecast; • Wind Imbalances; • Fuel prices; • Bottlenecks;
• Dk-west spot and regulating market prices.
4. Conclusions
Th ere are some studies in this area already, trying to explain the market and how the wind power aff ects it, but not nearly enough with models to represent the market, and not unlike this study, where it will not only use the real wind production but also the forecasted wind production and its imbalances which, in my view, will make all the diff erence. Th e studies that have already been conducted conclude that there is no correlation between the prices and the wind power, but the fact that these studies are based in real
values and not the forecasted values may well make all the
diff erence.
The Regulating Market & Renewable Energies
System Description
Th e energy system in Denmark is divided in two diff erent areas, DK-West and DK-East. Th e DK-West area includes the Jutland Peninsula and the Funen Island and the DK-East area includes many islands from which the biggest ones are Zealand, where Denmark’s capital Copenhagen is, and Lolland. Th ese two areas are not connected to each other. DK-West is connected to Germany by synchronous AC (Alternate Current) cables, 950MW capacity to import and 1500MW capacity to export, to Norway by a 1000MW (Export) and a 950MW (Import), both DC (Direct Current) cables, and to Sweden through a 740MW (Export) and a 680MW (Import), both DC cables. Th e fact that it is only connected by DC cables to Norway and Sweden means that the imbalances in these two countries will not aff ect the system’s stability in the DK-West area. For this reason, DK-West is considered part of the UCTE (Central Europe) system with which it has an AC interconnection. Th e DK-East area is connected to Germany too but by a DC cable, so is not a part of the UCTE system and connected to Sweden by AC cables thus making it part of the Scandinavian Nordel system (Nordic Electricity System). Since there is no connection between the two areas (West and East Denmark), the Danish system can be divided into two completely independent systems, which is what this study will focus on, so during this report, only the DK-West system inside the Nordpool will be studied. In 2010, Dk-West and DK-East will be connected by a HVDC cable, which does not change that they are part of two diff erent electrical systems, Dk-West is part of UCTE system and Dk-East is part of Nordel system. Th is connection will almost not aff ect the prices because the connections between these two areas through Sweden and Germany already have enough capacity, which is easy to explain after looking at the west and Dk-east prices which tend to be equal or very similar. It can be seen in fi gures 1, 2 and 3 which countries are part of which Electrical system and the interconnections between the
UCTE and Nordel systems through West and DK-East borders.
1.2. System Description
Figure 1 - UCTE and Nordel Systems
(Source: System Description Slides, Flemming Nissen)
Figure 2 - HDVC (High Voltage Direct Current) Interconnections Between UCTE and Nordel Systems
Electrical Power Engeneering Program
Figure 3 - Danish Transmission System Grid and interconnections to UCTE and Nordel Systems
(Source: “Optimal electricity market for wind power”, H. Holttinen, 2004)
Red - Central Power Plants Orange - Local CHPs (Combined Heat-Power Plants) Green - Wind Turbines
Figure 4 - Evolution of the Power Plants in Denmark from 1980 to 2000 (Source: System Description Slides, Flemming Nissen)
Figure 5 - Grid connections to the off shore wind farms (Source: Internet - http://power-kite.blogspot.com/2007/11/ windpower-for-dummies.html)
The Regulating Market & Renewable Energies
Although it is not infl uenced by the imbalances of the rest of the Nordpool areas, the DK-West is part of Nordpool, is managed under Nordpool rules and is connected to the rest of the Nordpool meaning it can help maintain the Scandinavian Nordel system stability by regulating the power/energy supplied to that system.
In fi gure 4 it is visible how the electricity production evolved in the last decades.
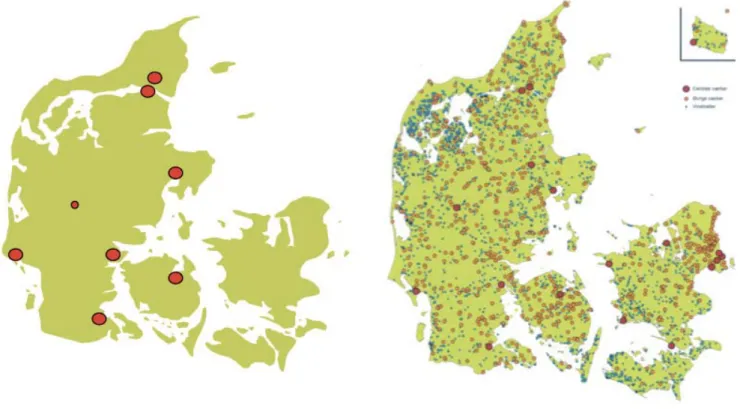
Th ere is a huge tendency to create a system with smaller power plants distributed all over the country. Th is can easily be explained for there will be fewer losses in the energy transportation, and the transport grid can be less loaded,meaning there will be available capacity for the transportation of energy from Nordel to UCTE or from UCTE to Nordel. In adiction, a grid that is usually not overloaded has considerably less problems with damaged components than one that is always working at full capacity. On can also see the eff ort the eff ort by Danish electricity companies to invest in renewable energies, more specifi cally the wind power energy. In Figures 5 and 6 the distribution of the wind turbines all across the West Denmark (DK-West Zone), as well as the grid connections to the off shore wind farms, is shown.
As aready mentioned, there is a huge intention to create a system with many small plants, in oredr for the transmission line not to get overloaded and because it is easier to guarantee the system stability and be able to create the so called “Islanding” that is, basically, the capacity to isolate an area and create small independent systems. For example, if for some reason a certain area becomes isolated because there was some defect on the transmission line (short-circuit, some component damaged, or even a transformer that goes out of service) which supplied that area, this area will be able to hold the demand with the local CHPs until the defect is repaired, most likely at a higher cost than it had before, but will avoid a blackout in that area. Th e problem with this small-scale CHPs is that, usually, they don’t have capacity for automatic regulation (regulation by frequency deviations) implying there has to be an equilibrium of small-scale CHPs, central CHPs and Wind turbines. In Figure 7 one can see the distribution, the number of units and their power for the generating units in West and East Denmark for 2008:
Figure 6 - Distribution of Wind Turbines across DK-West zone (Source: Internet - http://europe.theoildrum.com)
Electrical Power Engeneering Program
Figure 7 - Distribution of System Units across DK-West and DK-East in 2008 (Source: “Th e Power Market in Denmark”, Henning Parbo, Energinet.dk)
In the Figure 8 there is an analysis of the consumption and production development, with the production being for total, local CHPs and Wind Power production. Th e evolution of the Wind Power production and its share in the fi nal consumption is also visible. Of course these values depend, not just on the capacity installed, but most of all, on the wind throughout the year. Since there was a growth of almost 45% of the wind power produced from 2001 to 2005, and this has an impact when looked at the share of wind power, a renewable energy, at the total consumption, Denmark is one of the countries in Europe where, not only this share is among the highest, but also where this values keep growing still today. Th is brings some concerns to the approach of the market and of course it infl uences the prices for the electricity in DK-West, which is what is going to be studied on this paper.
Figure 8 - Evolution of the Consumption and Production for DK-West (Source: System Description Slides, Flemming Nissen)
The Regulating Market & Renewable Energies
Energy Market Description
1.3. Energy Market Description
Structure of an unbundled Energy Market:
Since the liberalization of the market there has been the need for the so called unbundling, meaning that there was a separation between the diff erent stages of electricity: Production, Transportation, Distribution and Consumer. Th erefore, a market structure like the one in fi gure 9, was created:
Th e Generation (G) and the Power Marketer (PM) confi gure the Production stage, the Schedule Coordinator (SC), Ancillary Services (AS), Market Operator (PX), Transmission Company (TP) and Independent System Operator (ISO) confi gure the Transmission stage and the Commercializer (RC) and Distributor (D) confi gure the Distribution stage.
Th e Market Operator is the company which ensures the communication between producers, consumers, distribution
G - Generation PM - Power Marketer SC - Schedule Coordinator AS - Ancillary Services PX - Market Operator TP - Transmission Company ISO - Independent System Operator
ISO + TP -> TSO - Transmission System Operator RC - Commercializer
D - Distributor
Figure 9 - Example of an Unbundled structure
(Source: “Mercados de Electricidade - Introdução”, João Tomé Saraiva, FEUP 2007)
companies and, of course, with the ISO. It is the company responsible for receiving all the bids for the spot market, for ancillary services, and to get a market price for every hour of the day. Th e Nordpool is the market operator for the Nordic countries. Th e ISO is responsible for guaranteeing that the ancillary services needed are available, and for maintaining the system stability (frequency and voltage) by controlling the equilibrium between production and consumption and bottlenecks. Whenever the ISO is the owner of the grid, then it means it is the Transmission Company too, and it is called the TSO, which for
Denmark is the Energinet.dk, while some of the generation companies are Dong Energy and Energi Fyn.
Th e Pool Model:
Th e Pool is represented by the Market Operator and it is responsible for doing the dispatch based on the buying and selling of bids from the demand and supply respectively for each hour of the next day (It might do for each half an hour, but the hour model is more commonly used). Th ere are two models of Pool, the symmetric and the asymmetric pool. In both of them there will be a market price for each hour of the next day and all the energy traded in the pool for that specifi c hour will be paid at that hour’s price.
Th e asymmetric pool:
In this model the demand buys the energy at any cost. Th is implies that only the supply bids for the energy, and then the market only sees the market price corresponding to the capacity asked by demand. Th e supply bids on the market as normal, with a bid for a specifi c hour, a certain amount of energy (MWh) and the respective price per unit of energy ($/MWh).
Electrical Power Engeneering Program
After receiving all the bids, at twelve o’clock the day before, the pool organizes the supply bids by price and creates the supply curve with which they can develop a fi gure like Figure 10 for each hour:
Figure 10 - Example of Supply Curve for an Asymmetric Pool System (Based on: “Mercados de Electricidade - Introdução”, João Tomé Saraiva, FEUP 2007)
Figure 11 - Example of Supply and Demand Curve for a Symmetric Pool System
(Based on: “Mercados de Electricidade - Introdução”, João Tomé Saraiva, FEUP 2007)
As seen in Figure 10, as the load (demand) is inelastic the pool ony checks the price, which means that if the supply curve was the same for three diff erent hours of the next day, the result would be a graphic like the one above, where for each hour (hour 1, 2 or 3) there is an asked load from the demand (Q1, Q2 and Q3) and a corresponding price for that load (P1,P2 and P3), which will be the market price for that specifi c hour. In this type of pool the load is totally dispatched in the pool. Th is system was used in England and Wales from the beginning of the liberalization until October 2000. Th is model is also used at the Regulating Market where the demand has to be all dispatched in order to maintain the system’s stability.
Th e symmetric pool:
In the symmetric model both demand and supply send their bids to the pool. Th e bid system is the same as the asymmetric pool (Bids for a specifi c hour, energy and price per energy). When the pool market closes (at twelve o’clock the day before the operation day), the market operator gathers all the bids from demand and supply and builds up their respective curves on a fi gure similar to Figure 11:
Th e point where the two curves cross defi nes the market price (Price of market - Pm) and the correspondent quantity of energy (Qm) dealt in the pool market. Th is analysis is done for every hour of the following day separately, so there will be diff erent market prices for every hour. A certain amount of energy requested by the demand to the pool is not dispatched on the pool which means it has to be dealt in another market or the demand can avoid consuming this energy. Th ere are some consumers that, if the price paid is higher than a certain value, prefer not to consume during a specifi c hour. An example of this is the energy spent in Norway for melting the ice or snow on the sidewalks. If the price is too high, then people either take the snow away with a shovel, or wait for a cheaper energy period to turn on the heating system. Th e best example of a liberalized market, that uses this pool system, is the Nordpool.
The Regulating Market & Renewable Energies
Nordpool Energy Market:
Th e Nordpool Energy Market is the market where all the Energy for the Nordic countries is traded. Th is includes Norway, Sweden, Finland and Denmark. All the companies that want to enter this market have to be Balance Responsible Players (BRP)1, where they agree with
the TSO of their area to be responsible for fulfi lling their contracts as Producers (supply) or Consumers (demand).
Structure of the Nordpool Electricity Market:
Th e Electricity Market is divided into three diff erent sub-markets:
Th e Elspot - Th e fi rst market for dealing energy, which is open until 12:00 of the day before the day of operation. Th e Elbas -Th e market for adjustments, which is open from 17:00 of the day before the day of operation until one hour before the hour of operation.
Th e Regulating Market - Th e market to guarantee the system’s stability, in which the bids are submitted until 45 minutes before the hour of operation. Even though the trade of energy, if needed, will only take place during the hour of operation. Th ere is also a period of time (until 9:30 a.m. the day before the day of operation) where plants can bid for availability of capacity for the reserves used in the regulating market (secondary and tertiary reserves) where they get paid, if accepted, for not bidding some capacity in the spot market and putting it available at the regulating market.
Parallel to the Nordpool market, the demand and supply are able to do some contracts between them directly without even going to the market. In order to do so, they just need to communicate these agreements to the TSO of their areas, so that this trades of energy are included in the TSO study of the grid for that hour to avoid bottlenecks. Th ese contracts are called Bilateral Contracts and can be
done until the end of the Elbas market. Th ese contracts can be done on a long-term basis or in a short-term basis, parallel to the Nordpool. Th ese contracts are done between companies in order to avoid the transaction costs of trades done at the pool. Every transaction made at the pool has a small cost that goes to insurance funds. If some player A does not pay B (the other) for an energy transaction they both committed themslves to do at the pool market, B can ask the pool for insurance and have the money from those funds. However, in bilateral agreements, players do not have access to these insurance funds.
Th e Elspot:
Th e Elspot is a market based on the Symmetric Pool model, an open market for producers, as sellers, and consumers, as buyers. In this market every Balance Responsible Player (BRP) submit their its bids for a specifi c hour as a price (DKK/kWh) and a value for Energy (kWh)2. At twelve
o’clock the day before, the Market Operator (Nordpool) gathers all the bids and builds the supply and demand curves for each specifi c hour of the next day, from the hour 0 to 1 until the hour 23 to 24, and publishes the market price and energy dealt for each hour. In case of a bottleneck on a connection between the diff erent Nordpool Areas, Dk-west and Norway for example, the spot prices for both areas will be diff erent. After a bottleneck occurs, the area isolated by that bottleneck will not be able to use bids from producers of the other area, so the supply curves for each area, after the point where the bottleneck occurs, will diverge. Th e Figure 12 is a graphic created with consecutive values on the X axis, simulating a demand, and with 3 curves representing the system price and the Dk-West price in case of a bottleneck formation at unit 46. Th e Dk-West price is divided in two curves because one represents a bottleneck while exporting (Dk-West Price B-out) while the other represents a bottleneck while importing (Dk-West Price B-in). If the system has no bottleneck, the Dk-West price will be the same as the System price.
2 - For more information on how to bid in the Nordpool please consult the Regulation C2_Balancing Market from Energinet.dk 1 - For more information about BRP please consult the Regulation
C2_Balancing Market from Energinet.dk
Electrical Power Engeneering Program
Th ese bottlenecks occur when Dk-West is producing a big amount of wind power (bottleneck in exportation), or when the wind power production is low and Norway has high Hydro power production that has also low costs of production (bottleneck in importation).
As mentioned above, some energy will be needed by the consumers that will not be accepted by the Elspot because the price paid for it by the demand is lower than the price asked for the same energy by the supply, so it either has to be negotiated afterwards in the other markets, or has to be avoided by demand.
Th e Elbas:
Th e Elbas is a market for adjustments and is used for dealing the energy that was not accepted at the Elspot, the forced outages and the forecasting imbalances. In this market, the BRPs make their bids for the market and if some other BRP accepts it, then they both communicate this agreement to the TSO of their areas. Th is means that this market is done by the BRPs only, and that there are not curves for buying or selling; the BRPs merely make trades of energy between them at the price they both agree as a good price for what they want. Th e prices in this market are analyzed and stored as minimum, maximum and average price paid by unit of energy (DKK/MWh) for each hour of the day.
Th e Regulating Market:
Th e regulating market is the market used to assure the system stability. In this market the consumers with variable load bid to up- or down-regulate the demand and the producers bid to up- or down-regulate the supply. Th ere will be a list of bids for up regulating power and a list of
Figure 12 - Example of Curves for System price and Dk-West price with bottlenecks
bids to down regulating power ordered by price of bid with bids from both demand and supply (the bids from the demand are inverse, i.e. a bid done by a consumer to down regulate goes to the up regulation list and a bid to up regulate goes to the down regulation list). Th is list is called the NOIS (Nordic Operational Information System3).
With the bids from the NOIS list the TSOs can build a curve for up- and down-regulation like the one in Figure 13:
Figure 13 - Example of Up- and Down-Regulation Curves at the NOIS List
(Based on: System Description Slides, Flemming Nissen)
3 - Th e NOIS is a common platform with all the regulating power
bids submitted by the suppliers in Norway, Sweden, Finland and Denmark
Th e “sell reg. power to TSO” curve is the curve for up-regulation and the “buy reg. power from the TSO” is the curve for down-regulation. In Figure 13, as it happens in the spot supply and demand curves graphics, at the NOIS list curves there is also an amount of energy - which in this case is the need for balancing power (MWh) - and a price paid for each unit of that power (EUR/MWh). Th e diff erence to the spot market is that here there is only a supply curve, so it works based on the asymmetric pool model. Th e reason for this, is that, while in the Elspot there is no problem if the demand is not fully supplied, the rest of the demand can be dealt in other markets until the hour of operation; in the Regulating Market if the demand is not fully supplied the system will lose its stability. Because both demand and supply bid to this list, if the Nordic
The Regulating Market & Renewable Energies
electricity system has a need for up regulating, which means that the demand is higher than the supply, the TSO for the area that needs this regulation, goes to the NOIS list and choses the cheapest way possible (the TSO has to be sure that there are no bottlenecks preventing this energy trade) to compensate this imbalance of the grid, which can be by down regulating the consumption, reducing the demand, or by up regulating the production, increasing supply. Th e same happens for down regulation by the TSO, with the diff erence that the options will be up regulate the consumption or down regulate the production. Th e price for this market will be defi ned by the last bid accepted on the NOIS list for that area. If there is a bottleneck, then the area separated from the system by the bottleneck will have a diff erent price than the rest of the system. Th e limit for bid at this market is 45 minutes before the hour of operation and the activation of the bids is during the hour of operation, according to the system’s necessities, so it is possible to have both up and down regulation in the same hour of operation. Th ere is a phase of this market on the day before the day of operation until 9:30 a.m., where the interested producers can bid for capacity availability in the NOIS list. Th is takes place because each TSO choses the capacity they want to assure to be available at the regulating market, essentially meaning that companies bid the
compensation they want for a certain capacity availability in the NOIS list. Th e companies usually use this market to make profi t and then they bid to the regulating market with their marginal costs of production, so, in the regulating market, they only receive what they spend producing the asked for regulation power. Th ere is a relationship between the availability compensation and the diff erence between the expected spot price and the marginal costs. Th is is because if they are risking not being asked to produce in the regulating market, because their bid is too high or because there was no need for regulating power for a specifi c hour, then they do not want to lose the profi t they could get over the Elspot if they bid that capacity on it.
Reserves:
Th e regulating power is divided in three reserves, the primary, secondary and tertiary. Sometimes there are two tertiary reserves but the way they work is the same as if there was only one.
Th e primary and secondary reserves are dealt with on a monthly basis, for now, but will probably start to be dealt with on a daily basis like the tertiary reserve, over the next year or so. Th e primary reserve is done automatically by the plants which are qualifi ed to do so, which means they have automatic power regulation capability, and react to frequency deviations. Th e secondary reserve is activated by the TSO remotely and it is also called automatic reserve or Low-Frequency Control (LFC). Th e tertiary reserve only start/stop producing, depending on if there is a necessity to up/down regulate, after the TSO sends a notifi cation to the plants saying the regulation they have to perform, regarding power and period. In Dk-west, this notifi cation is done through the operational schedules every 5 minutes and in Dk-east, a message is sent by the TSO to the plant, where the power, time for start and total time of operation is specifi ed.
In Figure 14 is represented an imbalance and the activation of bids to suppress it. Th e bids correspond to the tertiary reserve and the LFC is the secondary reserve.
Figure 14 - Activation of Bids for the Reserve Market (Source: Henning Parbo Slides, Energinet.dk)
Electrical Power Engeneering Program
Th e primary reserve is supposed to act within 5 seconds after the beginning of the imbalance and goes on until 5 minutes after it. Th e secondary reserve begins 5 minutes, maximum, after the beginning of the imbalance and ends 15 minutes later, so that is when the tertiary reserve has to be fully operational. Th e tertiary reserve can go on until one hour after the imbalance occurred. Figure 15 exemplifi es these timings for start and stop of the reserves.
Notifi cations:
Th e notifi cations are done either for production, consumption or a simple trade of energy between two Balance Responsible Players. Th ey are on a hourly basis and they describe the total energy that the Units/Power Plants should deliver for a specifi c hour. Th e way this energy is distributed within that hour is specifi ed on the operational power schedules. Every day one notifi cation is created works like like a time-series of all the hourly notifi cations for the next day (day of operation). Th ese hourly notifi cations can be adjusted until the hour of operation. All the adjustments to the hourly notifi cations have to be approved by the transmission system operator (Energinet. dk, for DK) and will be attached to the original notifi cation (the one from the day before), so that the original cannot be changed. Th e notifi cations are divided in three types as followed:
Th e original notifi cation as a time series for all the hours of the next day (day of operation). Th ese notifi cations are
Figure 15 - Time-line for start and stop of the Reserves
(Source: “Description of the required positive tertiary reserve energy”, Eva Marie Kurscheid)
submitted by the Balance Responsible Players until 3 p.m. of the day before and have to be accepted by the TSO (Energinet-dk). Th ese notifi cations cannot be changed. Th e notifi cations for adjustments are notifi cations that can be submitted to the TSO (Energinet.dk) for adjustments to the original notifi cation until 45 minutes before the hour of operation. Th ese notifi cations, if accepted by the TSO, have to be indexed to the original notifi cation and under no circumstance can the original notifi cation be changed. Th e operational power schedules are notifi cations that describe the energy or power that a certain Unit (if power superior than 10MW) or Plant (if power for each unit of this plant is lower than 10MW) is supposed to supply. In Eastern Denmark, the time series/power schedules are done as hourly notifi cations of energy for the next hour (MWh/h). In Western Denmark, the time series/power schedules, which are submitted by the West Danish BRPs for production and West Danish BRPs for consumption with adjustable consumption, are done on a fi ve minute basis (updated every 5 minutes) and include the power that the unit/plant will supply in the next fi ve minutes of operation (MW). Th e Operational Schedule is the set of power schedules for a specifi c unit/plant for the 24 hours of the day and it is indexed to the original notifi cation at the end of the day of operation. In Eastern Denmark, this operational schedule consists in a set of 24 hourly time series of energy (MWh/h) and in Western Denmark the set is for 5 minutes power schedules (MW) for the 24 hours of the day, which means there will be 288 power schedules indexed to the original notifi cation and the adjustments notifi cations for each unit/plant, every day.
Th e fi nal set of original notifi cation, plus adjustments notifi cations, plus the time series/power schedules are used the day after the day of operation for the settlement of power imbalances.
Settlement of balancing power:
Th e settlement of the balancing power is paid on a monthly basis on the 25th day of every month. However, if it is not a working day, it will be paid at the next working day after the 25th. Th e settlements are done separately to the production, consumption and trades.
The Regulating Market & Renewable Energies
For balancing power pricing, for production, Energinet.dk uses the two-price model:
- If the imbalance of a BRP has the same direction of the system’s total imbalance, which means that it will increase the system’s total imbalance, it will be paid at the area’s Regulating Power price;
- If the imbalance of a BRP has the opposite direction of the system’s total imbalance, that means that it will decrease the system’s total imbalance, so it will help the system and it will be paid at the area’s electricity spot price.
For balancing power pricing, for consumption and trades, Energinet.dk uses the one-price model:
- Any imbalance, regardless of the direction, is settled at the area’s Regulating Price.
Settlement of power imbalances:
To settle the power imbalances in Denmark, the TSO (Energinet.dk) uses the power schedule values and the real (metered) values converted to quarter-hourly values. Th e power imbalances are the diff erence between these two values. Th e power imbalances are only settled if the diff erence between the sum of the quarter-hourly power schedules energy and the sum of the quarter-hourly metered values for all the balance responsible players exceeds 2.5 MWh/quarter-hour. Th is means that if the diff erence is lower than 2.5 MWh/quarter-hour the TSO accepts this imbalance and does not charge players for it. If the diff erence is higher than 2.5 MWh/quarter-hour the TSO will proceed to calculate the power imbalances for each balance responsible player and the correspondent amount they have to pay for these imbalances.
Settlement prices for the power imbalances:
To the settlement prices for power imbalances, two prices are used:
- A price for balancing power, either for up-regulating and down-regulating (BALup and BALdown respectively). - A price for the automatic reserves power, again for up-regulating and down-up-regulating (AUTup and AUTdown respectively).
Power imbalances are settled at diff erent prices according to the diff erences between notifi cation, power schedule and metered results for a given hour. As the metered results and the power schedules are in a quarter-hourly basis, these values have to be converted into hourly values before settling the prices for power imbalances. Th e way to calculate the prices, depending on variables above described is the following:
If Metered Result > Power Schedule > Notifi cation then:
Price = (Metered Result - Power Schedule) * (BALdown - AUTdown)
If Power Schedule > Metered Result > Notifi cation then:
Price = (Metered Result - Power Schedule) * (BALdown - AUTup)
If Metered Result > Notifi cation > Power Schedule then:
Price = (Metered Result - Power Schedule) * (BALup - BALdown)
If Notifi cation > Power Schedule > Metered Result then:
Price = (Metered Result - Power Schedule) * (BALup - AUTup)
If Notifi cation > Metered Result > Power Schedule then:
Price = (Metered Result - Power Schedule) * (BALup - AUTdown)
If Power Schedule > Notifi cation > Metered Result then:
Price = (Metered Result - Power Schedule) * (BALdown - BALup)
If the settlement prices (BALdown - AUTdown and AUTup - BALup) for a specifi c hour have a negative value, then they will assume the value 0 DKK/MWh. Th is means that if a player incurs in an imbalance, he either has to pay a cost or pay nothing for the settlement price, but never receives money for that imbalance.
As in the settlement for balancing power, the invoices for settlement prices are done in a monthly basis.
Electrical Power Engeneering Program
Timeline for the Nordpool Electricity Market:
Figure 16 - Timeline for the Nordpool Electricity Market (Source: “Regulation C3_Handling of notifi cations and schedules”, Energinet.dk)
The Regulating Market & Renewable Energies
Variables’ Description
2. Variables’ Description
Th is chapter goes through some of the values for the variables that will be used in the models, in order for the readers to familiarize themselves with the terms. It shows the range of the variables and how they have evolved throughout the past year. All the data is shown on an hourly basis since the 1st of June 2008 until the 1st of June 2009.
Some graphics that describe the relations between two variables, just as basic analysis, will aso be shown on this chapter, but further on, once going through the elaboration of the models, this analysis will be deeper.
Graphic 1 - Evolution of the Consumption from the 1st of June 2008 till the 1st of June 2009
Th e fi rst graphic is the one for consumption. In Graphic 1, one can see the presence of week seasonlly consumption. Th at is why, latter on, at the creation of the model for consumption, the data will be divided in every weekday and worked separately creating this way seven diff erent models. Besides this, it also has the eff ect of seasons (Winter, Spring, Summer and Autumn) but this is easier to see when divided in weekdays. Th e unit used for consumption is MWh/h.
Electrical Power Engeneering Program
Graphic 2 - Evolution of the Wind Power Production from the 1st of June 2008 till the 1st of June 2009
Graphic 3 - Evolution of the Wind Power Imbalances between forecasted and real production from the 1st of June 2008 till the 1st of June 2009
Graphic 4 - Evolution of the DK-West Spot Price from the 1st of June 2008 till the 1st of June 2009
Graphic 5 - Evolution of the Regulating Price for Up Regulation from the 1st of June 2008 till the 1st of June 2009
The Regulating Market & Renewable Energies
Th e next variable analyzed is the Wind Power Production. Th is variable depends on the installed capacity of wind turbines, of course, but most importantly, it depends on the speed the wind has at the high of the rotor of the turbine. Th is is easily explained by the characteristic curve of power of this type of turbines (power versus wind speed), which is shown bellow:
Th e wind turbine will not work with a wind speed below 3,5m/s and if the wind’s speed is higher than 25m/s the turbine has to stop working for security reasons. All in all, the range of wind’s speed in order for the wind turbine to be able to produce energy is between 3,5 and 25m/s. Graphics 2 and 3 show the total wind power hourly production in West Denmark in MWh/h for the analyzed period, and
Figure 17 - Curve of power versus wind speed for a wind turbine (Source: Internet - http://www.wind-power-program.com)
also the imbalances between the forecasted and the real production. In the Nordpool system the Wind Power goes to the pool at a cost of zero, so it is right in the beginning of the supply curve, which means it is the fi rst to be dispatched. Th is implies that its instability and variations will be present in the price of energy, but more about that over the DK-West spot price modeling. Th e imbalances shown on Graphic 3 are useful to compare with need for Regulating Power and with the regulating prices.
As already mentioned, the DK-West spot price is very unstable, and because of that, it is very hard to model. Th is price depends on so many variables that even in consecutive hours the prices can change 100% or 200% easily, and sometimes varying much more than this. Graphic 4 shows this instability and its behaviour through out a year. Th e average price also changes.
Th e Regulating Market price for DK-West is similar to the Spot price in shape because it is directly indexed to the Spot price as explained above in the Regulating Market introduction. Graphics 5 and 6 describe the Regulating Power price for Up- and Down-Regulate, respectively.
One really important variable in the electricity market is the price of fuels, coal, oil and natural gas. As showed in the system description almost 70% of the installed capacity in western Denmark depends on these fuels, so their prices are
Graphic 6 - Evolution of the Regulating Price for Down Regulation from the 1st of June 2008 till the 1st of June 2009
Electrical Power Engeneering Program
Graphic 7 - Evolution of the Fuel Prices from the 1st of June 2008 till the 1st of June 2009
Graphic 8 - Relation between Reserves of capacity Price and Spot Price from the 1st of June 2008 till the 1st of June 2009
Graphic 9 - Relation between Elbas Average Price and Spot Price from the 1st of June 2008 till the 1st of June 2009
Graphic 10 - Relation between Regulating Price for Down Regulate and Spot Price from the 1st of June 2008 till the 1st of June 2009
The Regulating Market & Renewable Energies
really important. Graphic 7 has the monthly average prices for each fuel in the markets that Europe usually buys from.
Beginning on Graphic 8, are shown the relationships between prices for reserve of capacity market (9:30a.m. day before operation), Elbas and Regulating market with the Dk-West Spot Price and between need for regulating power and wind imbalances.
In Graphic 8 there is a correlation between the reserve of capacity price and the spot price, which was expectable for the plants bid on this market the diff erence between the expected spot price and their marginal costs, explaining why, if the spot price is high, then the price for reserve of capacity for regulation also tends to increase. Of course, either the spot price or the marginal cost depend on the costs of fuels and other variables that are not common to both, so, even though the correlation is not linear, it is there.
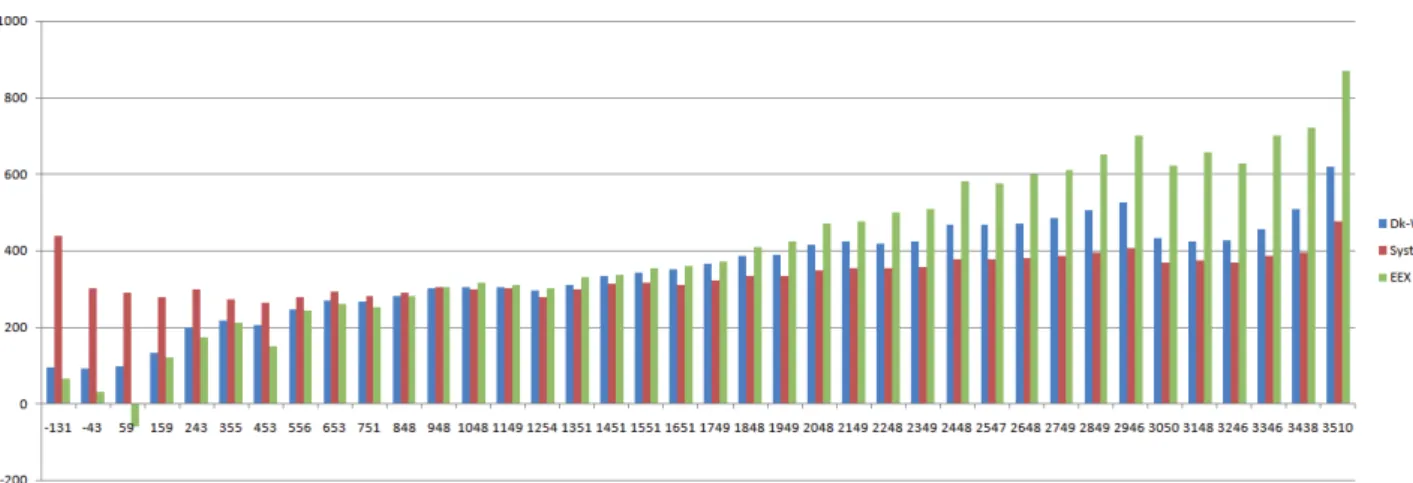
On Graphic 9, it is easy to see that there is a correlation between the prices of almost one to one, which means that
Graphic 11 - Relation between Regulating Price for Up Regulate and Spot Price from the 1st of June 2008 till the 1st of June 2009
the Elbas average price is near the spot price.
In Graphics 10 and 11 one can see the correlation between Regulating Prices for both Up- and Down-Regulation and DK-West Spot Prices. As it happened with the Elbas prices, these prices tend to be equal to the spot price but in these two cases, the correlation is stronger and it is almost possible to draw a tendency line with a straight line. For 62% of the time the relation between down regulation price and spot price is between 0.95-1.05 (down regulation price divided by the spot price) and for the up regulation price this value goes up to 77%. Th is is consistent with the theory of the regulating power being around the spot price - either going up or down for Up- or Down-regulation respectively - as explained in the introduction to the Regulating Market.
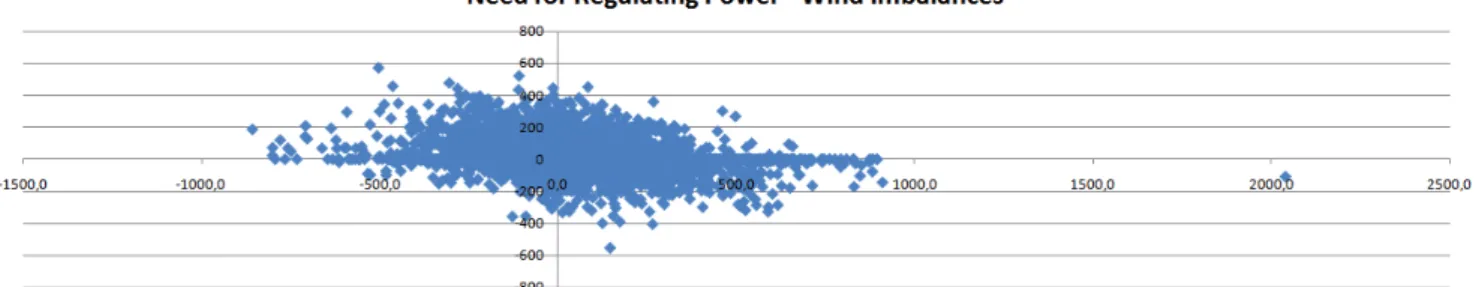
Acorrelation between the need for regulating power and the wind power imbalances was expected, but there is no visible correlation in Graphic 12. More of these studies will be shown latter on the modeling.
Graphic 12 - Relation between need for Regulating Power and Wind Imbalances from the 1st of June 2008 till the 1st of June 2009
Electrical Power Engeneering Program
All in all, the prices for Dk-west spot depend on many variables, being one of them the forecasted Wind Power, which is one of the most important variables to explain the oscillations on this price. Th e fuel prices are also important because the costs of production to the fuel based plants are directly indexed to these prices but the production costs are not calculated on an hourly basis so the fuel prices are not responsible for the hourly variations. On the other hand, these prices, in particular, the price for Natural Gas, has a trend similar to the spot price trend. Th is can be explained by the fact that in Dk-West there is a big concentration of CHP Plants and these work on Natural Gas. A further issue is the correlation between the Dk-West Regulating prices and the spot price. Th is is the main reason why this report will focus its studies on the Dk-West spot price fi rst, and then on the Regulating Market.
The Regulating Market & Renewable Energies
Consumption
3. Models
3.1. Consumption
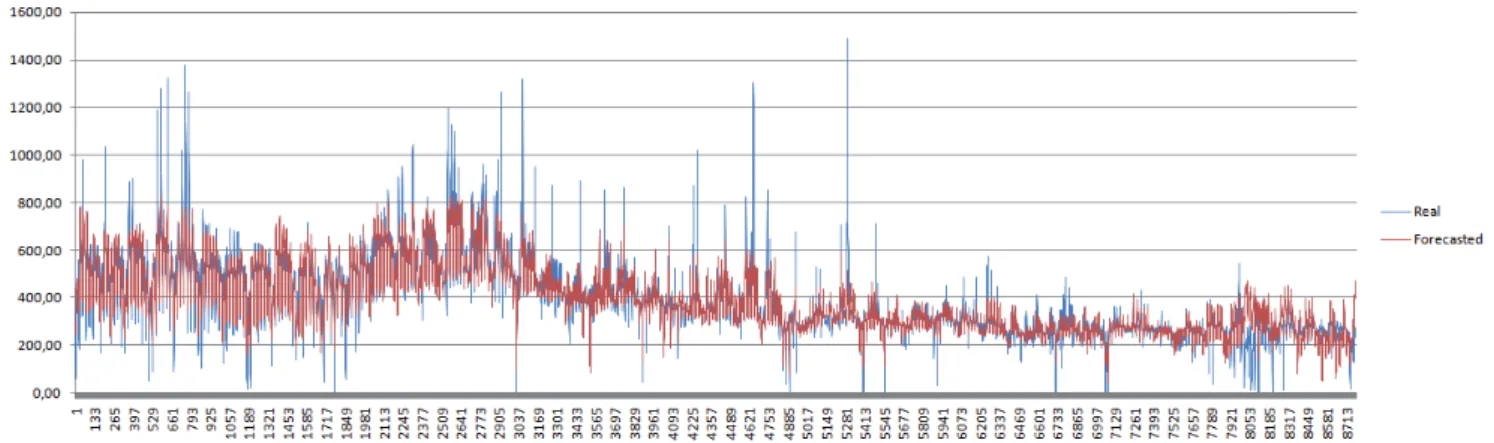
Because the Consumption is an entry for the models studied latter on, it will be an important variable to this study, so there is a necessity to study and forecast it in order to be able to include it in the market studies.
For this model in particular, it is easier to work with daily data instead of hourly data. Th is because this way, the week seasonly can be included in the model as well as the year seasonly. Th e data used was the data available at Energinet.dk webpage, which resumes to data from the 1st of January 2000 until the 23rd of June 2009. After the
forecast, the models’ results are converted again into hourly values. For that, a new study of the distribution of the
consumption during the hours of the day was made. Th is study is also good to see that this distribution during the day has not changed in for the past 10 years, and it is good to understand how the distribution of consumption has to evolve in order to achieve an equilibrium of consumption during the day, which would minimize the need for extra plants to supply the consumption over the “full hours”. All these studies are explained in the Appendix. In the end, the MAPE error, which is the mean absolute percentage error, was 4,88% and Graphic 13 shows the real and the forecasted consumption for the period used for the models studied latter.