1 This article was published in Journal of Biomedical Materials Research - Part A, 1 103(4), 1414-1423, 2015 2 http://dx.doi.org/10.1002/jbm.a.35277 3 4
Escherichia coli adhesion, biofilm development and antibiotic
5susceptibility on biomedical materials
67 8
LC Gomes, LN Silva, M Simões, LF Melo, FJ Mergulhão
9
LEPABE – Department of Chemical Engineering, Faculty of Engineering, University of Porto, Rua Dr.
10
Roberto Frias, Porto, Portugal
11 12 13 14 15 16 17 18 19 20 21 22 23
Corresponding author: Filipe J. M. Mergulhão, Department of Chemical Engineering, Faculty of
24
Engineering University of Porto, Rua Dr. Roberto Frias, 4200-465 Porto, Portugal. Phone: (+351)
25
225081668. Fax: (+351) 5081449. E-mail: [email protected].
2
Abstract 27
The aim of this work was to test materials typically used in the construction of medical 28
devices regarding their influence in the initial adhesion, biofilm development and 29
antibiotic susceptibility of Escherichia coli biofilms. Adhesion and biofilm development 30
was monitored in 12-well microtiter plates containing coupons of different biomedical 31
materials – silicone (SIL), stainless steel (SS) and polyvinyl chloride (PVC) – and glass 32
(GLA) as control. The susceptibility of biofilms to ciprofloxacin and ampicillin was 33
assessed and the antibiotic effect in cell morphology was observed by scanning electron 34
microscopy (SEM). The surface hydrophobicity of the bacterial strain and materials was 35
also evaluated from contact angle measurements. Surface hydrophobicity was related 36
with initial E. coli adhesion and subsequent biofilm development. Hydrophobic materials, 37
such as SIL, SS and PVC, showed higher bacterial colonization than the hydrophilic glass. 38
Silicone was the surface with the greatest number of adhered cells and the biofilms 39
formed on this material were also less susceptible to both antibiotics. It was found that 40
different antibiotics induced different levels of elongation on E. coli sessile cells. Results 41
revealed that, by affecting the initial adhesion, the surface properties of a given material 42
can modulate biofilm buildup and interfere with the outcome of antimicrobial therapy. 43
These findings raise the possibility of fine-tuning surface properties as a strategy to reach 44
higher therapeutic efficacy. 45
46
Keywords: Escherichia coli, surface hydrophobicity, bacterial adhesion, biofilm 47
formation, antibiotic susceptibility 48
49 50 51
3
INTRODUCTION 52
Bacterial adhesion to biomedical surfaces is a complex process that is affected not only 53
by biological features, but also by many physico-chemical factors, such as the surface 54
properties of the device (chemical composition, charge, hydrophobicity, roughness and 55
texture), the bacterial hydrophobicity and charge, and environmental factors 56
(temperature, pH, fluid flow conditions, etc.).1 From an overall physico-chemical point 57
of view, adhesion can be mediated by non-specific interactions (long-range, distances > 58
150 nm), including Lifshitz-van der Waals forces, electrostatic forces, acid-base 59
interactions and Brownian motion forces.1,2 As soon as bacterial cells reach a surface, 60
they will be attracted or repelled by it, depending on the sum of the different non-specific 61
interactions.3 Hydrophobic interactions are usually the strongest of all long-range non-62
covalent forces involved in bacterial attachment and can be defined as the attraction 63
between apolar, or slightly polar, cells or other molecules, when immersed in an aqueous 64
solution.2 It has been demonstrated that hydrophobicity plays an important role in a wide 65
range of microbial infections.4 66
Biofilm formation in medical devices generally comprises several steps. Firstly, there is 67
the deposition of a conditioning film produced by the host on the foreign body.5,6 It is 68
followed by the approach and attachment of microorganisms, consisting in the first step 69
in the pathogenesis of medical device-related infections.7 The initial adhesion is 70
reversible, involves hydrophobic and electrostatic forces, and is followed by irreversible 71
attachment mediated by bacterial polysaccharides which anchor the organisms to the 72
surface.5 After that, cell growth, multiplication and dissemination occur. 73
Microbial biofilms are well-known for their high resistance to antibiotic and biocide 74
treatments.8 Bacteria within biofilms can tolerate the presence of high antibiotic 75
concentrations (in the range that is therapeutically prescribed), making most of the device-76
4 related infections difficult or impossible to eradicate.9 Some factors that contribute to 77
biofilm resistance include physical or chemical diffusion barriers to antibiotic penetration 78
within the biofilm matrix, slow growth rate of biofilm cells due to nutrient limitation, 79
activation of the general stress response, and the presence of persister cells or antibiotic-80
resistant small-colony variants.10 Two antibiotics with distinct modes of action were used 81
on this study: ciprofloxacin and ampicillin. Ciprofloxacin, a broad-spectrum synthetic 82
antibiotic of the fluoroquinolone drug class, functions by inhibiting DNA gyrase and 83
topoisomerase IV (enzymes necessary to separate bacterial DNA strands), thereby 84
inhibiting cell division.11 Ampicillin, a β-lactam antibiotic, inactivates the synthesis of 85
cross-linked peptidoglycan and also interferes with septum formation during cell 86
division.12 Both antibiotics are among the most frequently prescribed antimicrobial agents 87
worldwide and can be used on the treatment of urinary tract infections13-16 in which E. 88
coli is notably the main causative agent.17
89
Biomedical devices are currently made of different materials. Silicone polymers have 90
been further applied in urinary catheters, contact lenses, ophthalmologic implants, heart 91
valves, breast implants, blood pumps, tubing and adhesives.18,19 Stainless steel 316 is used 92
in surgical instruments, as well as in orthopaedic, craniofacial and cardiovascular implant 93
devices.20 PVC covers more than 25% of all plastic materials used in medical 94
applications, including intravenous fluid bags and tubing, blood and plasma bags, enteral 95
feeding and dialysis equipment, endotracheal tubes, short-term catheters and gloves.21,22 96
E. coli has become a common pathogen in predisposed hosts with indwelling medical
97
devices.23 Its pathogenic strains are responsible for 70 to 95% of urinary tract infections 98
(UTIs), one of the most typical bacterial diseases. These infections are especially frequent 99
in cases of catheterization due to biofilm development on the indwelling urinary 100
catheters.24,25 Catheter-associated UTI accounts for more than 1 million cases per year in 101
5 United States alone and involves an annual cost of caring for patients with this infection 102
of approximately $2 billion.26 103
The main goal of this study was to assess the importance of the initial adhesion events on 104
the development of E. coli biofilms in clinically relevant materials and to determine if the 105
surface properties can affect the outcome of an antimicrobial therapy. Additionally, SEM 106
visualization of the biofilms enabled the assessment of morphological changes in the 107
bacterial cells resulting from the antibiotic treatment. A better understanding of these 108
effects may provide clues for the fine-tuning of the surface properties of biomedical 109
materials in order to mitigate bacterial adhesion and increase the efficiency of 110
antimicrobial therapy. 111
112
MATERIALS AND METHODS 113
Bacterial strain and culture conditions 114
Escherichia coli JM109(DE3) from Promega (USA) was used in this study because this
115
strain has shown a good biofilm forming ability in both turbulent27 and laminar28 flow 116
conditions. Its genotype is endA1, recA1, gyrA96, thi, hsdR17 (rk-, mk+), relA1, supE44, 117
λ-, Δ(lac-proAB), [F’,traD36, proAB, lacIqZΔM15], λ(DE3). 118
A bacterial suspension was prepared by inoculation of 500 µL of a glycerol stock (kept 119
at -80 ºC) in a total volume of 0.2 L of inoculation medium previously described by 120
Teodósio et al.29 This consisted of 5.5 g/L glucose, 2.5 g/L peptone, 1.25 g/L yeast extract 121
in phosphate buffer (1.88 g/L KH2PO4 and 2.60 g/L Na2HPO4), pH 7.0. This culture was 122
grown on a 1 L shake-flask, incubated overnight at 37 ºC with agitation. Subsequently, 123
cells were harvested by centrifugation (at 3202 g for 10 min at 25 ºC) and suspended in 124
Mueller-Hinton broth (Merck, Germany) to remove all traces of the overnight growth 125
medium. Cells were again harvested by centrifugation (as described before) and 126
6 suspended in Mueller-Hinton broth in order to obtain an inoculum containing 127 approximately 1 x 10⁷ cells/mL. 128 129 Surface preparation 130
Coupons with dimensions of 1 x 1 cm from glass (GLA; Vidraria Lousada, Lda, Portugal), 131
stainless steel 316 (SS; F. Ramada, Portugal), polyvinyl chloride (PVC; Neves & Neves, 132
Lda, Portugal) and silicone (SIL; Neves & Neves, Lda, Portugal) were prepared. SS, PVC 133
and SIL were selected because of their recurrent use in clinical applications and glass, a 134
hydrophilic surface, was used in this study for comparative purposes. 135
All materials were immersed in a solution of 5% (v/v) commercial detergent (Sonasol 136
Pril, Henkel Ibérica S.A.) and pre-warmed distilled water (37 ºC) for 30 min with gentle 137
shaking. To remove any remaining detergent, coupons were rinsed 5 times in 2 mL of 138
ultrapure water per coupon in ultrapure water and air-dried for 1 h.17,30 Then they were 139
immersed in 96% (v/v) ethanol for 30 min, except for PVC and SIL that were only 140
immersed for 10 s.31 After being rinsed with ultrapure water and air-dried again, SS and 141
GLA coupons were autoclaved for 15 min at 121 ºC30 whereas SIL and PVC coupons 142
were autoclaved for 20 min at 70 ºC17 to avoid damaging the coupons. The sterility of the 143
SIL and PVC coupons was confirmed by the absence of bacterial growth in the surface 144
after a 24 h incubation in Mueller-Hinton broth at 37 ºC. 145
146
Free energy of adhesion between bacteria and surfaces 147
The free energy of adhesion (∆𝐺𝑖𝑤𝐼𝑇𝑂𝑇) between the E. coli and all tested surfaces (SIL, SS, 148
PVC and GLA) was assessed according to the procedure described by Simões et al.32 149
Lawns of E. coli were prepared as described by Busscher et al.33 in order to ascertain the 150
bacterial surface hydrophobicity. 151
7 The contact angles of the bacteria and the surfaces were determined by the sessile drop 152
method using a contact angle meter (OCA 15 Plus, Dataphysics, Germany). The surface 153
tension components of the bacteria and the adhesion surfaces were obtained by measuring 154
the contact angles with three pure liquids. These measurements were carried out at room 155
temperature (25 ± 2 ºC) using water, formamide and α-bromonaphthalene (Sigma-Aldrich 156
Co., Portugal) as reference liquids. The surface tension components of the reference 157
liquids were obtained from literature.34 Contact angle measurements were performed in 158
three independent experiments. On each experiment, at least 25 determinations for each 159
liquid, material and microorganism were made. Afterwards, the hydrophobicity of the 160
bacteria and the surfaces was evaluated by the method of van Oss et al.35-37 In this 161
approach, the degree of hydrophobicity of a given material (𝑖) is expressed as the free 162
energy of interaction between two entities of that material immersed in water (𝑤) - ∆𝐺𝑖𝑤𝑖. 163
If the interaction between the two entities is stronger than the interaction of each entity 164
with water (∆𝐺𝑖𝑤𝑖 < 0 mJ/m2), the material is considered hydrophobic. Conversely, if 165
∆𝐺𝑖𝑤𝑖 > 0 mJ/m2, the material is hydrophilic.∆𝐺𝑖𝑤𝑖 was calculated from the surface 166
tension components of the interacting entities, according to the equation: 167 168 ∆𝐺𝑖𝑤𝑖 = −2 (√𝛾𝑖𝐿𝑊− √𝛾 𝑤𝐿𝑊) 2 + 4 (√𝛾𝑖+𝛾 𝑤−+ √𝛾𝑖−𝛾𝑤+− √𝛾𝑖+𝛾𝑖−− √𝛾𝑤+𝛾𝑤−) (1) 169 170
where 𝛾𝐿𝑊accounts for the Lifshitz-van der Waals component of the surface free energy 171
and 𝛾+ and 𝛾− are the electron acceptor and electron donor parameters, respectively, of 172
the Lewis acid-base component (𝛾𝐴𝐵), with 𝛾𝐴𝐵 = 2√𝛾+𝛾−. 173
The surface tension components were estimated by the simultaneous resolution of three 174
equations of the type: 175
8 176 (1 + cos 𝜃)𝛾𝑖𝑇𝑂𝑇= 2 (√𝛾 𝑠𝐿𝑊𝛾𝑖𝐿𝑊+ √𝛾𝑠+𝛾𝑖−+ √𝛾𝑠−𝛾𝑖+) (2) 177 178
where 𝜃 is the contact angle and 𝛾𝑇𝑂𝑇 = 𝛾𝐿𝑊+ 𝛾𝐴𝐵. 179
When studying the interaction (free energy of adhesion) between substances 𝑖 and 𝐼 that 180
are immersed or dissolved in water, the total interaction energy, ∆𝐺𝑖𝑤𝐼𝑇𝑂𝑇, can be expressed 181 as: 182 183 ∆𝐺𝑖𝑤𝐼𝑇𝑂𝑇= 𝛾 𝑖𝐼𝐿𝑊− 𝛾𝑖𝑤𝐿𝑊− 𝛾𝐼𝑤𝐿𝑊 184 + 2 [ √𝛾𝑤+(√𝛾 𝑖−+ √𝛾𝐼−− √𝛾𝑤−) + √𝛾𝑤− (√𝛾𝑖++ √𝛾𝐼+− √𝛾𝑤+) 185 − √𝛾𝑖+𝛾 𝐼−− √𝛾𝑖−𝛾𝐼+] (3) 186 187
Thermodynamically, if ∆𝐺𝑖𝑤𝐼𝑇𝑂𝑇 < 0 mJ/m2 adhesion of the bacteria to the substratum is 188
favourable, whereas adhesion is not favourable if ∆𝐺𝑖𝑤𝐼𝑇𝑂𝑇 > 0 mJ/m2. 189
190
Initial adhesion and biofilm assays 191
A total of 2 mL of cell suspension (1 x 10⁷ cells/mLin Mueller-Hinton broth) was 192
transferred into each well of a sterile 12-well polystyrene (PS), flat-bottomed microtiter 193
plate (Orange Scientific, USA) containing the coupons of different materials. Initial 194
adhesion and biofilm growth were allowed to occur by incubating the microtiter plates at 195
37 ºC without shaking. At different sampling times, 30 min for initial adhesion and 4, 8, 196
12, 16, 20 and 24 h for biofilm studies, coupons were removed from the microwells and 197
quickly immersed on 2 mL of sterile saline (NaCl 0.85%) to remove the loosely attached 198
9 cells. Coupons were then vortexed in 10 mL of saline solution during 1 min22 to suspend 199
and homogenize the biofilm cells. The extent of cell removal from the surface due to 200
vortexing was assessed and it was found to be greater than 95%. 201
For total cell counts, suspended biofilm cells were stained with 4’-6-diamidino-2-202
phenylindole (DAPI), which stains both viable and non-viable cells.38 Biofilm cells were 203
properly diluted, filtered through a Nucleopore, Track-Etch Membrane (Whatman Int., 204
Ltd., USA) black polycarbonate membrane (pore size 0.2 µm) and stained with 1 mL of 205
DAPI reagent (0.5 mg/L) for 10 min in the dark.38 Stained bacterial observation and 206
counting was performed using a Leica DM LB2 epifluorescence microscope connected 207
to a Leica DFC300 FX camera (Leica Microsystems Ltd., Switzerland). Cell numbers on 208
each membrane were estimated from counts of a minimum of 20 fields of view and the 209
final values were presented as log total cells/cm2. 210
Planktonic culture densities were also determined for the same time points (30 min for 211
adhesion and 4, 8, 12, 16, 20 and 24 h for biofilm studies) by reading the optical density 212
(OD) at 610 nm using a microtiter plate reader (SpectraMax M2E, Molecular Devices, 213
UK). 214
To determine the initial adhesion, biofilm development and planktonic growth rates, three 215
independent experiments were performed for each surface, each of them with a triplicate 216
set of wells. 217
218
Quantification of extracellular polymeric substances (EPS) 219
The content of the main EPS found in biofilms (proteins and polysaccharides) formed on 220
the different materials was assessed after 24 h of biofilm growth. Matrix proteins and 221
polysaccharides from biofilms were separated from cells using Dowex resin (50 X 8, Na+ 222
form, 20-50 mesh; Fluka Chemika, Switzerland), according to the procedure described 223
10 by Simões et al.39 Twelve coupons of each material were removed from the microtiter 224
plate and the biofilms were suspended in 10 mL of extraction buffer (2 mM Na3PO4, 2 225
mM NaH2PO4, 9 mM NaCl and 1 mM KCl, pH 7). Then, 50 g of Dowex resin per g of 226
volatile solids39 were added to the biofilm suspension. The extraction took place for 4 h 227
at 4 ºC (with stirring at 400 rpm), and ultimately the extracellular components (matrix) 228
were separated from the cells through centrifugation (for 6 min at 3202 g). Total protein 229
and polysaccharide content was assessed prior to extraction procedure. Protein (total and 230
matrix) amount was determined for each material by the Bicinchoninic Acid Protein 231
Assay Kit – BCATM Protein Assay Kit (Thermo Fisher Scientific, USA) and 232
polysaccharide (total and matrix) concentration was quantified by the phenol-sulphuric 233
acid method of DuBois et al.40 Protein and polysaccharide specific amounts were 234
calculated taking into account the biofilm dry-weight assessed as described by Sousa et 235
al.41 Briefly, coupons obtained after 24 h of biofilm growth were removed from the plate 236
wells and dried at 80 ºC for 24 h. The coupons were then weighed and the biofilms were 237
scraped from the surface, which was then cleaned with ethanol, left overnight at 80 ºC 238
and then weighed. Biofilm dry-weights were assessed by the difference between the 239
weight of the coupon with and without the biomass attached. 240
241
Antibiotics and determination of biofilm minimum inhibitory concentration 242
(biofilm MIC) 243
The antibiotics used in this study were ciprofloxacin (Sigma-Aldrich Co., Portugal) and 244
ampicillin (AppliChem, Germany). 245
The biofilm MIC is defined as the lowest antibiotic concentration that inhibits visible 246
growth42 and was determined according to Takahashi et al.43 with some modifications. 247
Sterile 96-well polystyrene, flat-bottomed microtiter plate (Orange Scientific, USA) were 248
11 filled with 200 µL of cells at 1 x 10⁷ cells/mLin Mueller-Hinton broth supplemented with 249
each antibiotic at different concentrations. After 24 h of incubation at 37 ºC, the medium 250
was removed and the wells were washed to remove non-adherent bacterial cells. The 251
biofilms were suspended in saline solution by pipetting up and down and the OD was 252
measured at 610 nm using a microtiter plate reader (SpectraMax M2E, Molecular 253
Devices, UK). The biofilm MIC values were 0.08 µg/mL and 50 µg/mL for ciprofloxacin 254
and ampicillin, respectively (data not shown). 255
256
Biofilm susceptibility 257
To assess the susceptibility of biofilms developed on all tested surfaces, a concentration 258
corresponding to 5 × biofilm MIC of ciprofloxacin and ampicillin (0.4 µg/mL and 250 259
µg/mL, diluted in Mueller-Hinton medium, respectively) was added to the coupons after 260
24 h of incubation. The biofilm cells were exposed to antibiotics for 7.5 h and different 261
coupons of each material were sampled every 1.5 h. The biofilms were suspended as 262
previously described for initial adhesion and biofilm assays, filtered through a 263
Nucleopore, Track-Etch Membrane (Whatman Int., Ltd., USA) black polycarbonate 264
membrane (pore size 0.2 µm) and stained with the Live/Dead® (L/D) BacLightTM 265
Bacterial Viability kit (Invitrogen Life Technologies, Alfagene, Portugal) for 10 min in 266
the dark.27,44 Bacterial observation and counting of viable and non-viable bacteria was 267
also performed as indicated for initial adhesion and biofilm assays. For viability 268
assessment, live cells were divided by the total cell number (live plus dead cells) and the 269
result was expressed in percentage of cell viability. In the specific case of glass, the 270
percentage of total cell removal was also determined. One sample was analysed prior to 271
antibiotic exposure (time 0 h) confirming that 100% of the cells were viable. Three 272
12 independent experiments were performed for each surface, each of them with a triplicate 273
set of wells. 274
275
Scanning electron microscopy (SEM) 276
The morphological changes of E. coli biofilms formed on glass coupons and exposed to 277
6 h of antibiotic treatments were assessed by SEM. From the studied materials, glass was 278
selected for SEM analysis since it had the lowest cell density after 24 h, which facilitates 279
cell size determination. Prior to observation, biofilm samples were fixed and dehydrated 280
as fully described by Gomes et al.45 Coupons were then air-dried for 1 day in a desiccator 281
and sputter-coated with a palladium-gold thin film45 using the SPI Module Sputter Coater 282
equipment for 120 s at 15 mA current. The biofilms were viewed with a SEM/EDS system 283
(FEI Quanta 400FEG ESEM/EDAX Genesis X4M, FEI Company, USA) in high-vacuum 284
mode at 15 kV to observe biofilm morphology. Twenty images were analysed in the 285
absence of antibiotics and in the presence of each antibiotic studied (surfaces from three 286
independent wells were analysed). Cell length was determined using the microscope 287
software (xT Microscope Control, FEI Company, USA) by measuring 100 randomly 288
selected cells in each condition. 289
290
Statistical analysis 291
The adhesion, biofilm growth and susceptibility assays were compared using one-way 292
analysis of variance (ANOVA) by applying Levene’s test of homogeneity of variances 293
and the Tukey multiple comparison tests using IBM SPSS Statistics software version 21. 294
Paired t-test analysis was also performed when appropriate. All tests were used based on 295
a confidence level of 95% (differences reported as significant for p values < 0.05). 296
13
RESULTS 298
Surface physico-chemical analysis 299
The surface hydrophobicity of the E. coli cells and of the GLA, SS, PVC and SIL surfaces 300
was determined. It was found that the cell surface was hydrophilic since ∆𝐺𝑖𝑤𝑖 is positive 301
(Table 1). From Table 1, it can be also observed that this E. coli strain had predominantly 302
an electron donor surface (higher value of 𝛾−), with a very low electron acceptor character
303
(𝛾+). Concerning the material surfaces, GLA was hydrophilic (∆𝐺
𝑖𝑤𝑖 > 0 mJ/m2), whereas 304
the remaining materials (SS, PVC and SIL) were hydrophobic (∆𝐺𝑖𝑤𝑖 < 0 mJ/m2). From 305
the hydrophobic materials, SIL was the most hydrophobic (p < 0.05), mainly due to its 306
lower electron donor character, followed by PVC and SS. 307
In order to predict the probability of E. coli adhesion to the four tested materials, the free 308
energy of interaction between the bacteria and the surfaces was calculated (Table 2). The 309
results show that adhesion to SS, PVC and GLA was not thermodynamically favored 310
(∆𝐺𝑖𝑤𝐼𝑇𝑂𝑇 > 0 mJ/m2), whereas adhesion to SIL was favored (∆𝐺
𝑖𝑤𝐼𝑇𝑂𝑇 < 0 mJ/m2). 311
312
Bacterial adhesion and biofilm development 313
E. coli adhesion and biofilm growth on the four different materials is shown in Figure 1.
314
Initial adhesion was determined after 30 min and significant differences (p < 0.05) were 315
observed in all materials (Figure 1B). Furthermore, the extent of adhesion to silicone was 316
approximately 5-fold higher than to glass, which was the material with fewer adhered 317
cells after the initial period. Interestingly, glass was also the material showing the lowest 318
number of adhered cells in the following data points concerning biofilm development (p 319
< 0.05). Biofilm formation results (assayed in the period between 4 and 24 h) followed 320
the initial adhesion trend for most of the time points (except for 4 and 8 h for PVC and 321
SS) with statistically significant results obtained at 16 and 24 h (p < 0.05). Thus, with few 322
14 exceptions, the adhesion and biofilm development trend was: SIL > PVC > SS > GLA. It 323
is noteworthy that for SS and PVC, there were no statistically significant differences in 324
the cell density determined on both materials in the majority of time points. 325
Overall, the amount of biofilm formed in all the materials increased with time and so did 326
the planktonic cell concentration (Figure 1A) that also increased with similar trends in all 327
tested conditions. 328
The first 4 hours of experiment were those that showed the highest growth rate of 329
planktonic (Figure 1A) and sessile cells (Figure 1B) since the optical density and the total 330
number of adhered cells increased on average 16 and 7.5-fold, respectively, while in the 331
remaining 4 h intervals, the OD and the biofilm only increased on average 1.3 and 1.5 332
fold. 333
334
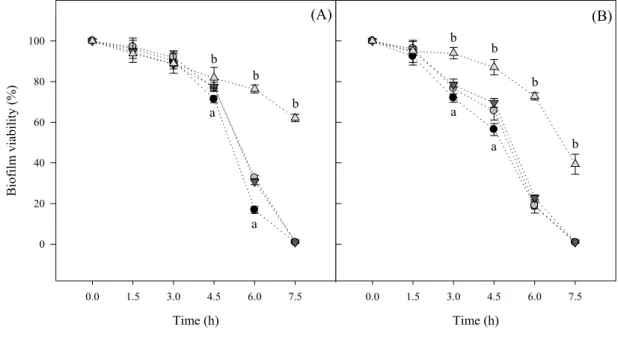
Biofilm susceptibility assays 335
Figure 2 presents the susceptibility curves of E. coli biofilms formed on all materials to a 336
concentration equivalent to 5 × biofilm MIC of the antibiotics tested, ciprofloxacin 337
(Figure 2A) and ampicillin (Figure 2B). Regardless of the antibiotic used, biofilms 338
formed on GLA, PVC and SS were more susceptible to the antimicrobial treatments than 339
SIL since complete inactivation was attained after 7.5 h. A 7-log decrease was obtained 340
on average for GLA, PVC and SS, whereas a 2-log reduction was obtained for cells 341
adhered to SIL. Concerning the effect of ciprofloxacin (Figure 2A), the same reduction 342
in biofilm viability was observed after a 3 h contact for all materials. From this moment 343
onwards, the viability of biofilms obtained on GLA, PVC and SS markedly decreased and 344
complete inactivation was attained at the end of the experiment. For the silicone surface, 345
approximately 60% of the cells were still viable after the treatment. For ampicillin (Figure 346
2B), the decrease on biofilm viability in the first 4.5 h was more pronounced than with 347
15 ciprofloxacin for GLA, PVC and SS, but complete inactivation was also attained after 348
treatment for these surfaces whereas for SIL, 36% survived after exposure. 349
In order to evaluate the contribution of EPS to the biofilm susceptibility, the exopolymeric 350
matrix of all biofilms was extracted and quantified in terms of protein and polysaccharide 351
content. According to the results presented in Table 3, the amount of total and matrix 352
polymers (both proteins and polysaccharides) did not vary significantly (p < 0.05) with 353
the surface used. 354
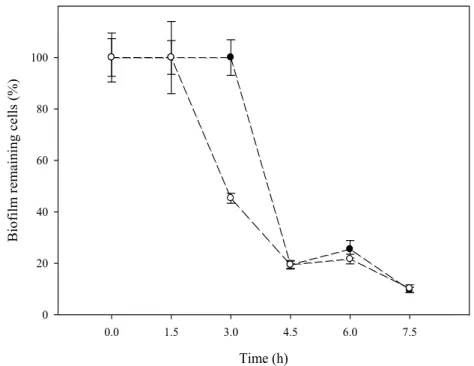
Besides their effect on viability, the antimicrobial treatments promoted a significant 355
reduction on the total biofilm cell numbers. The results obtained for GLA (Figure 3) show 356
that between 1.5 and 3 h a reduction of 55% was obtained for ampicillin and a reduction 357
of 81% was obtained for ciprofloxacin after 4.5 h. Similar reduction profiles were 358
obtained for the remaining surfaces (data not shown). 359
360
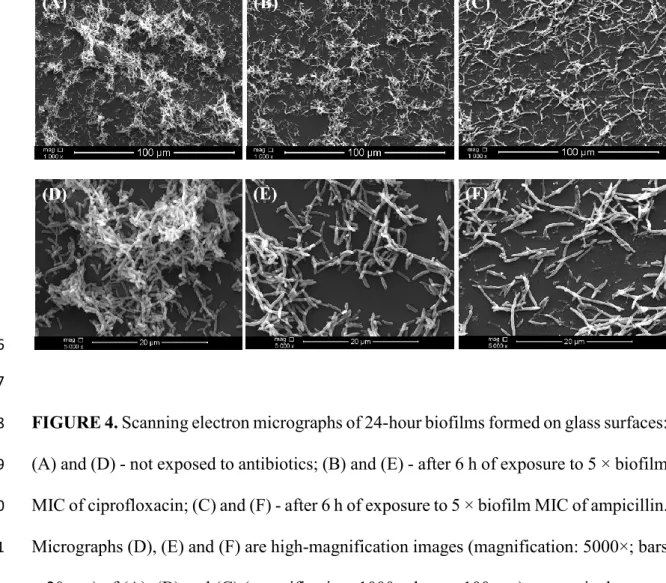
SEM analysis of biofilm morphology 361
The morphological changes on the biofilm formed on glass coupons upon exposure to the 362
antibiotics were analysed by SEM (Figure 4). The micrographs of adherent cells subjected 363
to 5 × biofilm MIC of ciprofloxacin and ampicillin (Figures 4B and C) confirm that the 364
antibiotic treatment reduced the total number of initially attached cells, as seen on Figure 365
3. These images show that antibiotic-treated cells had filamentous forms when compared 366
to the control cells (not subjected to the treatments, Figure 4A). Moreover, biofilms 367
exposed to ampicillin had the most elongated shape. Determination of the cell length in 368
the higher magnification images (Figures 4D-F) resulted in a bar chart showing the size 369
distribution of biofilms cells exposed and not exposed to antibiotics (Figure 5). While 370
non-exposed cells had lengths ranging from 1.1 to 2.7 µm, those exposed to ciprofloxacin 371
measured between 2 and 7.1 µm (on average 2-fold longer), whereas cell lengths up to 372
16 9.1 µm were determined for ampicillin (on average 3.6-fold longer than the non-exposed 373
cells). Also, a much narrower size distribution was found for the non-exposed cells. 374
375
DISCUSSION 376
Initial adhesion and biofilm development 377
The first aim of this study was to assess if the initial adhesion of E. coli was related to the 378
surface properties of the tested materials. The results indicated that the highest level of E. 379
coli adhesion occurred when the hydrophobic SIL (∆𝐺𝑖𝑤𝑖 < 0 mJ/m2) was used as
380
substratum, followed by PVC and SS (∆𝐺𝑖𝑤𝑖 < 0 mJ/m2) with less hydrophobic character. 381
In contrast, the hydrophilic glass (∆𝐺𝑖𝑤𝑖 > 0 mJ/m2) was the less colonized surface. These 382
findings suggest that the substratum hydrophobicity is a major factor in the initial 383
adhesion of bacteria, with hydrophobic materials promoting adhesion. This increased 384
adhesion to hydrophobic surfaces has been reported by independent groups for both 385
Gram-negative46-48 and Gram-positive bacteria.49,50 Previous studies31,51,52 have shown 386
that bacterial adhesion can be correlated with surface hydrophobicity, but although 387
increasing adhesion was obtained with increasing hydrophobicity, a weak correlation (r2 388
= 0.78) between these two variables was found in this study. 389
According to the thermodynamic approach which considers the physico-chemical 390
interactions, adhesion is favorable only when the resulting free energy is negative. Using 391
this approach, it was concluded that adhesion is thermodynamically less favorable for 392
glass (positive value of ∆𝐺𝑖𝑤𝐼𝑇𝑂𝑇) and more favorable for silicone (negative value of 393
∆𝐺𝑖𝑤𝐼𝑇𝑂𝑇). The adhesion tests of 30 min for GLA and SIL were in agreement with the 394
thermodynamic approach since cells adhere to a lesser and a greater extent to GLA and 395
SIL, respectively. Silicone surface is considerably prone to colonization by E. coli,53-55 396
despite it is widespread use in biomedical devices. 397
17 After establishing an association between surface hydrophobicity and initial adhesion, the 398
second objective of this work was to evaluate if the buildup of biofilm was correlated 399
with initial adhesion. This would establish a link between surface properties and biofilm 400
development. It has been shown that in some clinical situations, like the development of 401
E. coli biofilms in urinary catheters, biofilms are completely mature after 24 h.13 In the
402
present work, a direct relationship was found between the amount of mature biofilm 403
formed and the extent of the initial adhesion, as previously reported by Busscher & van 404
Der Mei56 for flow conditions and Simões LC et al.1 for static conditions. 405
Unlike adhesion and biofilm maturation, the physico-chemical properties of materials 406
appear to have negligible impact on E. coli planktonic growth. 407
408
Biofilm susceptibility 409
After establishing a link between the surface properties and biofilm formation, a third 410
goal of this work was to assess if biofilms formed in different materials had different 411
susceptibilities to antibiotic treatment. The results showed that biofilms growing in 412
silicone were less susceptible when compared to those obtained on the other materials. It 413
is widely known that the extracellular matrix is extremely important for protection against 414
antibiotic effects10,41 and therefore the exopolymeric matrix of all biofilms was quantified 415
in order to see if significant differences could be found among the biofilms formed in 416
different materials. The results showed that the EPS composition was not a major factor 417
affecting biofilm sensitivity to the antibiotics. We speculate that the biofilms developed 418
on silicone were less susceptible due to their higher cell density (number of cells per unit 419
area). The spatial arrangement of a higher number of cells may create concentration 420
gradients (of nutrients, antibiotic and oxygen) within the structure of the biofilms, a 421
phenomenon described by Stewart & Costerton,57 contributing to the decreased biofilm 422
18 susceptibility to antibiotics.58,59 It has already been reported that the relative efficacy of 423
some antimicrobial agents declines with the density of cells exposed.10,60-62 In the work 424
of Mah & O'Toole,10 penetration of hydrogen peroxide was more difficult in thicker 425
biofilms grown on glass slides (average cell density of 4x10⁷ cells/cm2) than in a thin 426
biofilm-covered bead (average cell density of 3x10³ cells/cm2). Hence, it can be 427
concluded that the surface properties affected the antibiotic susceptibility of biofilms63-66 428
by influencing the amount of cells attached to the substratum after 24 h. Gristina et al.63 429
were the first authors to suggest that the degree of colonization and antibiotic resistance 430
are related to the biomaterial and may be altered by biomaterial-induced phenotypic 431
changes rather than by a barrier effect of exopolysaccharides. Similarly, Webb et al.64 432
found that the surface-adherent mode of bacterial growth determines the antibiotic 433
resistance of biofilms. On the other hand, Arciola et al.65 concluded that some materials 434
can lead to the selection of variant adhesive bacteria with increased antibiotic resistance 435
among the whole contaminant bacterial population. 436
Lastly, a filamentous morphology of biofilm cells exposed to antibiotics was visualized 437
by SEM. It is well documented that antibiotics can affect bacteria in ways other than the 438
expected bactericidal or bacteriostatic action, in particular they can induce morphological 439
changes.67-70 A common response of Gram-negative bacilli to the effects of β-lactam 440
antibiotics is an abnormal elongation of the individual cells, with subsequent formation 441
of long filamentous forms.68 This type of aberrant morphological change is the outcome 442
of the selective binding of β-lactams to cellular surface protein components responsible 443
for cell wall septum formation and separation of two divided organisms.67 E. coli cell 444
filamentation as a result of exposure to ciprofloxacin was also observed by some 445
investigators71-73 and it was associated with the induction of SOS response.69 In the 446
present study, it was demonstrated for the first time that biofilm cells exposed to 447
19 ciprofloxacin had smaller sizes when compared with those in contact with ampicillin 448
(belonging to a different class of antibiotics). 449
This work revealed that the surface properties of a given material can influence the initial 450
adhesion of bacterial cells which in turn may affect the development of mature biofilms 451
and consequently the efficiency of antibiotic treatment. Thus, these results suggest that 452
modification of the surface properties (such as hydrophobicity) of materials that are used 453
for the construction of biomedical devices may be used as a strategy to increase the 454
efficacy of antimicrobial therapy. 455
456
ACKNOWLEDGMENTS 457
The authors acknowledge the financial support provided by the Operational Programme 458
for Competitiveness Factors – COMPETE, European Fund for Regional Development – 459
FEDER and by the Portuguese Foundation for Science and Technology – FCT, through 460
Projects PTDC/EBB-BIO/102863/2008 and PTDC/EBB-BIO/104940/2008. LC Gomes 461
was supported by a Ph.D. grant from FCT (SFRH/BD/80400/2011). 462
463
REFERENCES 464
1. Simões LC, Simões M, Vieira MJ. Adhesion and biofilm formation on polystyrene 465
by drinking water-isolated bacteria. Antonie van Leeuwenhoek 2010;98(3):317-466
329. 467
2. van Oss CJ. Hydrophobicity of biosurfaces - origin, quantitative determination and 468
interaction energies. Colloids Surf, B 1995;5(3–4):91-110. 469
3. Fonseca AP, Granja PL, Nogueira JA, Oliveira DR, Barbosa MA. Staphylococcus 470
epidermidis RP62A adhesion to chemically modified cellulose derivatives. J Mater
471
Sci - Mater Med 2001;12(6):543-548. 472
20 4. Doyle RJ. Contribution of the hydrophobic effect to microbial infection. Microbes 473
Infect 2000;2(4):391-400. 474
5. Tenke P, Kovacs B, Jäckel M, Nagy E. The role of biofilm infection in urology. 475
World J Urol 2006;24(1):13-20. 476
6. Trautner BW, Darouiche RO. Role of biofilm in catheter-associated urinary tract 477
infection. Am J Infect Control 2004;32(3):177-183. 478
7. Schinabeck MK, Ghannoum MA. Biofilm-related indwelling medical device 479
infections. In: Pace JL, Rupp ME, Finch R, editors. Biofilms, infection, and 480
antimicrobial therapy. Boca Raton: CRC Press; 2005. p 39-50. 481
8. Abreu AC, Tavares RR, Borges A, Mergulhão F, Simões M. Current and emergent 482
strategies for disinfection of hospital environments. J Antimicrob Chemother 483
2013;68(12):2718-32. 484
9. Russell AD. Biocide use and antibiotic resistance: the relevance of laboratory 485
findings to clinical and environmental situations. Lancet Infect Dis 2003;3(12):794-486
803. 487
10. Mah T-FC, O'Toole GA. Mechanisms of biofilm resistance to antimicrobial agents. 488
Trends Microbiol 2001;9(1):34-39. 489
11. LeBel M. Ciprofloxacin: chemistry, mechanism of action, resistance, antimicrobial 490
spectrum, pharmacokinetics, clinical trials, and adverse reactions. Pharmacotherapy 491
1988;8(1):3-30. 492
12. Rolinson GN, Macdonald AC, Wilson DA. Bactericidal action of β-lactam 493
antibiotics on Escherichia coli with particular reference to ampicillin and 494
amoxycillin. J Antimicrob Chemother 1977;3(6):541-553. 495
21 13. Koseoglu H, Aslan G, Esen N, Sen BH, Coban H. Ultrastructural stages of biofilm 496
development of Escherichia coli on urethral catheters and effects of antibiotics on 497
biofilm formation. Urology 2006;68(5):942-946. 498
14. Reid G, Tieszer C, Foerch R, Busscher HJ, Khoury AE, Bruce AW. Adsorption of 499
ciprofloxacin to urinary catheters and effect on subsequent bacterial adhesion and 500
survival. Colloids Surf, B 1993;1(1):9-16. 501
15. Hooton TM, Bradley SF, Cardenas DD, Colgan R, Geerlings SE, Rice JC, Saint S, 502
Schaeffer AJ, Tambayh PA, Tenke P. Diagnosis, prevention, and treatment of 503
catheter-associated urinary tract infection in adults: 2009 International Clinical 504
Practice Guidelines from the Infectious Diseases Society of America. Clin Infect 505
Dis 2010;50(5):625-663. 506
16. Zhanel GG, Karlowsky JA, Harding GKM, Carrie A, Mazzulli T, Low DE, Group 507
TCUIS, Hoban DJ. A canadian national surveillance study of urinary tract isolates 508
from outpatients: comparison of the activities of trimethoprim-sulfamethoxazole, 509
ampicillin, mecillinam, nitrofurantoin, and ciprofloxacin. Antimicrob Agents 510
Chemother 2000;44(4):1089-1092. 511
17. Cerqueira L, Oliveira JA, Nicolau A, Azevedo NF, Vieira MJ. Biofilm formation 512
with mixed cultures of Pseudomonas aeruginosa/Escherichia coli on silicone using 513
artificial urine to mimic urinary catheters. Biofouling 2013;29(7):829-840. 514
18. Lawrence EL, Turner IG. Materials for urinary catheters: a review of their history 515
and development in the UK. Med Eng Phys 2005;27(6):443-453. 516
19. Hron P. Hydrophilisation of silicone rubber for medical applications. Polym Int 517
2003;52(9):1531-1539. 518
20. Winters GL, Nutt MJ. Stainless steels for medical and surgical applications. 519
Montgomery: ASTM International; 2003. 520
22 21. Gorman SP, Jones DS. Medical device composition and biological secretion 521
influences on biofilm formation. In: Pace JL, Rupp ME, Finch R, editors. Biofilms, 522
infection, and antimicrobial therapy. Boca Raton: CRC Press; 2006. p 51-72. 523
22. Seil JT, Rubien NM, Webster TJ, Tarquinio KM. Comparison of quantification 524
methods illustrates reduced Pseudomonas aeruginosa activity on nanorough 525
polyvinyl chloride. J Biomed Mater Res B 2011;98B(1):1-7. 526
23. Salvador E, Wagenlehner F, Köhler C-D, Mellmann A, Hacker J, Svanborg C, 527
Dobrindt U. Comparison of asymptomatic bacteriuria Escherichia coli isolates from 528
healthy individuals versus those from hospital patients shows that long-term bladder 529
colonization selects for attenuated virulence phenotypes. Infect Immun 530
2012;80(2):668-678. 531
24. Jacobsen SM, Stickler DJ, Mobley HLT, Shirtliff ME. Complicated catheter-532
associated urinary tract infections due to Escherichia coli and Proteus mirabilis. 533
Clin Microbiol Rev 2008;21(1):26-59. 534
25. Dorel C, Lejeune P, Jubelin G. Role of biofilms in infections caused by Escherichia 535
coli. In: Pace JL, Rupp ME, Finch R, editors. Biofilms, infection, and antimicrobial
536
therapy. Boca Raton: CRC Press; 2005. p 73-80. 537
26. Foxman B. Epidemiology of urinary tract infections: incidence, morbidity, and 538
economic costs. Dis Mon 2003;49(2):53-70. 539
27. Teodósio JS, Simões M, Mergulhão FJ. The influence of nonconjugative 540
Escherichia coli plasmids on biofilm formation and resistance. J Appl Microbiol
541
2012;113(2):373-382. 542
28. Gomes LC, Moreira JMR, Teodósio JS, Araújo JDP, Miranda JM, Simões M, Melo 543
LF, Mergulhão FJ. 96-well microtiter plates for biofouling simulation in biomedical 544
settings. Biofouling 2014;30(5):535-546. 545
23 29. Teodósio JS, Simões M, Melo LF, Mergulhão FJ. Flow cell hydrodynamics and 546
their effects on E. coli biofilm formation under different nutrient conditions and 547
turbulent flow. Biofouling 2011;27(1):1-11. 548
30. Azevedo NF, Pacheco AP, Keevil CW, Vieira MJ. Adhesion of water stressed 549
Helicobacter pylori to abiotic surfaces. J Appl Microbiol 2006;101(3):718-724.
550
31. Simões LC, Simões M, Oliveira R, Vieira MJ. Potential of the adhesion of bacteria 551
isolated from drinking water to materials. J Basic Microbiol 2007;47(2):174-183. 552
32. Simões M, Simões LC, Cleto S, Pereira MO, Vieira MJ. The effects of a biocide 553
and a surfactant on the detachment of Pseudomonas fluorescens from glass 554
surfaces. Int J Food Microbiol 2008;121(3):335-341. 555
33. Busscher HJ, Weerkamp AH, van der Mei HC, van Pelt AW, de Jong HP, Arends 556
J. Measurement of the surface free energy of bacterial cell surfaces and its relevance 557
for adhesion. Appl Environ Microbiol 1984;48(5):980-983. 558
34. Janczuk B, Chibowski E, Bruque JM, Kerkeb ML, Caballero FG. On the 559
consistency of surface free energy components as calculated from contact angles of 560
different liquids: an application to the cholesterol surface. J Colloid Interface Sci 561
1993;159(2):421-428. 562
35. van Oss CJ, Chaudhury MK, Good RJ. Monopolar surfaces. Adv Colloid Interface 563
Sci 1987;28(1):35-64. 564
36. Van Oss CJ, Good RJ, Chaudhury MK. Additive and nonadditive surface tension 565
components and the interpretation of contact angles. Langmuir 1988;4(4):884-891. 566
37. Van Oss CJ, Ju L, Chaudhury MK, Good RJ. Estimation of the polar parameters of 567
the surface tension of liquids by contact angle measurements on gels. J Colloid 568
Interface Sci 1989;128(2):313-319. 569
24 38. Saby S, Sibille I, Mathieu L, Paquin JL, Block JC. Influence of water chlorination 570
on the counting of bacteria with DAPI (4',6-diamidino-2-phenylindole). Appl 571
Environ Microbiol 1997;63(4):1564-9. 572
39. Simões M, Pereira MO, Vieira MJ. Effect of mechanical stress on biofilms 573
challenged by different chemicals. Water Res 2005;39(20):5142-5152. 574
40. DuBois M, Gilles KA, Hamilton JK, Rebers PA, Smith F. Colorimetric method for 575
determination of sugars and related substances. Anal Chem 1956;28(3):350-356. 576
41. Sousa C, Teixeira P, Oliveira R. The role of extracellular polymers on 577
Staphylococcus epidermidis biofilm biomass and metabolic activity. J Basic
578
Microbiol 2009;49(4):363-370. 579
42. May T, Ito A, Okabe S. Induction of multidrug resistance mechanism in 580
Escherichia coli biofilms by interplay between tetracycline and ampicillin
581
resistance genes. Antimicrob Agents Chemother 2009;53(11):4628-4639. 582
43. Takahashi N, Ishihara K, Kato T, Okuda K. Susceptibility of Actinobacillus 583
actinomycetemcomitans to six antibiotics decreases as biofilm matures. J
584
Antimicrob Chemother 2007;59(1):59-65. 585
44. Simões M, Pereira MO, Vieira MJ. Validation of respirometry as a short-term 586
method to assess the efficacy of biocides. Biofouling 2005;21(1):9-17. 587
45. Gomes LC, Moreira JMR, Miranda JM, Simões M, Melo LF, Mergulhão FJ. 588
Macroscale versus microscale methods for physiological analysis of biofilms 589
formed in 96-well microtiter plates. J Microbiol Methods 2013;95(3):342-349. 590
46. Shrove GS, Olsen RH, Vogel TM. Development of pure culture biofilms of P. 591
putida on solid supports. Biotechnol Bioeng 1991;37(6):512-518.
592
47. Verran J, Taylor RL, Lees GC. Bacterial adhesion to inert thermoplastic surfaces. J 593
Mater Sci - Mater Med 1996;7(10):597-601. 594
25 48. Faille C, Jullien C, Fontaine F, Bellon-Fontaine M-N, Slomianny C, Benezech T. 595
Adhesion of Bacillus spores and Escherichia coli cells to inert surfaces: role of 596
surface hydrophobicity. Can J Microbiol 2002;48(8):728-738. 597
49. Cerca N, Pier GB, Vilanova M, Oliveira R, Azeredo J. Quantitative analysis of 598
adhesion and biofilm formation on hydrophilic and hydrophobic surfaces of clinical 599
isolates of Staphylococcus epidermidis. Res Microbiol 2005;156(4):506-514. 600
50. MacKintosh EE, Patel JD, Marchant RE, Anderson JM. Effects of biomaterial 601
surface chemistry on the adhesion and biofilm formation of Staphylococcus 602
epidermidis in vitro. J Biomed Mater Res A 2006;78A(4):836-842.
603
51. Sousa C, Teixeira P, Oliveira R. Influence of surface properties on the adhesion of 604
Staphylococcus epidermidis to acrylic and silicone. Int J Biomat 2009:Article ID
605
718017. 606
52. Oliveira R, Azeredo J, Teixeira P, Fonseca A. The role of hydrophobicity in 607
bacterial adhesion. In: Gilbert P, Allison DG, Brading M, Verran J, Walker J, 608
editors. Biofilm community and interactions: chance or necessity? Cardiff: Bioline; 609
2001. p 11-22. 610
53. Reid G, van der Mei HC, Tieszer C, Busscher HJ. Uropathogenic Escherichia coli 611
adhere to urinary catheters without using fimbriae. FEMS Immunol Med Microbiol 612
1996;16(3-4):159-162. 613
54. Simhi E, van der Mei HC, Ron EZ, Rosenberg E, Busscher HJ. Effect of the 614
adhesive antibiotic TA on adhesion and initial growth of E. coli on silicone rubber. 615
FEMS Microbiol Lett 2000;192(1):97-100. 616
55. Wang R, Neoh KG, Shi Z, Kang E-T, Tambyah PA, Chiong E. Inhibition of 617
Escherichia coli and Proteus mirabilis adhesion and biofilm formation on medical
618
grade silicone surface. Biotechnol Bioeng 2012;109(2):336-345. 619
26 56. Busscher HJ, van Der Mei RBHC. Initial microbial adhesion is a determinant for 620
the strength of biofilm adhesion. FEMS Microbiol Lett 1995;128(3):229-234. 621
57. Stewart PS, William Costerton J. Antibiotic resistance of bacteria in biofilms. The 622
Lancet 2001;358(9276):135-138. 623
58. Drenkard E. Antimicrobial resistance of Pseudomonas aeruginosa biofilms. 624
Microbes Infect 2003;5(13):1213-1219. 625
59. Walters MC, Roe F, Bugnicourt A, Franklin MJ, Stewart PS. Contributions of 626
antibiotic penetration, oxygen limitation, and low metabolic activity to tolerance of 627
Pseudomonas aeruginosa biofilms to ciprofloxacin and tobramycin. Antimicrob
628
Agents Chemother 2003;47(1):317-323. 629
60. Pereira AM, Abreu AC, Simões M. Action of kanamycin against single and dual 630
species biofilms of Escherichia coli and Staphylococcus aureus. J Microbiol Res 631
2012;2:84-88. 632
61. Qu Y, Daley AJ, Istivan TS, Rouch DA, Deighton MA. Densely adherent growth 633
mode, rather than extracellular polymer substance matrix build-up ability, 634
contributes to high resistance of Staphylococcus epidermidis biofilms to antibiotics. 635
J Antimicrob Chemother 2010;65(7):1405-1411. 636
62. Perumal P, Mekala S, Chaffin WL. Role for cell density in antifungal drug 637
resistance in Candida albicans biofilms. Antimicrob Agents Chemother 638
2007;51(7):2454-2463. 639
63. Gristina AG, Jennings RA, Naylor PT, Myrvik QN, Webb LX. Comparative in vitro 640
antibiotic resistance of surface-colonizing coagulase-negative staphylococci. 641
Antimicrob Agents Chemother 1989;33(6):813-816. 642
64. Webb LX, Holman J, de Araujo B, Zaccaro DJ, Gordon ES. Antibiotic resistance 643
in staphylococci adherent to cortical bone. J Orthop Trauma 1994;8(1):28-33. 644
27 65. Arciola CR, Campoccia D, Montanaro L. Effects on antibiotic resistance of 645
Staphylococcus epidermidis following adhesion to polymethylmethacrylate and to
646
silicone surfaces. Biomaterials 2002;23(6):1495-1502. 647
66. Naylor PT, Myrvik QN, Gristina A. Antibiotic resistance of biomaterial-adherent 648
coagulase-negative and coagulase-positive staphylococci. Clin Orthop Relat Res 649
1990;261:126-33. 650
67. Martinez OV, Gratzner HG, Malinin TI, Ingram M. The effect of some β-lactam 651
antibiotics on Escherichia coli studied by flow cytometry. Cytometry 652
1982;3(2):129-133. 653
68. Jacques M, Lebrun A, Foiry B, Dargis M, Malouin F. Effects of antibiotics on the 654
growth and morphology of Pasteurella multocida. J Gen Microbiol 655
1991;137(11):2663-2668. 656
69. Wickens HJ, Pinney RJ, Mason DJ, Gant VA. Flow cytometric investigation of 657
filamentation, membrane patency, and membrane potential in Escherichia coli 658
following ciprofloxacin exposure. Antimicrob Agents Chemother 2000;44(3):682-659
687. 660
70. Yao Z, Kahne D, Kishony R. Distinct single-cell morphological dynamics under 661
beta-lactam antibiotics. Molecular Cell 2012;48(5):705-712. 662
71. Silva F, Lourenco O, Queiroz JA, Domingues FC. Bacteriostatic versus bactericidal 663
activity of ciprofloxacin in Escherichia coli assessed by flow cytometry using a 664
novel far-red dye. J Antibiot 2011;64(4):321-325. 665
72. Mason DJ, Power EG, Talsania H, Phillips I, Gant VA. Antibacterial action of 666
ciprofloxacin. Antimicrob Agents Chemother 1995;39(12):2752-8. 667
73. Elliott TSJ, Shelton A, Greenwood D. The response of Escherichia coli to 668
ciprofloxacin and norfloxacin. J Med Microbiol 1987;23(1):83-88. 669
28
Table and Figure captions 670
Table I. Contact angles with water (𝜃𝑤), formamide (𝜃𝐹) and α-bromonaphthalene (𝜃𝐵), 671
surface tension parameters and free energy of interaction (∆𝐺𝑖𝑤𝑖) between two entities of 672
a given material (𝑖) (surface or bacteria) when immersed in water (𝑤). Values are means 673
± SDs of three independent experiments 674
Table II. Free energy of adhesion (∆𝐺𝑖𝑤𝐼𝑇𝑂𝑇) between E. coli and the different surfaces when 675
immersed in water (𝑤) 676
Table III. Characteristics of the E. coli biofilm formed on different materials after 24 677
hours of growth 678
Figure 1. Planktonic growth curves (A) and number of adhered cells (B) of E. coli on 679
different materials along time: GLA ( and ), SS ( and ), PVC ( and 680
) and SIL ( and ). Initial adhesion corresponds to the time point of 0.5 h, 681
while 4, 8, 12, 16, 20 and 24 h refer to biofilm development. In panel B, for each time 682
point, letters were assigned in alphabetic order from the lowest to the highest value (from 683
a to d). These assignments were made as long as statistically significant differences exist 684
between materials (for a confidence level greater than 95%, p < 0.05). The means ± SDs 685
for three independent experiments are illustrated. 686
Figure 2. Time-course of cell viability for 24-hour biofilms formed on different materials 687
after exposure to 5 × biofilm MIC of ciprofloxacin (A) and ampicillin (B). GLA ( ), 688
SS ( ), PVC ( ) and SIL ( ). Results are presented as a percentage of initial 689
viability determined by Live/Dead staining. Statistical analysis for a confidence level 690
greater than 95% (p < 0.05) are pointed as: a – glass is different from the other materials, 691
b – silicone is different from the other materials. The means ± SDs for three independent 692
experiments are presented. 693
29 Figure 3. Evolution of glass attached cells from 24-hour biofilms after exposure to 5 × 694
biofilm MIC of ciprofloxacin ( ) and ampicillin ( ). Results are expressed as a 695
percentage of remaining attached cells determined by Live/Dead staining considering the 696
sum of viable and non-viable cells. The means ± SDs for three independent experiments 697
are illustrated. 698
Figure 4. Scanning electron micrographs of 24-hour biofilms formed on glass surfaces: 699
(A) and (D) - not exposed to antibiotics; (B) and (E) - after 6 h of exposure to 5 × biofilm 700
MIC of ciprofloxacin; (C) and (F) - after 6 h of exposure to 5 × biofilm MIC of ampicillin. 701
Micrographs (D), (E) and (F) are high-magnification images (magnification: 5000×; bars 702
= 20 μm) of (A), (B) and (C) (magnification: 1000×; bars = 100 μm), respectively. 703
Figure 5. Cell length distribution of 24-hour biofilms formed on glass surfaces: ( ) - not 704
exposed to antibiotics; ( ) - after 6 h of exposure to 5 × biofilm MIC of ciprofloxacin; ( 705
) - after 6 h of exposure to 5 × biofilm MIC of ampicillin. The arrows represent the 706
average cell length determined from SEM micrographs for each experimental condition. 707 708 Time (h) 0.0 1.5 3.0 4.5 6.0 7.5 9.0 B io fi lm r ema in in g c el ls ( % ) 0 20 40 60 80 100 120 ciprofloxacin ampicillin Time (h) 0.0 1.5 3.0 4.5 6.0 7.5 9.0 B io fi lm r ema in in g c el ls ( % ) 0 20 40 60 80 100 120 ciprofloxacin ampicillin
30
TABLE I. Contact angles with water (𝜽𝒘), formamide (𝜽𝑭) and α-709
bromonaphthalene (𝜽𝑩), surface tension parameters and free energy of interaction 710
(∆𝑮𝒊𝒘𝒊) between two entities of a given material (𝒊) (surface or bacteria) when 711
immersed in water (𝒘). Values are means ± SDs of three independent experiments 712
713
Contact angle (º) Surface tension
parameters (mJ/m2) Hydrophobicity (mJ/m2) 𝜃𝑤 𝜃𝐹 𝜃𝐵 𝛾𝐿𝑊 𝛾+ 𝛾− (∆𝐺𝑖𝑤𝑖) Surface SIL 115.4 ± 0.4 105.9 ± 0.3 78.4 ± 0.4 16.0 0.0 1.8 -75.0 SS 67.0 ± 1.7 60.4 ± 0.4 39.3 ± 0.5 34.9 0.0 21.7 -10.9 PVC 79.3 ± 0.9 79.4 ± 0.6 40.3 ± 0.5 34.4 0.0 20.9 -12.3 GLA 47.0 ± 0.4 49.1 ± 0.5 63.4 ± 0.9 23.2 1.7 40.2 19.3 Bacteria E. coli 28.3 ± 0.3 38.4 ± 0.4 47.0 ± 0.4 35.3 0.1 59.0 46.0 714 715
31
TABLE II. Free energy of adhesion (∆𝑮𝒊𝒘𝑰𝑻𝑶𝑻) between E. coli and the different 716
surfaces when immersed in water (𝒘) 717 718 ∆𝐺𝑖𝑤𝐼𝑇𝑂𝑇 (mJ/m2) SIL SS PVC GLA E. coli -5.8 20.5 19.8 32.1 719 720
32
TABLE III. Characteristics of the E. coli biofilm formed on different materials after 721
24 hours of growth 722
723
Biofilm characteristics Material
GLA SS PVC SIL Cellular density (cells/cm2) 9.29x10 7 ± 1.07 1.42x10⁸ ± 1.15 2.02x10⁸ ± 1.15 2.71x10⁸ ± 1.18 Total proteins (mg/gbiofilm) 74.1 ± 11.0 75.2 ± 2.43 107.6 ± 18.3 97.1 ± 23.3 Matrix proteins (mg/gbiofilm) 64.7 ± 8.21 58.2 ± 4.86 81.1 ± 5.64 78.7 ± 18.3 Total polysaccharides (mg/gbiofilm) 36.1 ± 14.1 42.3 ± 17.2 58.2 ± 11.6 56.5 ± 13.3 Matrix polysaccharides (mg/gbiofilm) 27.3 ± 10.1 29.4 ± 4.78 45.3 ± 11.9 37.8 ± 13.5 724 725
33 Time (h) -4 0 4 8 12 16 20 24 28 D. O. p la nk ton ic ( 61 0 n m ) 0.0 0.2 0.4 0.6 0.8 1.0 1.2 1.4 (A) 726 Time (h) 0.5 4 8 12 16 20 24 Num ber of adhe red c el ls (l og t ot al ce lls/ cm 2 ) 5.0 5.5 6.0 6.5 7.0 7.5 8.0 8.5 a b cd a a b b b a b b c a bc d d b b a a bc c a b b b (B) 727 728
FIGURE 1. Planktonic growth curves (A) and number of adhered cells (B) of E. coli on 729
different materials along time: GLA ( and ), SS ( and ), PVC ( and 730
) and SIL ( and ). Initial adhesion corresponds to the time point of 0.5 h, 731
34 while 4, 8, 12, 16, 20 and 24 h refer to biofilm development. In panel b, for each time 732
point, letters were assigned in alphabetic order from the lowest to the highest value (from 733
a to d). These assignments were made as long as statistically significant differences exist 734
between materials (for a confidence level greater than 95%, p < 0.05). The means ± SDs 735
for three independent experiments are illustrated. 736
35 Time (h) 0.0 1.5 3.0 4.5 6.0 7.5 9.0 B iofil m v ia bil ity ( %) 0 20 40 60 80 100 120 Time (h) 0.0 1.5 3.0 4.5 6.0 7.5 9.0 (A) (B) a b a b b b b b b a a 738 739
FIGURE 2. Time-course of cell viability for 24-hour biofilms formed on different 740
materials after exposure to 5 × biofilm MIC of ciprofloxacin (A) and ampicillin (B). GLA 741
( ), SS ( ), PVC ( ) and SIL ( ). Results are presented as a percentage of 742
initial viability determined by Live/Dead staining. Statistical analysis for a confidence 743
level greater than 95% (p < 0.05) are pointed as: a – glass is different from the other 744
materials, b – silicone is different from the other materials. The means ± SDs for three 745
independent experiments are presented. 746
36 Time (h) 0.0 1.5 3.0 4.5 6.0 7.5 9.0 Bi of il m r em ai ning cel ls ( %) 0 20 40 60 80 100 120 748 749
FIGURE 3. Evolution of glass attached cells from 24-hour biofilms after exposure to 5 750
× biofilm MIC of ciprofloxacin ( ) and ampicillin ( ). Results are expressed as a 751
percentage of remaining attached cells determined by Live/Dead staining considering the 752
sum of viable and non-viable cells. The means ± SDs for three independent experiments 753 are illustrated. 754 755 Time (h) 0.0 1.5 3.0 4.5 6.0 7.5 9.0 B io fi lm r ema in in g c el ls ( % ) 0 20 40 60 80 100 120 ciprofloxacin ampicillin Time (h) 0.0 1.5 3.0 4.5 6.0 7.5 9.0 B io fi lm r ema in in g c el ls ( % ) 0 20 40 60 80 100 120 ciprofloxacin ampicillin
37 756
757
FIGURE 4. Scanning electron micrographs of 24-hour biofilms formed on glass surfaces: 758
(A) and (D) - not exposed to antibiotics; (B) and (E) - after 6 h of exposure to 5 × biofilm 759
MIC of ciprofloxacin; (C) and (F) - after 6 h of exposure to 5 × biofilm MIC of ampicillin. 760
Micrographs (D), (E) and (F) are high-magnification images (magnification: 5000×; bars 761
= 20 μm) of (A), (B) and (C) (magnification: 1000×; bars = 100 μm), respectively. 762
38 764
765
FIGURE 5. Cell length distribution of 24-hour biofilms formed on glass surfaces: ( ) - 766
not exposed to antibiotics; ( ) - after 6 h of exposure to 5 × biofilm MIC of ciprofloxacin; 767
( ) - after 6 h of exposure to 5 × biofilm MIC of ampicillin. The arrows represent the 768
average cell length determined from SEM micrographs for each experimental condition. 769
770 771 772