The Relative Age Effect
in Elite Rugby Union
DISSERTAÇÃO DE MESTRADO EM CIÊNCIAS DO DESPORTO – ESPECIALIZAÇÃO EM JOGOS DESPORTIVOS COLECTIVOS
TIAGO EMANUEL DA SILVA AZEVEDO
Vila Real, 2013
DISSERTAÇÃO DE MESTRADO EM CIÊNCIAS DO DESPORTO - ESPECIALIZAÇÃO EM JOGOS DESPORTIVOS COLECTIVOS
TIAGO EMANUEL DA SILVA AZEVEDO
Orientador:
Professor Doutor Nuno Leite Co-Orientador:
Professor Doutor Luís Vaz
Vila Real, Janeiro 2013
UNIVERSIDADE TRÁS – OS – MONTES E ALTO DOURO
The Relative Age Effect
in Elite Rugby Union
Este trabalho foi expressamente elaborado com vista à conclusão do 2º Ciclo de estudos de Ciências do Desporto e à obtenção do grau de Mestre em Desporto: especialização em Jogos Desportivos Colectivos
AGRADECIMENTOS
À Marta pelo apoio, união e paciência na elaboração deste trabalho…
À minha família por me terem ajudado a formar e a crescer enquanto pessoa…
Ao Professor Doutor Nuno Leite e Professor Doutor Luís Vaz por toda a sua sapiência, conselhos e desafios na elaboração deste trabalho…
A todos aqueles que ao longo dos tempos tive oportunidade de conhecer e trocar experiências…
Resumo
A presente investigação usou uma nova abordagem para verificar se o efeito da idade relativa está presente ao mais alto nível no Rugby Union. De forma a fundamentar esta investigação, recorremos a uma amostra de jogadores juniores (n=541) e seniores (n=965) que estiveram presentes nas fases finais dos campeonatos do mundo do escalão júnior (2010 e 2011) e sénior (2007 e 2011). Usamos o teste de chi-quadrado de forma a determinar se a distribuição observada nos quartis de nascimento diferem significativamente da distribuição teórica esperada. Foi encontrada uma tendência do efeito da idade relativa com prevalência daqueles que nasceram no primeiro quartil (Q1). Esta tendência encontrada leva-nos a inferir que poderá interferir o desenvolvimento dos jovens jogadores de râguebi e possivelmente condicionar a sua carreira desportiva. O estudo de uma panóplia de factores, que nós pensamos interferir no desenvolvimento longitudinal, combinado com o efeito da idade relativa, irá fornecer grandes preocupações aos jovens jogadores: (i) continuar a desenvolver-se no e com o desporto (podendo atingir alto nível ou não); (ii) abandonar definitivamente o desporto ou até a actividade física em geral. Então, para evitar as consequências negativas deste processo longitudinal, acreditamos que um modelo de desenvolvimento a longo prazo bem construído, sem hiatos, e que considere o desenvolvimento de talento de uma forma multifactorial e dinâmica é vital, pois só assim poderá ser possível incluir os jogadores mais capazes mas também os colegas que possuem índices de maturação mais tardios. O treinador, enquanto facilitador deve ajudar o jovem atleta a inserir-se no seu nível de jogo, ajudando-o a desenvolver-se de acordo com as suas capacidades e potencial.
Palavras-chave:
Abstract
The present research used a novel approach to study if Relative Age Effect is present at elite Rugby Union. To justify this, we have picked a sample of junior (n=541) and senior (n=965) players that were present in the final stages of the junior (2010 and 2011) and senior (2007 and 2011) world cups. To analyze our sample we used the chi-square of fit test in order to determinate if the distribution observed by quartiles differs significantly from the theoretical distribution expected. It was found a Relative Age Effect tendency for those who were born in the first quartile of the year (Q1). We believe that this tendency could be reliable in the development of young rugby players and possibly could hinder their sports career. The study of a range of factors, which we thought had interference in longitudinal development combined with Relative Age Effect gives huge concerns for the young players: (i) Continue growing in and with the sport (could reach high level or not); (ii) dropout definitely the sport or even all physical activity. So, to avoid the negative concerns of this longitudinal process, we believe that a well-constructed long-term talent development model, without gaps, which considers talent development as a range of factors and in a dynamic way is vital, because could include the more capable players but also the late matured peers. The coach, as promoter should help to include the young players in their game level, helping their development, according with their capacities and potential.
Keywords:
ÍNDICE GERAL
Agradecimentos ………..………. IV Resumo ………..……….... V Abstrat ……….……….. VI Índice Geral ………..………...…… VII Índice de Figuras ………..……….…… VIII Índice de Quadros ………..…. IX Lista de Abreviaturas ……….……....….. X Introduction ……….……...… 1 Methods Participants ……….……...… 3 Procedures Data collection ……….… 4 Data analysis ………...… 4 Results ……….………...… 5 Discussion ……….……….… 7 Conclusion ……….……...… 9 Bibliography ……….……...… 11
ÍNDICE DE FIGURAS
Figure 1. Distribution of birthdate by age group from the players that represent the
ÍNDICE DE QUADROS
Table 1. Mean values for weight and height by field position from the age groups that
represent the sample of this study ……….…… 4
Table 2. Distribution of the players by competition and respective quartile of birth
LISTA DE ABREVIATURAS
BACKS ………..……….. Backs field position Cm ………..……….. Centimeters FORW ……… Forwards field position JRWC ……….… Junior Rugby World Cup Kg ……….……… Kilograms
p ……….. Statistical significance
Q1 ………..……… First Quartile (January, February, March) Q2 ………. Second Quartile (April, May, June) Q3 ……….……….. Third quartile (July, August, September) Q4 ……….………….. Forth quartile (October, November, December) RAE ………. Relative Age Effect RWC ……….. Rugby World Cup SPSS ………..……… Statistic Package for the Social Science x² ………. Chi-square
INTRODUCTION
There is a stream of thought that tell us that are primary mechanisms of the quantity and quality of practice that could explain skill or performance attainment. Those primary mechanisms could have a direct influence on the acquisition of expert performance and include all elements that have a direct or indirect influence on the athlete performance (1). Generally, those can be categorized into (i) genetic factors, (ii) training factors and (iii) psychological factors. In addition, the ability to engage in practice is influenced by a number of secondary mechanisms. For instance, secondary factors are (i) socio-cultural factors - cultural importance, instructional resources, familial support; (ii) contextual factors; (iii) sport maturity and (iv) depth of competition. Those secondary mechanisms could determine which particular activities could be selected to be used, and as a result, mediate the amount of time and opportunity available for participation, practice and attainment in sport. Those activities are part of the individual development of children and youths, which can promote or limit opportunities for skill improvement and attainment (2, 3).
Critical incidents that promote a child investing in one sporting activity over others are identified in retrospective studies as positive experiences with a coach, encouragement from an older sibling, early success, and/or simple enjoyment of the activity (4, 5, 6, 7). Some literature references suggests that “the making of” an expert athlete could usually begin in an environment where children are early and regularly exposed to sporting activities (8, 6, 7, 9).
In literature, the relative age effect puts on evidence the differences between individuals of the same age born earlier and lately in the same year. This difference of age between individuals in the same age group is referred to as relative age, and its consequence is known as the Relative Age Effect (from now on referred as RAE). In summary, there are multiple factors contributing to the RAE, and those could be defined as “a mixture of physical, cognitive, emotional, and motivational causes that
work together to produce the effect” (10, p.159). The researchers highlight that in
addition to early maturational factors, the amount of practice experienced may also contribute to RAE presence. They argue that relatively older individuals may have higher levels of skill and proficiency because they accumulated greater amounts of practice experience during their lifespan. Related to the psychological point of view, relative age differences may be a critical factor to establish competency beliefs as a result of continuous interaction with other peer. The relatively younger children are likely to be frustrated by his or her limited ability to compete and may finally drop out of
organized sport. The training time difference among children may also contribute by the fact that relatively older players are more likely to be selected for representative groups or teams. This selection process is not only linked with be in contact with the best available coaches or having competition against better opponents; but it is also important being involved in higher competition levels because that fact could itself be more prestigious and therefore likely to increase motivation.
As some researchers state (11, 12) this early exposure to high-level training establishes an important advantage in terms of skills and game knowledge in comparison with their younger peers. These arguments suggest that RAE have early and persistent effects throughout the education process. On the other hand, some review of sociological and psychological factors influencing dropout rates in youth sport does not even mention the RAE (13, 14, 15). In a related study, Wilson (16) examined school sport representation at a single comprehensive school, identifying significant over-representation across sports. Some studies indicates that RAE is present in various sports as Australian Rules football (17), baseball (18, 19), basketball (20, 21), cricket (22), ice-hockey (23, 18, 24), rugby league (25), soccer (26, 27, 28, 29, 30, 31, 32), swimming (33), tennis (28) and volleyball (34).
To facilitate the examination of the RAE phenomenon, in general, researchers adopted two most known ways to put their sample into groups. One is splitting the calendar year into quarters according to a year calendar (i.e Q1: january, february and march; Q2: april, may and june; Q3: july, august and september; and Q4: october, november and december) (e.g. 35). Other way is established a cut-off date as date of reference, and from that point we define the younger and older members of a revealed cohort. These divisions have as date of reference the beginning of the “cut-off” period defined by the specific sport federation in cause (36).
To our knowledge, taking into account all the “scientific” concepts described above, arises the need to assess the importance of this effect, specifically in Rugby Union. There is some information that tells us that the tendency of RAE may have influences on the acquisition of high levels of performance, but this fact isolated is not conclusive. Therefore, we think that a novel approach to this issue is needed and to operationalize this idea we also should take into account the use of a sample that represents the best of the best. Thus, the initial purpose of the present study was to examine the quartile of birth of high performance rugby players of a selected sample, that include the players that were selected to compete on the final stages at junior level in Junior Rugby World
Cup (from now on referred to by the acronym JRWC) in 2010 and 2011; and at senior level in Rugby World Cup (from now on referred to by the acronym RWC) in the edition of 2007 and 2011. We decide to analyze the JRWC and RWC because those competitions are the edge for players career, being the most important and prestigious competition for Rugby Union players. However, secondary purposes were (a) to evaluate the differences in the quartiles of birth according to the players field position; (b) to evaluate the differences of quartiles according to the classification obtained in the respective competition; (c) to evaluate the differences of quartiles according to the age group and respective edition of the competition.
METHODS Participants
Data from 1506 male junior and senior players (junior = 541 and senior = 965) were collected. All these players were selected to represent their nations in the final stages of JRWC (2010 and 2011) and in RWC (2007 and 2011). In Figure 1, could be observed the overall distribution of the players by quartile according to the age group (in junior cohort is Q1˃Q2˃Q3 ˃Q4 and in senior cohort Q1˃Q3 ˃Q4 ˃Q2).
Figure 1. Distribution of birthdate by age group from the players that represent the sample of this study
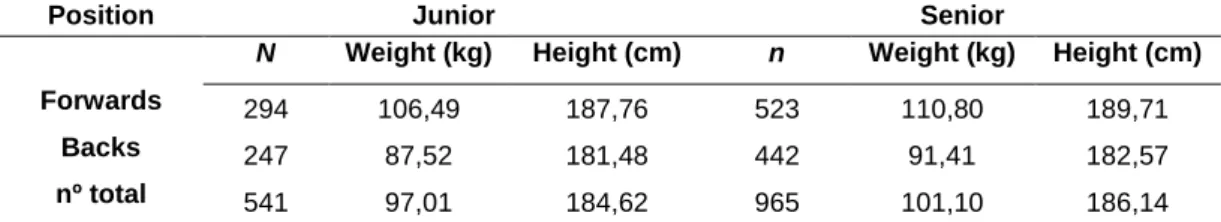
In table 1 we could observe the average of anthropometric characteristics (weight and height) by age group and respective field position (forwards and backs). Related with anthropometric characteristics and field position selection, in general the forwards (FORW) are heavier and taller than the backs (BACKS). In order to field position, the
junior players had also lower anthropometric attributes (height and weight) if compared with the senior colleagues.
Table 1. Mean values for weight and height by field position from the age groups that represent the sample of this study
Position Junior Senior
N Weight (kg) Height (cm) n Weight (kg) Height (cm) Forwards 294 106,49 187,76 523 110,80 189,71
Backs 247 87,52 181,48 442 91,41 182,57 nº total 541 97,01 184,62 965 101,10 186,14
Procedures Data collection
For the present study purpose, the data was obtained from the official internet site of the International Rugby Union (http://www.irb.com). Information about player individual parameters such as birthdate (afterwards put into groups called quartiles: Q1 = january, february, march; Q2 = april, may, june; Q3 = july, august, september; Q4 = october, november, december); anthropometric characteristics (height: centimeters - cm; and weight: kilograms - Kg) and field position (Forwards: FORW - players from number 1 till 8; and Backs: BACKS - from number 9 till 15) were collected. In each of these described parameters we also analyzed the classification obtained by the team in the competition in question (we split into three groups: 1st to 4th place; 5th to 8th place and 9th till the last place - in juniors age group last place means 12th place and in senior age group means 20th place). With this data review we will try to argue about the possible relationship and influence that those factors (player anthropometric measurements, field position selection and classification obtained) could have in the players selection and performance attainment in elite Rugby Union.
Data analysis
We created a data-basis in Microsoft Office Excel 2010, where we inserted all the data collected in International Rugby Board online website and grouped the details by Union. Using SPSS Version 15.0 for Windows (SPSS Inc. Chicago, IL), frequencies and percentages were calculated for each annual-age group having as variables anthropometric values as height and weight, field position and classification obtained. The way that we think more appropriated to analyze the sample collected and chosen by us was testing if exists a significant statistical difference between the expected number of players born per month or per quarter (i.e. three consecutive months, quartile) and the observed number. We use the chi-square of fit test in order to
determinate if the distribution observed by quartiles differs significantly from the theoretical distribution expected (36). Afterwards, frequencies of birthdates in each quarter of year were tabulated according to anthropometric characteristics, age-group, field position and classification obtained. Statistical significance was set at p ≤ .05.
RESULTS
As described above, our main purpose was to evaluate the quartiles of birth of high performance rugby players of a sample that included the players selected to the 2010 and 2011 JRWC, and 2007 and 2011 RWC. As secondary purposes we aimed to analyze the differences in the quartiles of birth according to the: (a) players field position; (b) classification obtained in the respective competition; (c) age group and respective edition of the competition.
Figure 1 show the birthdate of all the players from our sample distributed by quartile, and there we could found a general tendency to those that have an early born in the year of reference (Q1 Junior: 33,3%; Q1 Senior: 27,0%). Specifically, related to junior players the distribution by quartile of birth is Q1 (33,3%) ˃ Q2 (26,6%) ˃ Q3 (22,0%) ˃ Q4 (18,1%) and in seniors age group is Q1 (27,0%) ˃ Q3 (24,9%) ˃ Q4 (24,7%) ˃ Q2 (23,4%). The values obtained in our study show us a general tendency (junior and senior age grade) where those born in the first quartile (Q1= 29,2%) are in more number if compared with those from the others quartiles (Q2= 24,6%; Q3= 23,9%; Q4= 22,2%). We decide to keep those values as reference trying to argue about the connection with other variables in study, as quartile of birth by age group, quartile of birth by field position, and quartile of birth by classification obtained.
Relatively to the field position topic we found that in the junior cohort the values obtained are lower than the expected for “FORW” in Q1 and Q2 of JRWC 2010 (x² = 8,979; p = 0,030) and in Q2 of JRWC 2011 (x² = 0,656; p = 0,883). For “BACKS” field position group we found values lower than expected in Q1 and Q4 of JRWC 2010, and in Q3 of JRWC 2011. Within seniors, we found values lower than expected in “FORW” in Q1 and Q4 of RWC 2007 (x² = 1,361; p = 0,715), and in Q2 and Q3 of RWC 2011 (x² = 0,039; p = 0,998). Related to the “BACKS” position we found lower values in Q2 and Q4 of RWC 2007 and in Q2 and Q3 of RWC 2011.
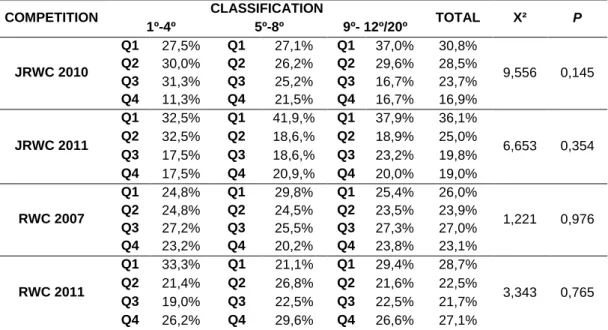
In table 2, we organized the distribution of quartiles of birth according to the classification obtained. For the junior age group, in the first classification group (1st –
4th), we found values lower than the expected in Q1 and Q4 of JRWC 2010 edition (x²=9,556; p=0,145); and in Q1, Q3 and Q4 of JRWC 2011 edition (x²=6,653; p=0,354). For the second classification group (5th – 8th), we found lower values than the expected in Q1 and Q2 of JRWC 2010; and in Q2 and Q3 of JRWC 2011 edition. In the last classification group (9th-12th), was also found lower values than expected in Q3 and Q4 of JRWC 2010 and in Q2 of JRWC 2011 edition. Within senior cohort, as also mentioned in table 2, was found values lower than the expected in the first classification group (1th - 4th) in Q1 and Q4 of RWC 2007 (x²=1,221; p=0,976); and in Q2 and Q3 of the RWC 2011 edition (x²=3,343; p=0,765). For the second classification group (5th - 8th), was found lower values than expected in Q4 of RWC 2007; and in Q1 and Q3 of RWC 2011. Finally, for the last classification group (9th - 20th), there were found lower values than expected in Q1, Q3 and Q4 of RWC 2007; and in Q2 and Q3 of RWC 2011 edition.
Table 2. Distribution of the players by competition and respective quartile of birth according with the
classification obtained
COMPETITION CLASSIFICATION TOTAL X² P
1º-4º 5º-8º 9º- 12º/20º JRWC 2010 Q1 27,5% Q1 27,1% Q1 37,0% 30,8% 9,556 0,145 Q2 30,0% Q2 26,2% Q2 29,6% 28,5% Q3 31,3% Q3 25,2% Q3 16,7% 23,7% Q4 11,3% Q4 21,5% Q4 16,7% 16,9% JRWC 2011 Q1 32,5% Q1 41,9,% Q1 37,9% 36,1% 6,653 0,354 Q2 32,5% Q2 18,6,% Q2 18,9% 25,0% Q3 17,5% Q3 18,6,% Q3 23,2% 19,8% Q4 17,5% Q4 20,9,% Q4 20,0% 19,0% RWC 2007 Q1 24,8% Q1 29,8% Q1 25,4% 26,0% 1,221 0,976 Q2 24,8% Q2 24,5% Q2 23,5% 23,9% Q3 27,2% Q3 25,5% Q3 27,3% 27,0% Q4 23,2% Q4 20,2% Q4 23,8% 23,1% RWC 2011 Q1 33,3% Q1 21,1% Q1 29,4% 28,7% 3,343 0,765 Q2 21,4% Q2 26,8% Q2 21,6% 22,5% Q3 19,0% Q3 22,5% Q3 22,5% 21,7% Q4 26,2% Q4 29,6% Q4 26,6% 27,1%
Analyzing each competition separately, was found in junior cohort lower values than expected in Q1 and Q4 of JRWC 2010 (x²=4,820; p= 0,185). In JRWC 2011 competition there was found the reverse trend, where were observed lower values than expected in Q2 and Q3 (x²=7,330; p=0,062). Relatively to the senior cohort, in RWC 2007 competition, was found in Q1 and Q4 values lower than expected (x²=2,694; p= 0,441); and in RWC 2011 was found values lower than expected in Q2 and Q3 (x²=7,330; p=0,062).
DISCUSSION
The core of the current study was to examine if RAE is present in Rugby Union, and could influence sports achievement and development. To substantiate this, we studied if the effect occurs at elite level in Rugby Union, analyzing birthdates (grouped by quartiles of birth) of the players who had participated in junior (JRWC 2010 and JRWC 2011) and also in senior competitions (RWC 2007 and RWC 2011). To support this theory, we accounted for other variables that we thought may help explain these effect tendencies, and defined as secondary purposes to evaluate the differences in the quartiles of birth according to (a) players field position; (b) final classification obtained; (c) age group respective edition of the competition. We thought that those secondary hypotheses could become a valuable tool and most of all a novel approach to the study of this phenomenon. After performing the data processing and analyzing them, we found that regardless of the variable that relate to the date of birth (field position, classification obtained, age group and respective edition of competition), there were often a tendency of RAE. This tendency of RAE that we found in our research we thought that could be reliable in the development of young rugby players
This values let us thinking in the possibility of RAE interfere directly with the young players and possibly could hinder their sports career. Some justifications are used to prove that. Late development and less physicality could be the main problems that youngster had to lead to achieve high performance standards, but normally this could be reflex of been born late in the year or related to the cut-off date. In the review of Musch and Grondin (10), they suggest that maturation status was a primary cause of RAE in youth sport, explaining that relatively older juniors would be more likely to possess desirable physical characteristics, compared to their relatively younger peers. These facts let us thinking in the problematic that led our younger players to be excluded of getting opportunities in higher performances teams. With a few rare exceptions (33, 37, 38, 39, 40), most studies have reported a significant RAE, especially in sports where height, weight, and strength are considered assets (10). For Van Rossum (41), the presence or absence of a RAE is a function of motor skills.
Rugby Union is a sport where size does matter. Players who are bigger, stronger and faster have an advantage over less powerful and smaller players. These differences in size are exacerbated at the junior levels where players reach puberty at different stages (42). In Rugby Union, there is a selection position, where anthropometric measurements could have influence (e.g. FORW are those who fight for ball in phases of conquest, playing in a closet space, with physical and strength demands, and the
BACKS should be the ones that are quicker and more ability to play in an open side game, having quicker technical/ tactical decisions in order to score tries. If we reduce this selection and evaluation process only to anthropometric variables (as height and weight) and we do not regulate them in the training process, we are not taking account that the smallest players could progress and develop in the same way as the “talent” ones in their longitudinal sports development, where the physiological demands of the game are increasing with age and respective game level (e.g. In New Zealand Rugby Football Union made age group in order to weight).
In our research we could not found a direct and valid connection between anthropometric characteristics and eligibility to higher performance teams because for instance, we did not analyze technical/ tactical, and physiological characteristics to empathize that possible selection of some athletes over others by their national Union. However, in this study, we observed that the FORW obtained the higher values both in height and weight in each age grade (junior or senior) and also the junior FORW are heavier and taller than the senior BACKS. Those facts were previously expected and are directly related with the etiology of game, were the FORW are players whose game demands predominantly require physical collisions, tackles and ruck domination (43, 44, 45). Generally, these results found by our study make us believe how much the RAE is at the same time very common and very important in the study of how reach the highest performance in long term player development. To avoid the negative concerns of this longitudinal process, we thought that a well-constructed long-term talent development model which considers talent development as a range of factors and in a dynamic way is vital, because could include the more capable players but also the late matured peers. Such a model would rather consider the differences in size during puberty and cater as much for the slow developers as it does for the early developers (e.g. 46).
There are different strategies and policies in Long Term Player Development in Rugby Union (e.g. 47, 48, 49, 50, 51, 52, 53, 54, 55, 56, 57) but the major part of those “longitudinal guidelines” in rugby are similar in the objectives and aims, even if differentiate in their shape. The existing of those documents makes a lot of sense because those dynamic models consider the maturity status and level of development of the young players, with the overall result of being more inclusive for players of all sizes rather than exclusive for smaller players (42). Thus, these types of long term programs provide children safe and enjoyable activities adequate to their age, physical development, size and body shape (58, 59, 60, 61). However, the study of a range of
factors, which we thought interference in longitudinal development combined with RAE gives huge concerns for the young players: (i) Continue growing in and with the sport (could reach high level or not); (ii) dropout definitely the sport or even all physical activity.
In short, the adoption of long term player development programs by the different rugby unions must focus on player assessment and taking into account the interaction of some very important factors (e.g. technical, tactical, physiologic, physical and psychological). Those factors will be the key points in the achievement of performance behind maturation. Remember that in this long term process, there are stages where we assist to an increase of complexity, and where we cannot jump stages, at risk of not developing young individuals according to their needs and potential as players. Perhaps if these gaps happen we risk seeing our young change their selected sport or even quit sport activity in general.
CONCLUSION
This research suggests that risks of RAE are present in Rugby Union, with the relatively younger members of annual age-group cohorts persistently disadvantaged if compared with the older peers. The findings from this investigation suggest that the size advantages and an early birthday in the selection year could increase youth’s chance of being selected for an elite rugby union national squad. Some factors as talent identification, type of competition and selection, certainly seems to create RAE across the developmental stages of the youth development. Sport organizations should have big concerns with this matter. Those factors will be the biggest challenge that coaches, parents, players, researchers and sport governing bodies, have to deal with. In this journey, to get the higher performance players and teams, the respective unions may have some problems where many players drop out from the sport. In the early ages of the player development, the coach focus should be the player and their necessities to play the game with enjoyable and safety. We believe that this point should be the main concern rather than winning. The main objective for the coach should be concede to the players tools that help they in their game level, teaching skills and tactics that are adequate to the real requisites of their game. A well-constructed long-term talent development model emphasis the importance of considers the talent development in a multi-factorial and dynamic way.
BIBLIOGRAPHY
1. Baker, J. & Horton, S. (2004). A review of primary and secondary influences on sport expertise, High Ability Studies, 15, 211–228.
2. Baker, J., Côté, J. & Abernethy, B. (2003a). Sport specific training, deliberate practice and the development of
expertise in team ball sports, Journal of Applied Sport Psychology, 15, 12–25.
3. Côté, J., Baker, J. & Abernethy, B. (2003). From play to practice: a developmental framework for the
acquisition of expertise in team sports, in: J. Starkes & K.A. Ericsson (Eds.) Expert performance in sports:
advances in research on sport expertise (Champaign, IL, Human Kinetics), 89–110.
4. Carlson, R. C. (1988). The socialization of elite tennis players in Sweden: An analysis of the players
backgrounds and development. Sociology of Sport Journal, 5, 241 – 256. *
5. Côté, J. (1999). The influence of the family in the development of talent in sports. The Sports Psychologist, 13, 395 – 417. *
6. Kalinowski, A. G. (1985). The development of Olympic swimmers, in: B. S. Bloom (Ed.) Developing talent in
young people (New York, Ballantine), 139–192. *
7. Monsaas, J. A. (1985). Learning to be a world-class tennis player. In B. S. Bloom (Ed.), Developing talent in young people. New York: Ballantine, 221 - 269. *
8. Baker, J., Côté, J. & Abernethy, B. (2003b). Learning from the experts: practice activities of expert
decision-makers in sport, Research Quarterly for Exercise and Sport, 74, 342–347.
9. Soberlak, P., & Côté , J. (2003). The developmental activities of elite ice hockey players. Journal of Applied Sport Psychology, 15, 41 – 49. *
10. Musch, J. & Grondin, S. (2001). Unequal competition as an impediment to personal development: a review of
the relative age effect in sport, Developmental Review, 21, 147–167.
11. Ward, P., & Williams, A. M. (2003). Perceptual and cognitive skill development in soccer: The
multidimensional nature of expert performance. Journal of Sport Exercise Psychology: 25: 93-111. *
12. Williams, A. M. (2000). Perceptual skill in soccer: Implications for talent identification and development, Journal of Sports Science: 18: 737-740. *
13. Gould, D. & Pelichkoff,L. (1988). Participation motivation and attrition in young athletes. In: Smoll F.L. Magill R.A., Ash M.J. editors. Children in sport. 3rd ed. Campaign (IL); Human Kinetics, 161 – 78. *
14. Skard, O., & Vaglum, P. (1989). The influence of psychosocial and sport factors on dropout from boys’ soccer:
A prospective study. Scandinavian Journal of Sports Sciences, 11, 65–72. *
15. Weiss, M. R. & Chaumeton, N. (1992). Motivational orientations in sport, in: T. Horn (Ed.) Advances in Sport Psychology (Champaign, IL, Human Kinetics), 61–100. *
16. Wilson, G. (1999). The birthdate effect in school sports teams, European Journal of Physical Education, 4, 139-145. *
17. Abernethy, B. & Farrow, D. (2005). Contextual factors influencing the development of expertise in Australian
athletes, Proceedings of the 11th World Congress of Sport Psychology, Sydney, Australia. *
18. Barnsley, R. H. & Thompson, A. H. (1988). Birthdate and success in minor hockey: the key to the NHL, Canadian Journal of Behavioral Science, 20, 167–176.
19. Thompson, A., Barnsley, R. & Stebelsky, G. (1991). ‘Born to play ball’: the relative age effect and major
league baseball, Sociology of Sport Journal, 8, 146–151.
20. Hoare, D. (2000). Birthdate and basketball success: Is there a relative age effect? Paper presented at the 2000 Pre- Olympic Congress, Brisbane, Australia.
21. Delorme, N., & Raspaud, M. (2009). The relative age effect in young French basketball players: A study on
the whole population. Scandinavian Journal of Medicine and Science in Sports, 19, 235–242.
22. Edwards, S. (1994). Born too late to win? Nature. 370. 186. *
23. Grondin, S., Deschaies, P. & Nault, L. P. (1984). Trimestres de naissance et rendement scolaire, Apprentissage et Socialisation, 16, 169–174. *
24. Wattie, N., Cobley, S., Macpherson, A., Howard, A., Montelpare, W. J., & Baker, J. (2007). Injuries in
25. Till, K., Cobley, S., Wattie, N., O’Hara, J., Cooke, C., & Chapman, C. (2010a). The prevalence, influential
factors and mechanisms of relative age effects in UK rugby league. Scandinavian Journal of Science and
Medicine in Sport, 20, 320–329. *
26. Barnsley, R. H., Thompson, A. H., & Legault, P. (1992). Family planning: football style. The RAE in football. International Review for the Sociology of Sport, 27, 77–88. *
27. Verhulst, J. (1992). Seasonal birth distribution of West European soccer players: a possible explanation, Medical Hypotheses, 38, 346–348. *
28. Dudink, A. (1994). Birthdate and sporting success, Nature, 368, 592. *
29. Helsen, W. F., Starkes, J. L. & van Winckel, J. (1998). The influence of relative age on success and dropout in
male soccer players, American Journal of Human Biology, 10, 791–798.
30. Helsen, W. F., Hodges, N. J., Van Winckel, J., & Starkes, J. (2000). The roles of talent, physical precocity and
practice in the development of soccer expertise. Journal of Sports Sciences, 18, 727 – 736. *
31. Helsen, W. F., van Winckel, J., & Williams, A. M. (2005). The relative age effect in youth soccer across
Europe. Journal of Sports Sciences, 23, 629–636.
32. Jimenez, I. P., & Pain, M. T. G. (2008). Relative age effect in Spanish association football: Its extent and
implications for wasted potential. Journal of Sports Sciences, 26, 995-1003.
33. Baxter-Jones, A. (1995). Growth and development of young athletes. Should competition levels be age
related? Sports Medicine, 20, 59–64.
34. Barnsley, R. H., Thompson, A. H. & Barnsley, P. E. (1985). Hockey success and birthdate: the RAE,
Canadian Association for Health, Physical Education, & Recreation, 51, 23–28.
35. Edgar, S. & O'Donoghue, P. (2005). 'Season of birth distribution of elite tennis players'. Journal of Sports Sciences, 23:10, 1013 — 1020.
36. Cobley, S., Abraham, C., & Baker, J. (2008). Relative age effects on physical education attainment and school
sport representation. Physical Education and Sport Pedagogy, 13, 267–276.
37. Côté, J., MacDonald, D.J., Baker, J. & Abernethy, B. (2006). When “where” is more important than “when”:
birthplace and birthdate effects on the achievement of sporting expertise. International Journal of Sport
Psychology, 24, 1065–1073.
38. Daniel, T. E., & Janssen, C. T. L. (1987). More on the relative age effect. Canadian Association.
39. Delorme, N., Boiché, J., & Raspaud, M. (2009). The relative age effect in elite sport: The French case. Research Quarterly for Exercise and Sport, 80, 336–344.
40. Stanaway, K. B., Hines, T. M. (1995). Lack of season of birth effect among American athletes. Perception Motor Skills 1995: 81: 952-954. *
41. Van Rossum, J. H. A. (2006). Relative age effect revisited: Findings from the dance domain. Perceptual and Motor Skills, 102, 302–308. *
42. Lambert, M. & Durandt, J. (2010). Long-term player development in rugby – how are we doing in South
Africa? South Africa Journal Sports Medicine, volume 22, No. 3, 67-68.
43. Villepreux, P. (1996). Formation au rugby de movement. Edit. Stadium. Madrid. *
44. Wilson, B. (2006). Rugby Fitness Training: A twelve-Mouth Conditioning Program, The Crowood Press Ltd, Wiltshire, UK.
45. Bompa, T. & Claro, F. (2009). Periodization in Rugby. Meyer &Meyer Sport, UK.
46. Irish Rugby Football Union (2006). Long Term Player Development: From 6 to 6 Nations. Irish Rugby Football Union Coach Development Department, Dublin. Available from URL: www.irishrugby.ie. Consulted on 13 September 2012.
47. Australian Rugby Union (2002-2006). LTPD Pathway Blueprint update. 131006. Modified and adapted from Movement Dynamics, 2002-2006.
48. Australia Rugby Union (2004). Player Development Pathways and Coach Education implications – Vertical
Model. Modified and adapted from Movement Dynamics. LTPD Pathway Coaching Course Implications
270906.
49. New Zealand Rugby Football Union (2009a). Rugby Smart Development Model. New Zealand Rugby Football
50. New Zealand Rugby Football Union (2009b). Small Blacks Development Model: Pocket Guide - Wallet Cards:
Under 6 to Under 12. Avaiable from URL: www.smallblacks.com. Consulted on 14 September 2012.
51. Rugby Football Union (2007). Coaches Guide: CB School of Rugby. Published in Rugby Football Development Limited.
52. Rugby Football Union (2008). LTAD Booklet. Rugby Football Union. Twickenham, UK.
53. Rugby Football Union Canada (2007). Long Term Rugby Development (LTRD) strategy (2007- 20015). RC, Toronto.
54. Scottish Rugby Union (2006). Creating a Safe Environment for Children in Rugby: Scottish Rugby Child Protection Guidelines. Sport Scotland, Edinburgh.
55. Scottish Rugby Union (2007a). Coach Education Programme: Practice card for Rugby. Scottish Rugby Union. Edinburgh.
56. Scottish Rugby Union (2007b). New Image Rugby for 5-14: A teachers Resource Pack. Scottish. Rugby Union. Edinburgh.
57. Wales Rugby Union (2008). WRU Player Pathway Pyramid Overview. WRU, Cardiff.
58. Australian Rugby Union (2012). Australian Rugby Union safety and management booklet: Smart Rugby. Sydney. Available from URL: http://www.rugby.com.au/tryrugby/Coaching/Courses/SmartRugby.aspx . Consulted on 20 October 2012.
59. International Rugby Board (2012b). International Rugby Board safety and management booklet: Rugby
Ready. Dublin. Available from URL: http://www.irbrugbyready.com/index.php?&language=en . Consulted on
20 October 2012.
60. New Zealand Rugby Football Union (2012). New Zealand Rugby Football Union safety and management
booklet: Rugby Smart. Wellington. Available from URL: http://www.nzrugby.co.nz/the_game/safety
/rugbysmart . Consulted on 20 October 2012.
61. South Africa Rugby Football Union (2012). South Africa Rugby Football Union safety and management
booklet: Boksmart. Newlands. Available from URL: http://boksmart.sargby.co.za/ . Consulted on 20 October
2012.