FACULDADE DE ENGENHARIA
UNIVERSIDADE DO PORTO
Portugal
ECONOMIC-EFFICIENT DESIGN OF
RESIDENTIAL NET ZERO ENERGY
BUILDINGS WITH RESPECT TO LOCAL
CONTEXT
Maria Kapsalaki
Porto
3
Ph.D thesis in Sustainable Energy Systems ◊◊◊
Tese de Doutoramento em Sistemas Sustentáveis de Energia
Faculdade de Engenharia da Universidade do Porto Rua Dr. Roberto Frias
4200-465 Porto, Portugal Maria Kapsalaki, 2012
5 ACKNOWLEDGEMENTS
I would like to express my gratitude to:
Professor Vitor Leal who oriented my thesis.
Professor Mat Santamouris who co-oriented my thesis.
Professor Leon Glicksman who co-oriented me while I was a visiting student at MIT.
My mother and my friends who were always there for me.
7 ABSTRACT
The identification of the economical-optimal design solutions for Net Zero Energy Buildings (NZEBs) is a complex engineering problem with societal relevance. This work developed a methodology for this purpose which was then implemented in a software tool intended to be used in order to identify the combination of design variables that have optimal lowest life cycle costs, or a good compromise between initial cost and life-cycle cost for different climate contexts and electricity price scenarios. The following fourteen major design variables were identified that grossly determine the energy demand and supply of the building: 1) thermal insulation level; 2) thermal inertia level; 3) air leakage level; 4) window type; 5) shading type; 6) glazed area; 7) orientation; 8)type of ventilation; 9) heating system; 10) type of cooling system; 11) type of water heating system; 12) efficiency of lighting; 13) efficiency of appliances and 14) type of microgeneration system. Each design variable considered was discretised in a number of alternatives reasonably representing the range of possible options.
Calculation methodologies were implemented for the characterization of the energy demand, considering space heating & cooling, water heating, lighting, cooking, refrigeration and appliances as well as the amount of onsite microgeneration needed to offset the yearly demand. The most challenging part of the methodology was the characterization of the yearly heating and cooling needs, which was achieved through a quasi-steady state model based on the EN ISO 13790 and the Portuguese thermal building code (RCCTE).
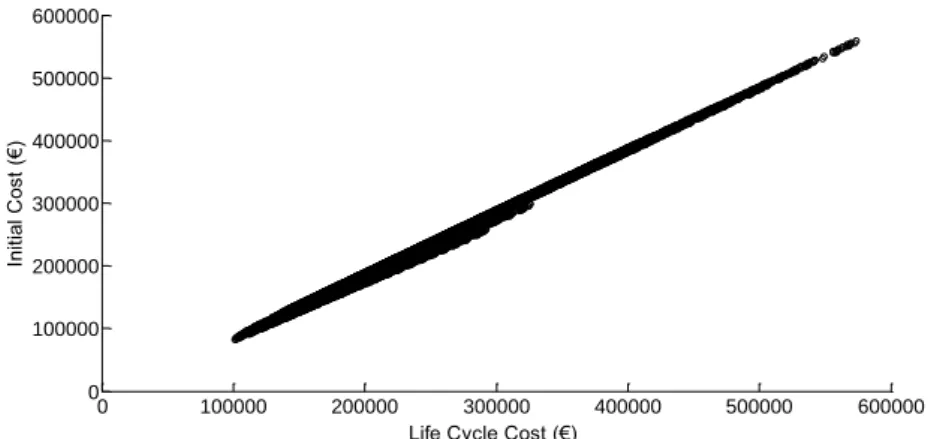
An algorithm was implemented as a computational tool developed in Matlab, which goes through all possible combinations of envelope characteristics, building services equipment and renewable on-site production systems and for each computes the following results: 1) useful heating needs; 2) useful cooling needs; 3) final heating needs; 4) final cooling needs; 5) total final energy; 6) area of photovoltaic (PV) panels or number of wind turbines; 7) annual electricity and/or gas bill; 8) life cycle cost and 9) initial cost of the elements that influence the energy performance.
Two case studies, a detached house and a high rise building for three climates each (Stockholm, Lisbon and Iraklion), were analysed with the tool developed. This allowed to gain insights on the following: 1) economic space of NZEB solutions; 2) influence of the climatic context; 3) influence of fuel and electricity buy and sell prices; 4) influence of the level of compensation; 5) hierarchy of influence of design variables; 6) influence of limitations on the area available for PV installation; 7) impacts of considering wind turbines as a reliable microgeneration design option; 8) feasibility of high-rise NZEBs and 9) sensitivity to the costs of PV.
As main achievement it should be highlighted that a methodology for assisting in the choice of economically- efficient NZEB solutions, right from the early design stage is now available. The results have shown that its use in practice may be of great relevance as the results of the case studies have shown that the differences between an economically efficient and economically inefficient NZEB can be over three times both in terms of initial cost as in terms of life cycle cost.
9 RESUMO
A identificação das soluções eficientes ou mesmo ótimas no projecto de “NZEB” (Net Zero Energy Buildings na sua forma em inglês) é um problema de engenharia complexo com relevância para a sociedade. Neste trabalho foi desenvolvido um método , o qual foi depois implementado numa ferramenta de software, com o intuito de ser usado para identificar as combinações das variáveis de projecto que têm custos de ciclo de vida ou custo inicial mais baixos, ou ainda um bom compromisso entre o custo inicial e o custo de ciclo de vida para diferentes contextos climáticos e cenários de preços de energia. Catorze variáveis foram identificadas como as mais determinantes na energia no edifício: 1) nível de isolamento térmico; 2) nível de inércia térmica; 3) nível de infiltração de ar; 4) tipo de janela; 5) tipo de sombreamento; 6) área de envolvente envidraçada; 7) orientação; 8) tipo de ventilação; 9) tipo de sistema de aquecimento; 10) tipo de sistema de arrefecimento; 11) tipo de sistema de aquecimento de água; 12) eficiência do sistema de iluminação; 13) eficiência de equipamentos e 14) tipo de sistema de microgeração. Cada variável de projeto considerada foi discretizada de forma a criar uma série de alternativas representando o leque de opções possíveis.
Foram implementadas metodologias de cálculo para a caracterização da procura de energia, considerando aquecimento e arrefecimento, aquecimento de água, iluminação, cozinha, refrigeração e equipamentos, bem como a quantidade de microgeração local necessária para compensar a procura anual. A parte mais complexa da metodologia foi a caracterização das necessidades anuais de aquecimento e arrefecimento, que foi efetuada através de um modelo quase-estacionário, baseado na EN ISO 13790 e no Regulamento das Características de Comportamento Térmico dos Edifícios (RCCTE) de Portugal.
Foi desenvolvido e implementado em Matlab um algoritmo / ferramenta computacional que contabiliza todas as possíveis combinações de características das envolventes dos edifícios, equipamentos e sistemas de produção local a partir de renováveis. Para cada “solução” a ferramenta determina os seguintes resultados: 1) necessidades de energia útil para aquecimento; 2) necessidades de energia útil para arrefecimento; 3) necessidades de energia final para aquecimento; 4) necessidades de energia final para arrefecimento; 5) energia final anual; 6) área de FV (fotovoltaico) ou o número de turbinas eólicas necessárias para a compensação; 7) custos e proveitos anuais de eletricidade e/ou de gás; 8) custo do ciclo de vida e 9) custo inicial dos elementos relacionados com o desempenho energético.
Dois estudos de caso, uma moradia unifamiliar e um edifício multifamiliar foram analisados com a ferramenta desenvolvida, para três tipos de clima (Estocolmo, Lisboa e Iraklion). Isto permitiu, além de exemplificar o uso da metodologia, obter indicações sobre: 1) o espaço económico (custo de ciclo de vida vs custo inicial) de soluções para NZEB; 2) a influência do contexto climático; 3) a influência de preços (compra e venda) de combustíveis e eletricidade; 4) a influência do nível de compensação; 5) a hierarquia da influência das variáveis de projecto; 6) a influência das limitações da área disponível para instalação de FV; 7) os impactos de considerar as turbinas eólica como uma opção fiável para microgeração; 8) a viabilidade de edifícios multifamiliares em altura como edifícios NZEB e 9) a sensibilidade aos custos dos painéis FV.
10
Como principal contribuição prática deve-se destacar a disponibilização de uma metodologia para auxiliar na escolha de soluções NZEB economicamente eficientes, para aplicação na fase inicial de projeto. Os resultados dos casos de estudo demonstraram que a sua utilização na prática pode ser de grande relevância, dado que as diferenças entre um NZEB economicamente eficiente e um economicamente ineficiente podem ser de mais do triplo, tanto em termos de custo inicial quanto em termos de custo de ciclo de vida.
11
Contents
1 Introduction ... 19
1.1 Context ... 19
1.2 Design of NZEBs as an engineering problem ... 21
1.3 General objectives and structure of this work ... 22
1.4 Delimitations of scope ... 24
2 Review of net zero energy buildings design methodologies and practices ... 25
2.1 Progress in defining the concept of NZEB ... 25
2.2 Progress on NZEB demonstration buildings ... 29
2.2.1 Residential NZEBS ... 29
2.2.2 Non residential/commercial NZEBs ... 33
2.3 Progress on design strategies and procedures ... 37
3 Methodology for detailed energy demand and supply characterization & economic evaluation . 45 3.1 Energy uses in residential buildings ... 46
3.2 Useful heating needs ... 47
3.2.1 Heat loss through the envelope ... 48
3.2.2 Heat loss resulting from the air renewal ... 49
3.2.3 Thermal heat gains ... 50
3.2.4 Gain utilization factor for heating ... 51
3.3 Peak heating needs ... 52
3.4 Useful cooling needs ... 53
3.4.1 Heat sources ... 53
3.4.2 Loss utilization factor ... 54
3.5 Peak cooling load ... 55
3.6 Useful energy needs for domestic hot water (DHW) ... 56
3.7 Total needs of final energy ... 57
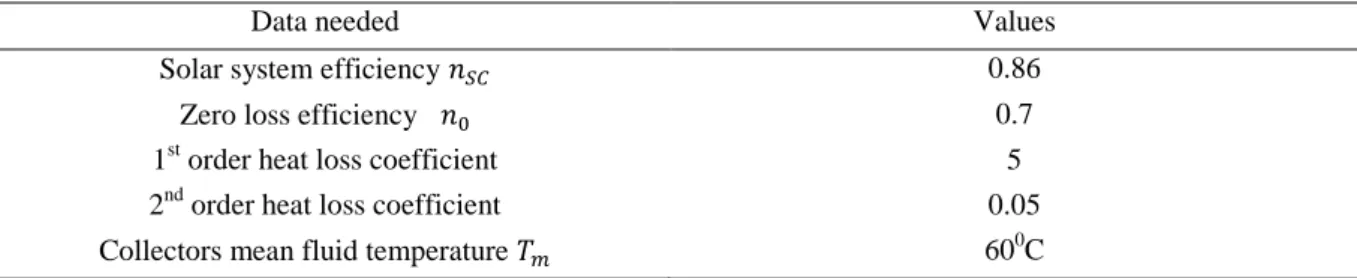
3.8 Thermal solar collection for DHW ... 58
3.9 Microgeneration from PV ... 59
3.10 Microgeneration from wind ... 60
3.11 Economic indicators ... 62
4 Analysis and sorting of design alternatives (application tool) ... 63
4.1 Building design variables and design alternatives ... 63
4.2 Discretization of the design variables ... 64
12
4.2.2 Leakage level and ventilation type ... 65
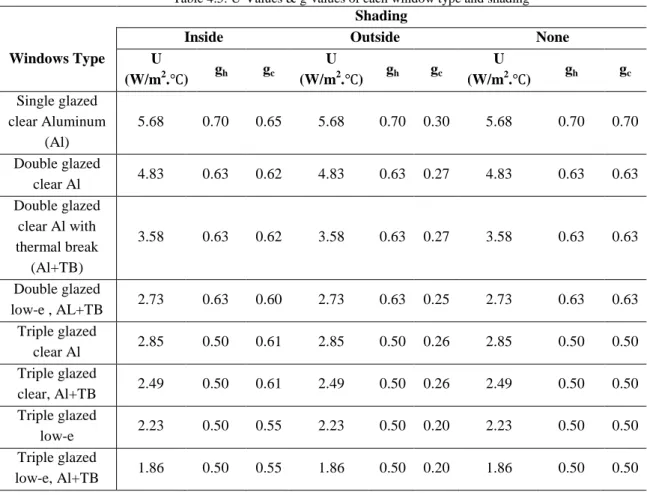
4.2.3 Window and shading types ... 66
4.2.4 Glazed area ... 67
4.2.5 Orientation ... 67
4.2.6 Thermal mass ... 68
4.2.7 Heating and cooling system ... 68
4.2.8 Occupants ... 69
4.2.9 Domestic hot water system ... 69
4.2.10 Lighting and appliances ... 70
4.2.11 Microgeneration system ... 71
4.2.12 Climate ... 71
4.2.13 Summary of the Design Variables and its Discretization ... 72
4.3 Calculation and optimization software ... 72
4.3.1 Structure ... 72
4.3.2 Mandatory inputs ... 76
4.3.3 Optional inputs ... 78
4.3.4 Outputs ... 81
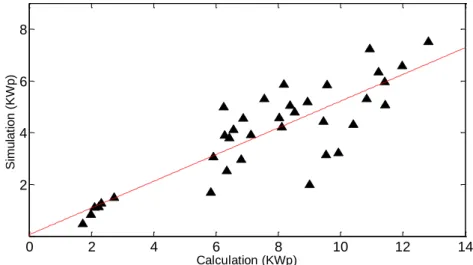
4.4 Validation of calculation algorithms for heating and cooling ... 81
5 Case study 1: low rise building ... 87
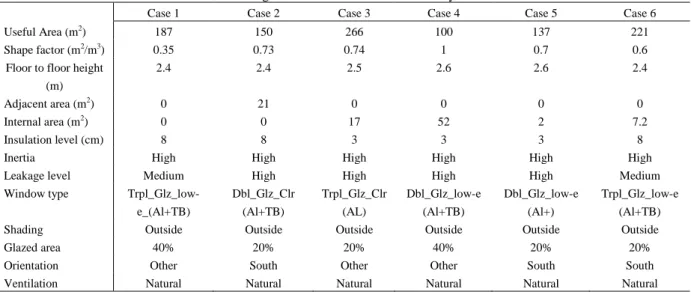
5.1 Case study description ... 87
5.2 Analysis of solutions in the central scenario (SP=BP) ... 91
5.3 Analysis of solutions in a scenario with SP=230%BP (AS1) ... 94
5.4 Analysis of solutions in a scenario with SP=50%BP (AS2) ... 97
5.5 Sensitivity of the optimal building design to the price scenarios ... 100
5.6 Sensitivity analysis to the compensation level ... 104
5.6.1 Impact of Compensation Level on the Economic Indicators ... 105
5.6.2 Impact of compensation level on the design choices ... 109
5.7 Sensitivity analysis to the influence of design variables ... 112
5.8 Sensitivity analysis to limits of roof area available for installing PV ... 116
5.9 Impact of including Small Wind Turbines as an electricity generation option ... 120
5.9.1 Analysis of solutions in a scenario with SP=BP ... 120
5.9.2 Analysis of solutions in a scenario with SP=230%BP ... 122
5.9.3 Analysis of solutions in a scenario with SP=50%BP ... 123
5.9.4 Sensitivity analysis to the influence of design variables ... 125
13
6.1 Case study description ... 131
6.2 Impact of Building height considering solar thermal ... 132
6.3 Sensitivity to the cost of PV ... 135
7 Conclusions ... 139
7.1 Main findings ... 139
7.2 Implications for real practice ... 143
7.3 Future research opportunities ... 144
15 LIST OF SYMBOLS & ABBREVIATIONS
List of Abbreviations
AS1 Alternative scenario 1
AS2 Alternative scenario 2
BP Price of electricity bought from the grid
CS Central scenario
Dbl_Glz_Clr (Al) Double glazed clear window with aluminum frame
Dbl_Glz_Clr (Al+TB) Double glazed clear window with aluminum frame and thermal break Dbl_Glz_low-e (Al+TB) Double glazed low-e window with aluminum frame and thermal break
DHW Domestic hot water
HP Heat pump
HR Heat recovery
IC Initial cost
LCC Life cycle cost
LIC Lowest initial cost
LLCC Lowest life cycle cost
MV Mechanical ventilation
MVHR Mechanical ventilation with heat recovery
NZEB Net zero energy building
PV Photovoltaic
RCHP Reversible cycle heat pump
RCHP class A Reversible cycle heat pump class A
SC Solar collector
Sngl_Glz_Clr (Al) Single glazed clear window with aluminum frame
SP Price of electricity sold to the grid
Trpl_Glz_Clr (Al) Triple glazed clear window with aluminum frame
Trpl_Glz_Clr (Al+TB) Triple glazed clear window with aluminum frame and thermal break Trpl_Glz_low-e (Al) Triple glazed low-e window with aluminum frame Trpl_Glz_low-e (Al+TB) Triple glazed low-e window with aluminum frame and thermal break
TFE Total final energy
WT Wind turbine
List of Symbols
Thermal inertia index (-)
ac Absorption coefficient for solar radiation (-)
Terrain roughness coefficient (-) 1st order heat loss coefficient (W/0C) 2nd order heat loss coefficient (W/0C2)
16
Optimum inclination-slope of a photovoltaic module (º)
Numerical parameter that depends on the building inertia (-) Numerical parameter that depends on the building inertia (-)
δ Declination (º)
Temperature difference between the indoor design temperature and the dry bulb temperature corresponding to 99.6% annual cumulative frequency of occurrence in the heating season (ºC) Temperature difference between the dry bulb temperature corresponding to 99.6% annual cumulative frequency of occurrence (cooling season) and the inside design temperature (0C) Temperature difference between hot water furnished and the water entering the
system to be heated (0C) Default surcharge of U- Value considering the effect of thermal bridges (W/m2.0C)
Air density (kg/m3)
Albedo (-)
Coefficient of thermal loss reduction (-)
Latitude (º)
Sunset hour angle (º)
Sunset hour angle for a tilted surface (º)
Useful-heated area of a buildings´ (m2)
Wall area in contact with adjacent buildings (m2)
Collective effective area glazed elements (m2)
External glazed area (m2)
Wall area in contact with non-heated spaces (m2)
Roof area (m2)
External wall area (m2)
Window area of element i for each k orientation (-)
Photovoltaic panel area (m2)
Thermal solar collectors area (m2)
Annual energy collected by the thermal solar collector (kWh)
Percent turbulence coefficient (%)
Benefits (positive cash flows) in year j for a system being evaluated (€) Cost in year j for a system being evaluated (€) Specific heat of air (J/kg.0C)
Specific heat of the water (J/kg.K)
Initial cost for a system being evaluated (€)
Cooling degree days per year (-)
Final energy needs for space cooling (kWh/year)
17
Discount rate (%)
Diffuse horizontal radiation (Wh/m2) Global horizontal radiation (Wh/m2)
Final energy needs for DHW (kWh/year)
Useful energy needs for DHW (kWh/m2.year)
Daily energy produced by the photovoltaic module (Wh)
Solar irradiation (Wh/m2.day)
Ratio of the overall projected area of the glazed element to the projected frame area (-) Obstruction factor or shading reduction factor (-) Correction factor representing the reduction of the solar energy caused by variations on the glass properties with the angle of incidence of the direct solar radiation (-)
Solar factor of the glazing (g-value) (-)
Solar factor of the window (average of 30% of the g-value of the glazing plus 70% of the g-value of the window considering the blinds closed (-)
Height at which the wind velocity is being computed (m)
Height at which the wind velocity is being computed (m) Actual sunset sunrise hour angle (º)
Heating degree days per year (-)
Annual useful energy need for space heating (kWh/m2.year)
Final energy needs for heating (kWh/year)
Needs for domestic hot water (lt/day.person)
Peak design heating load (kW)
Peak design cooling load (kW)
Life cycle cost (€)
Duration of the heating season (months)
Final energy needs for mechanical ventilation (kWh/year)
Gain utilization factor for cooling (-) Gain utilization factor for heating (-) Number of hours per year in which the velocity has approximately the value v (-) Zero loss efficiency (-)
Efficiency of the cooling system (-)
Efficiency of the DHW system (-)
Efficiency of the heat recovery system (-)
Efficiency of the heating system (-)
Efficiency of the solar system (-)
Photovoltaic panel efficiency (-)
18
Power consumption of the mechanical ventilation system (W)
PB Payback Period (years)
Average thermal internal gains (W/m2)
Heat loss through the walls in contact with non-heated areas and/or adjacent
buildings (kWh/year)
Heat loss resulting from the air renewal (heating season) (kWh/year) Heat loss through the envelope due to conduction (heating season) (kWh/year)
Total heat gain due to lighting, equipment and occupants, plus the solar gains through the glazed elements (heating season) (kWh/year)
Heat loss through the glazed areas (kWh/year)
Internal and solar heat gains (kWh/year)
Internal heat gains caused by occupants, equipment and lighting (kWh)
Heat gains from lighting, equipment & occupants (kWh/year)
Solar gains of the opaque surfaces( kWh)
Heat loss through the roof (kWh/year)
Solar gains of the transparent surfaces-glazed areas (kWh)
Solar gain through glazed areas (kWh/year)
Heat loss through the walls (kWh/year)
Ratio of the average daily beam radiation on a tilted surface to that on a horizontal surface(-) Integrated solar radiation (cooling season) for each k orientation ( kWh/m2)
Rate of mechanical ventilation and infiltration (ach-1)
Average solar energy impinging on a vertical surface facing the south during the
heating season (kWh/m2 .month) Maximum solar insolation (W/m2) Average ambient air temperature ( 0C)
Indoor air temperature ( 0C)
Thermal collectors mean fluid temperature ( 0C)
Average outdoor temperature during the cooling season (0C)
Total annual power output of wind turbine (kWh)
Thermal transmittance (U- Value) of the wall area (W/m2.0C)
U- value of the glazed area (W/m2. 0C)
Wind velocity (m/sec)
Wind velocity at 10m height (m/sec) Corrected wind speed (m/sec)
Volume of the building (m3)
̇ Air flow rate due to mechanical ventilation (m3/h)
̇ Air flow rate due to natural ventilation (m3/h)
19
1 Introduction
1.1 Context
Buildings are seen as a key-part of the needed transition towards Sustainability in its energy dimension. This derives from the fact that the buildings sector represents between 30% and 40% of the demand of final energy in most developed countries. Given that in buildings there is a high use of electricity, these figures often convert to about or more than 40% in primary energy and
energy-related CO2 emissions. Complementarily, the Intergovernmental Panel on Climate Change (IPCC)
fourth assessment report states that about 30 percent of the projected global greenhouse gas emissions in the building sector can be avoided by 2030 with net economic benefit (Bernstein, et al. 2010).
Significant policy action towards the promotion of energy-efficiency and on-site renewable energy in the building sector has been developed all around the world, with different levels of intensity and structure. The fundamentals of this action go back at least to the 1970’s, when demand-side management started to be recognized as a viable – bedemand-sides rational - energy policy option. It then comprised actions such as the development of thermal regulations for buildings or the promotion of passive solar architecture, and kept gaining momentum until nowadays. For instance, the first French regulation on thermal requirements for buildings approved in 1974 (French Government 1974), Balcomb’s demonstration Passive Solar Building became operational in 1975 (Nichols 1976), the book “Solar energy—fundamentals in building design” was published in 1977 (Kreider 2003) and the Passive and Low Energy Architecture first congress was held in 1981 (Cook 2008).
In the European Union (EU), the Energy Performance of Buildings Directive (EPBD) approved in 2002 (EU 2003) called for the assessment and publicity of the energy performance of all new buildings as well as of those undergoing major refurbishments or entering the market for rental or selling. This directive is now at the stage of concrete implementation, while at the same time in October 2010 the Directive was replaced by a recast Directive approved in May 2010 (EU 2010). Other tools to enhance energy-efficiency and integration of renewable energy technologies have also been developing in several parts of the world, such as the PassivHaus design standard in Germany (Feist 1988), the BREEAM in the United Kingdom (BRE Group 1990) or the LEED certification in the United States (U.S Green Building Council, 2000).
A radical approach for the mitigation of the energy usage as regards the buildings sector is the concept of the net zero energy building (NZEB). This concept started to appear in the literature as an evolution of very energy-efficient buildings, and it requires that the building that has zero energy balance on an annual basis (Figure 1.1). Even if it may receive energy from the electric or gas grids at some times, it has local systems that produce and export energy carriers into the grids at other times so
20
that the annual balance is about null. Conceptually the exportation of energy could be made with various energy carriers, although for its easiness of transport electricity has been the obvious choice so far.
Figure 1.1: The Net Zero Energy Building Concept
The first country to require NZEBs in a large scale was the United Kingdom (UK), which in its Energy Efficiency Action Plan of 2007 stated: ‘In the household sector we will continue to raise
energy performance standards for new homes in England and Wales through Part L of the Building Regulations with the aim of delivering zero-carbon homes by 2016. The Code for Sustainable Homes will support this ambition and drive wider environmental improvements in new homes…’ (DEFRA
2007). By the same time, the Welsh Assembly Government adopted the target that all new buildings, not just housing, must be zero carbon in relation to space heating, hot water and lighting by 2011 (DEFRA 2007). The UK government has meanwhile announced to be conducting feasibility studies to enforce the NZEB target also for non-residential buildings (Department for Communities and Local Government 2009).
The movement to make NZEBs mandatory at least in the residential sector took another boost in 2009 when the European Parliament in its vote on 23 April 2009 voted: ‘Member States shall
ensure that all new buildings are at least net zero energy buildings by 31 December 2018 at the latest and that MS shall set targets for minimum percentage of buildings which shall be, by 2015 and by 2020 respectively, net zero energy buildings…’ (European Parliament 2010). This measure ended up
being adopted by the EU in a softer way, since the final EPBD recast approved on the 19th of May,
2010 calls for all new buildings to be nearly zero-energy buildings by 31 December 2020 and new buildings occupied and owned by public authorities to be nearly zero-energy buildings, after 31 December 2018, with the quantitative performance targets of ‘Nearly Zero Energy Buildings’ yet to be defined (European Parliament 2010).
Other NZEB enforcement examples are France, where all new buildings should be energy positive by 2020 ( European Commission 2009) and Hungary, which has set the target of achieving zero emissions for all new buildings by 2020 (Thomsen, Wittchen e EuroACE 2008). Ireland, is planning to have net zero energy buildings by 2013 and in the Netherlands there is a voluntary agreement with industry to have energy neutral buildings in 2020 ( European Commission 2009).
0 20 40 60 80 100 0 20 40 60 80 100
Annual Energy Import (C)
Annual
Energy
Ex
port
(P)
Net Zero Energy Building (P=C)
Deficitary Energy Building Plus Energy Building
21
Furthermore, Sweden has proposed a strategy for all public buildings to be zero energy by 2019, extending to all buildings by 2021 (Boermans, et al. 2011). Finally, in Norway zero energy buildings are expected by 2027 (Jagemar, et al. 2011).
In other parts of the World, South Korea has included residential NZEBs by 2025 as part of a Green Building Policy Package (United Nations Environment Programme 2010); to fulfill the objective of low carbon green growth, the Korean government unveiled ‘Measures to Develop Green Cities and Buildings’ on November 5, 2009 (Korean Government 2009).
Given the relevance that the concept of a Net-zero energy building is receiving from the policy makers in several geographical contexts, it is of outmost importance to develop technical tools that enable the quantification and analysis of their effective environmental and economic merits or defects. It is also important to develop tools that may assist the identification of the best design options for each type or buildings and location, as well as the identification of market failures or distortions of the regulatory framework that may need to be corrected in the adaptation to this new approach.
1.2 Design of NZEBs as an engineering problem
Reaching a null or even positive net yearly energy balance is, at least for low rise-buildings, not technically difficult. In the limiting case, it could be achieved even with a “conventional” design, complemented by the installation of sufficient on-site photovoltaic (PV) or other technologies able to produce exportable energy carriers. In practice, because of the cost of the photovoltaic systems, or because of other technical or non-technical reasons, in most cases the design strategy followed is to design the building with an energy-efficient way, and then incorporate PV systems to offset the yearly energy demand of the building. In fact the requirement of “energy efficiency” is even proposed by some authors as part of the definition of NZEB, as will be seen in chapter 2 (Torcellini, et al. 2006).
Yet, even if energy efficiency were to be accepted as a requirement, there are several levels of energy efficiency, and there are many ways of achieving a given performance target. E.g. there are many different combinations of design variables (shape, level of thermal insulation, glazed area, glazing orientation, type of glazing, type of ventilation, etc.) that could lead to about the same level of annual heating needs. This observation can be transposed to the whole annual energy demand for the building if the building systems (for heating, cooling, hot water) and the appliances are also considered.
On the supply side, too, there are several options that can be used to generate electricity and offset the yearly imports consisting of thermal solar collectors, photovoltaic modules, small wind turbines, efficient HVAC systems etc.
Combing the design variables that determine the energy demand with those that ensure the compensation, it becomes clear that there are many – potentially unlimited – combinations of them (building design solutions) that can result in an approximate annual net-zero energy balance. Yet, even if all resulting in a yearly zero balance, it is clear that they will achieve the balance at different levels
22
of energy import-export equilibrium and that they have different initial costs and different expected life-cycle costs.
The ‘know how’ that has been established previous to this work takes the form of design guidelines which address, for some climatic contexts, the form, orientation, thermal mass and windows (Charon e Athienitis 2006). Despite its apparent logic, these guidelines are not a product of a rigorous systematic analysis covering all the range of possibilities, meaning that there has not been an analysis of the ‘optimal’ coupling point for the energy import and export level. However, the problem of producing and comparing the results of many different possible combinations of variables and identifying and “optimal” or “near optimal” is a common type of engineering problem which can be solved with several methods.
1.3 General objectives and structure of this work
The aim of this work is the development of a method and an associated calculation platform to identify the most adequate design solutions for residential NZEB design, considering the influence of the local climate, the endogenous energy resources and the local economic conditions. The translation of ‘most adequate” is something that, according to decision theory, implies knowing and understanding a decision maker. For this work, no specific decision perspective will be adopted. It will be intended to characterize essentially the investment cost, expected life-cycle cost and level of energy use at which the net zero import-export balance is met. The lowest life-cycle cost (LLCC) solution will be taken as a reference for the analysis of the results, but the methodology and the tool will be structured to allow any future user to adopt a different solution, valuing different criteria, with the advantage that in that case it will be possible to know how distant the chosen solution is from the lowest life cycle cost one or from the lowest initial cost (LIC) one. Once the analysis tool is developed, it will also be an aim of this study to gain insights on the characteristics of the space of design solutions for NZEBs. By using building case studies and considering different climatic contexts, it will be sought to answer to questions such as:
Which are the design variables that have higher impact on the energy performance & optimal
design of NZEBs?
Is there a trade-off trend between Life Cycle Cost (LCC) &Initial Cost (IC) for the buildings
that provide a net zero energy yearly balance? If yes, does this happen in all climate-economic contexts or only in some?
Do energy-efficient NZEBs have higher, similar or lower LCC and /or IC costs than
non-energy efficient buildings?
What is the impact of pricing policies electricity for the electricity bought to buildings in:
23
o Best design solutions (features that appear frequently in the optimal or near-optimal solutions);
o The level of energy use at which the net zero import-export balance is met
Are high-rise NZEBs technically feasible, and in what way are the economic indicators and
design solutions affected?
What would be the influence of microgeneration cost variations on the economic indicators
and design solutions?
The answer to these questions was achieved throughout a process, which is roughly in correspondence with the main chapters of this work. More specifically:
Chapter 2 is a review of the state of the art so far and a description on the recent progress of
the policy context and scientific formulations around net zero energy buildings, analysed from different perspectives. It starts with a listing of all the definitions published so far, continues with presenting a number of residential and commercial demonstration buildings already built and reported and ends with an analysis of the current design practices of NZEBs.
Chapter 3 addresses the calculation methodologies used in order to characterize the energy
demand and supply of a building as well as its economic performance. More specifically, steady state methodologies for calculating the heating, cooling and peak heating loads of a building were used based on existing and validated standards. Moreover, a peak cooling load calculation methodology was implemented in order to size the cooling equipment. Domestic hot water needs were sized depending on the number of occupants and the climatic conditions while default values for ventilation, lighting and appliances final needs were considered. Electricity generation from photovoltaic panels and wind turbines was estimated together with the annual energy produced from solar collectors. Finally, the economic effectiveness of the building project was based on the life cycle cost method.
Chapter 4 begins with the identification of the design variables relevant in order to shape the
energy demand and supply of the building and continues with the implementation of the methodologies for characterizing the energy demand-supply and the economics, described in chapter 3, in a computer simulation program-computational tool developed in Matlab (Matlab 2011).
Chapter 5 and Chapter 6 demonstrate two application examples of the tool implemented in
chapter 4, and present the results on which the answer to the research questions will be based on.
Chapter 7 is the chapter with the conclusions and final remarks as well as a brief description
24 1.4 Delimitations of scope
The coverage of this work is limited as regards the following:
The net zero energy balance is made in terms of final energy. However, it can be overcome
using the “level of compensation”, which is the fraction of the annual energy imports to the building to be offset with exports (chapter 5.1);
PV panels are installed only in the roof or other horizontal planes but not on the façades.
Nevertheless, it is known that the productivity of PV panels on vertical walls is significantly lower than when placed in the optimal inclination so it is not expected that these solutions would be chosen as economically optimal;
25
2 Review of net zero energy buildings design methodologies and practices
This chapter intends to present a critical assessment of the progress on Net Zero Energy Buildings in the latest years. The progress was analyzed in several perspectives, which became a sub-chapter each: i) Progress in defining the concept of NZEB; ii) Progress on Demonstration Buildings (residential and non-residential); iii) Progress on Design Strategies. It ends with the major conclusions.
2.1 Progress in defining the concept of NZEB
The literature shows that there are different definitions of a net zero energy building. The first major difference found is of formal nature and concerns whether or not the word ‘net’ must be explicit in the expression, thus the difference being between ‘zero energy building’ and ‘net zero energy building’. It presents little doubt that, while the first may be more practical, the latter is the scientifically correct. While some of the founding documents in NZEB definition where addressing it simply as “ZEB” (Torcellini, et al. 2006), a search in the major search engine (google.com) in the internet in November 2010 found that actually the correct expression was then more used by a factor of 2.5 over the simplified one. NZEB is also the expression appearing in latest reference publications in the area (Robert e Kummert 2012), (Marszal, et al. 2012), (Sartori, Napolitano e Voss 2012), (Kurnitski, et al. 2011) .In terms of conceptual substance, two main differentiation factors were found: a) the level of the energy chain at which the balance is made; and b) the requirement for a high level of energy efficiency.
Concerning the issue of the level of the energy chain at which the balance is made, Torcellini et al. addressed four main definitions of NZEBs (Torcellini, et al. 2006):
1. Net Zero Site Energy: A site NZEB produces at least as much energy as it uses in a year,
when accounted for at the site.
2. Net Zero Source Energy: A source NZEB produces at least as much energy as it uses in a
year, when accounted for at the source. Source energy refers to the primary energy used to generate and deliver the energy to the site. To calculate a building’s total source energy, imported and exported energy is multiplied by the appropriate site-to-source conversion multipliers.
3. Net Zero Energy Costs: In a cost NZEB, the amount of money the utility pays the building
owner for the energy the building exports to the grid is at least equal to the amount the owner pays the utility for the energy services and energy used over the year.
26
4. Net Zero Energy Emissions: A net-zero emissions building produces at least as much
emissions-free renewable energy as it uses from emissions-producing energy sources.
In a similar level of analysis, the International Energy Agency (IEA) defines NZEBs as buildings that do not use fossil fuels but instead get all their required energy from solar energy and other renewable energy sources (Laustsen 2008). It proposes the following variants:
1. Zero Net Energy Buildings are buildings that over a year are neutral, meaning that they
deliver as much energy to the supply grids as they use from the grids. Seen in these terms they do not need any fossil fuel for heating, cooling, lighting or other energy uses although they sometimes draw energy from the grid.
2. Zero Stand Alone Buildings are buildings that do not require connection to the grid or do so
only as a backup. Stand-alone buildings can autonomously supply themselves with energy, as they have the capacity to store energy for nighttime or wintertime use.
3. Plus Energy Buildings are buildings that deliver more energy to the supply systems than they
use. Over a year, these buildings produce more energy than they consume.
4. Zero Carbon Buildings are buildings that over a year do not use energy that entails carbon
dioxide emission. Over the year, these buildings are carbon neutral or positive in the term that they produce enough CO2-free energy to supply themselves with energy.
IEA’s definition of ‘Net Zero Energy Buildings’ thus seems to correspond to the ‘Net Zero Site Energy’ of Torcellini et al., while the ‘Zero Carbon Emissions’ is closely related to the ‘Net Zero Energy Emissions’ of Torcellini et al. It could also relate to the ‘Net Zero Source Energy’ variant if only the fossil component primary energy were considered.
In another definition variant, Hernandez and Kenny provide a definition that accounts for the embodied energy, together with energy use and reclaims the original concept of ‘net energy’ to define life cycle energy building (LC- ZEB): ‘ A LC-ZEB is defined as a building whose primary energy use in operation plus the energy embedded in materials and systems over the life of the building is equal or less than the energy produced by renewable energy systems within the building (Hernandez and Kenny 2010). This definition however doesn’t seem to have been adopted by most authors, be it for its concept be it for the practical difficulty in knowing the embodied energy of most materials.
Addressing now the second main differentiating factor regarding the definition, it was found that some sources make an explicit requirement that, to be classified as NZEB, the balance between the energy ‘on-site production’ and the energy demand be made at a low level of energy demand, i.e., that the on-site generation be added to a building where significant energy-efficiency measures were taken to decrease the demand. This is the case e.g. of the United States Department of Energy (DOE) : ‘ A net-zero energy building is a residential or commercial building with greatly reduced needs for energy through efficiency gains, with the balance of energy needs supplied by renewable energy technologies’ (U.S Department of Energy, Building Technologies Program:Planned Program Activities for 2008-2012 2008) and of Wang et al: ‘The zero energy building design concept is an
27
extension from passive sustainable design (Wang, Gwilliam and Jones 2009).In line with the explicit requirement for the zero balance to be met at a high level of energy-efficiency, the following three examples could be found:
1. The California Energy Commission (CEC) states that ‘a zero net energy building merges
highly energy-efficient building construction, state of the-art appliances and lighting systems, and high performance windows to reduce a building’s load and peak requirements and can include on-site solar water heating and renewable energy, such as solar photovoltaic, to meet remaining energy needs (Figure 2.1). The result is a grid-connected building that draws energy from, and feeds surplus energy to, the grid (California Energy Commission 2009).
Figure 2.1: ‘A zero net energy building merges highly energy-efficient building construction, state of the-art appliances and lighting systems, and high performance windows to reduce a building’s load and peak requirements and can include on-site solar water heating and renewable energy, such as solar photovoltaic, to meet remaining energy needs. The result is a grid-connected building that draws energy from, and feeds surplus energy to, the grid’. (California Energy Commission 2009)
2. The Massachusetts Zero Net Energy Buildings Taskforce in 2009 defined a NZEB as a
building that is optimally efficient and, over the course of a year, generates energy onsite, using clean renewable resources, in a quantity equal to or greater than the total amount of energy consumed onsite (Massachusetts Zero Net Energy Buildings Task Force 2009).
3. Members of the European Parliament adopted a definition of zero-energy buildings as
buildings ‘where, as a result of the very high level of energy efficiency of the building, the overall annual primary energy consumption is equal to or less than the energy production from renewable energy sources on site’ (European Parliament 2010). By the end of 2010, the Commission was planning to establish a detailed common European definition of ‘net zero energy buildings’. Although the mandatory adoption of NZEBs was not followed by the Commission the requirement for a high level of energy efficiency was adopted in the revised EPBD.
The approach above of having an explicit requirement for the zero balance to be met at a high level of energy-efficiency comes in opposition to the strategy, which would also lead to net-zero
28
balance, of adopting no special measures regarding the energy efficiency and then installing enough on-site generation to offset the (high) consumption. In respect to this question, it can be commented that, in a performance driven society, only the goals and not the means should be part of the requirements. This would reason in favor of a definition that does not have an explicit requirement for energy efficiency, leaving to the results themselves to show that the most rationale options are those that result from the complete consideration of all NZEB alternatives converging from the perspective of energy efficiency, cost effectiveness and local climate context. This will be the perspective adopted in this work, because in this way it will be possible to assess the hypothetical added costs of including an explicit requirement of high energy-efficiency in the definition. I.e., to explore the space of design solutions without this requirement results in a more comprehensive analysis than without it. E.g., if even without the requirement of “high energy efficiency” the results show that the cost-optimal solutions are of this nature, then it becomes concluded that high energy efficient solutions are the ones that “naturally” result in the cost-optimal; If by the contrary it is found that the solutions with high energy efficiency are more costly overall than the non-high energy efficient ones, then the policy makes may still adopt them based on other criteria, but he is informed about the “added cost” of such decision.
Another important issue at the level of concept definition is the one of performance indicators for NZEBs. Some derive directly from the base-variables selected for the balance definition, as are the case of yearly primary energy balance, yearly associated carbon emissions and yearly energy costs (Torcellini, et al. 2006). In many NZEB case studies, the Estimated Net Energy Produced (ENEP) is often computed (Iqbal 2004) (Wang, Gwilliam e Jones 2009) (Zhu, et al. 2009)(Zhu, Hurt, Correa et al., 2009). These are the energy carriers produced via renewable sources minus the energy required for the building operation for a specified period of time (Kolokotsa, Rovas, et al. 2011). Furthermore, Hernandez and Kenny in 2010 introduced the concept of the Net Energy Ratio (NER) which is the ratio of the decrease of annualized embodied energy to the increase of annual energy use (Hernandez e Kenny 2010). Kolokotsa et al in the same year, addressing the issue of NZEB operation under real conditions, introduced another indicator called “Net Energy Consumed” (NEC) which is the amount of energy that needs to be purchased from the utility company and equals to the negative of the “Net Energy Produced” (NEP) (Kolokotsa, Rovas, et al. 2011). The same authors introduce some performance indicators of Building Optimization & Control (BO&C) systems for NZEBs, which can be used to assess energy performance, thermal comfort, and cost efficiency. More specifically, these indicators include: 1) the Generation–Consumption Effectiveness Index (GCEI), which measures the quality of the decision/control strategy compared to the optimal strategy; it actually compares the effect different decision/control strategies have on system performance; 2) the CI1 index which integrates thermal comfort, visual comfort and indoor air quality measured by specific sensors in the building. It can be linked to the requirements of CEN standard EN 15251 (CEN, 2006); 3) the CI2 index which depends on the end users responses as a result of their interaction via a user interface where the thermal comfort preferences are inserted to the system; 4) the Building Optimization and
Control (BO&C) Payback Period (PP) which is theperiod required to amortize BO&C implementation
29
2.2 Progress on NZEB demonstration buildings
Many modern NZEBs, both residential and commercial, have been built, tested and reported in different parts of the world starting in the early 1990’s. The adjective ‘modern’ is employed here to differentiate these buildings from buildings without provision of electricity and using mainly biomass for cooking and heating, which dominated most of the world’s history and still dominate significant parts of the African and Asian continents. Even if these modern NZEB buildings were not built for a specific scientific purpose but rather for a normal use, they will be considered here as demonstration buildings in the sense that they demonstrate the feasibility of the concept. The progress in demonstration NZEBs is presented starting with two very early examples that have set the pathway, continuing with more recent constructions of new buildings and ending with 2 examples of retrofits to NZEB target.
2.2.1 Residential NZEBS
Historically, NZEBs can be seen as an extension from the concept of “solar” or “passive” buildings which had been developed since the 1970’s, and of which many demonstration buildings have been built around the World (Nichols 1976), (Maldonado, Fernandes e Gonçalves 1987).
In 1992, the Fraunhofer Institute for Solar Energy Systems ISE set about the operation of the Self-Sufficient Solar House in Freiburg (Figure 2.2) (ISE 2000); this can be considered the first ‘modern’ ZEB. For three years 1992 to 1995, the house was occupied by a family of two adults and one child and demonstrated that the sun can provide a house with all the energy that it needs, even in the Central European climate where the solar radiation available is moderate. During that period, the home was not connected to the grid and there was no other external supply of non-solar energy; the success of the project was based on solar generated hydrogen as the energy storage form for electricity & heat and a fuel cell as a miniature cogeneration power plant. Nowadays, the building is used as a research platform.
Another ‘early’ example of a NZEB was constructed in Lakeland, Florida in 1998; an experimental residential building called ‘PVRES’ (super-energy-efficient photovoltaic residence); constructed together with a conventional one (both had the same floor plan) which played the role of the project control (Building America U.S Department Of Energy 2005). The ‘PVRES’ home (Figure 2.2) had higher levels of thermal insulation, a white reflective roof system, solar water heating and efficient interior appliances and lighting, a high efficiency heat pump and a photovoltaic (PV) system (Florida Solar Energy Center 2007). Even though the project, did not reach zero energy annual balance (the annual energy needs in terms of final energy were covered by 75%), it showed that virtually zero net utility peak coincident demand was possible and became the flagship for the program of the U.S Department of Energy: Zero Energy Homes (Parker 2009).
30
Figure 2.2.: The Solar House in Freiburg (left) (ISE 2000), PVRES, Lakeland Florida (right) (Parker 2009)
Another net zero energy home (NZEH) is the ‘Solar Harvest’, a 426 m2
house designed and constructed by Eric Doub and his company Ecofutures Building Inc in 2005 (Doub, Solar Harvest : City of Boulder ’ s First Zero Energy Home. 2009). It is located in Boulder, Colorado, U.S (Figure 2.3). The concept is a combination of active and passive solar design features with heavy thermal insulation, high performance glazing and windows and highly efficient equipment. All the appliances in the house are electric since 2007, with all its electricity needs covered from PV panels while space heating and domestic hot water is provided by solar thermal flat-plate collectors. Moreover, it features extended engineered heat recovery ventilation (HRV) system and a PVC pipe buried underground for seasonal thermal pre warming and pre cooling of the incoming fresh air.
Figure 2.3: Solar Harvest, Boulder, Colorado (Doub, Solar Harvest : City of Boulder ’ s First Zero Energy Home. 2009)
In 2005, the University of Nevada launched a zero energy house (ZEH) research (Hurt, et al.
2006). The result was two homes of the same area (150m2) constructed side-by-side (Figure 2.4); a
baseline house built with conventional materials and techniques and a ZEH. The ZEH featured on one hand many energy saving measures like high thermal mass walls, spectrally selective low-e windows, compact fluorescent lighting, foundation insulation and a radiant heat barrier and on the other hand solar power generation through a PV array and a supplemental water heating (solar water heater).
The Plus Energy Housing (Plusenergiewohnen) ‘Tanno meets Gemini’ (Figure 2.5) was built in Weiz, Steiermark, Austria, in 2006 (Novakova 2006). The construction was Austria’s first energy
positive project and it includes 22 flats within an area of 3294 m2. All flats feature high-level
insulation and triple low-e windows, a high efficiency heat pump to cover the heating needs of the residences, while the energy consumption is being offset through installed PV panels.
31
Figure 2.4: University of Nevada ZEH (Hurt, et al. 2006)
Another NZEH is located in Flieden, Hessen, Germany was constructed in 2006; the ‘Solar
Plus Haus’ in Flieden covers a 212m2
area (Pedro Castro Ricardo 2009). The construction incorporates high levels of insulation, triple windows and controlled mechanical ventilation with a heat recovery system while the energy needs are covered with the combined use of solar collectors, PV panels and a wind turbine.
Figure 2.5: Pluesenergiewohnen,Weiz,Austria (Novakova 2006)
The ‘Eco Terra’ house located, in Eastman, Quebec, Canada is a 140m2
Net Zero Energy house built in 2007 (Noguchi, et al. 2008); it is Canada´s first net zero energy home (Figure 2.6). The home features a super air tight envelope with high levels of insulation, triple low-e coated windows and high efficiency appliances. It integrates conventional heating technologies such as geothermal heat pump (GHP), building-integrated photovoltaic thermal (BIPV/T) roof system, ventilated concrete slab (VCS), passive solar design and active thermal storage.
Hawkes Architecture in 2009, in Staplehurst, Kent, UK, constructed the ‘Crossway
Eco-House’ (Hawkes 2009) (Figure 2.7) a 285m2
NZEH with increased insulation, high performance gypsum board used in wet and high humidity applications, triple glazing and high efficiency appliances. The heating energy needs are supplied from a Photo Voltaic Thermal (PV-T) system and a salt phase change material thermal store backed up by a biomass boiler.
Doub in 2008 presented a retrofit towards NZEB target of a 1970s ranch home in South Boulder, Colorado (Doub 2008). The retrofit resulted in a super insulated opaque envelope (thermally
broken wall U-value= 0.2 W/m2°C, roof & attic U-value= 0.1 W/m2°C) & airtight building shell with
high performance double heat mirror windows. Mechanical ventilation with an energy recovery ventilator was also used. The energy needs for DHW were fully covered by 180 evacuated tube solar collectors and the electricity needs from a 6 KW PV system.
32
Attia in 2010 presented the results of a study regarding a possible retrofit to NZEB level of a chalet in Ain- Sukhna, Egypt (Attia 2010). The author investigated several passive and active design strategies and concluded that on an economical level the most active design strategies (i.e., those dealing with equipment) and even the thermal upgrade of the envelope were not advantageous due to the long term Payback Period. The only measures with low pay-back periods were compact fluorescent lighting and a solar collector thermosyphon for Domestic Hot Water, with less than 1 year and 2-7 years payback period respectively. Wall external thermal insulation (U-value= 0.234
W/m2°C), roof insulation (U-value= 0.177 W/m2°C), double pane low-e windows, 1m overhang on the
east façade, 1.1 kWp PV system and a small scale wind turbine expected to deliver 660 KWh/yr, were considered not attractive economically, with pay-backs ranging from 19 to 41 years.
Figure 2.6: The Eco-Terra House, Canada (Noguchi, et al. 2008)
Figure 2.7: The Crossway Eco-House, Kent (Hawkes, 2009)
Table 2.1 presents a ‘summary’ of the main technical features of the residential NZEBs mentioned above. The solar house in Freiburg is not included in the summary due to lack of information data.
33
Table 2.1: Main Technical Features of Residential ZEB examples
2.2.2 Non residential/commercial NZEBs
Even though non-residential buildings will not be part of the focus of this work, their inclusion in the bibliographic review may be useful in establishing the context of design features and practices.
The Adam Joseph Lewis Center (Figure 2.8) for Environmental Studies is an all-electric ZEB
located on the Oberlin College campus in Oberlin, Ohio, which covers an area of 1260m2. The
construction was complete in 2000. The Lewis Center generates its own on-site electricity through a roof mounted 60 kW photovoltaic system and a 100 kW PV system located over the parking lot (Pless, Torcellini e Petersen 2004).
The Science House at the Science Museum of Minnesota (Figure 2.9) is a ZEB recognized by
the European Council for an Energy-Efficient Economy (ECEEE) in 2005 for its innovation (Steinbock, et al. 2006). The building makes use of high performance windows, daylight dimming
Data logger for weather and thermal conditions and major end-use electric loads
Data monitoring with temperature, energy and comfort system sensors
Data monitoring to measure weather conditions and electricity and gas consumption
-Roof integrated photovoltaic system 8.74 kW roof-mounted PV array Photovoltaic system of 4.8KWp Mechanical ventilation with HR Crossway Eco-House Wall U-value 0.12W/m2.K Roof (U=0.12W/m2.K) Triple glazed argon filled
windows Vault overhangs & integrated
blinds within some windows
No conventional heating Extracted heat is stored in
phase change materials (PCMs) creating heat battery for hot water & top up heat
-PV panels Wind turbine
Data monitoring with sensors for thermal performance and energy efficiency assessment
Built in sensors measure themal performance, electricity, water consumption and solar thermal monitoring CFL, LED & halogen lighting Efficient appliances 26m2 of photovoltaic thermal (PV/T) system Biomass boiler 3KW building integrated photovoltaic thermal system (BIPV/T) CFL lighting Efficient appliances Wall U-value 0.16 W/m2.K Roof U-value 0.125W/m2.K Triple glazed low-e coated
argon filled windows
Air tight construction Mechanical ventilation
ZEH Nevada
Eco- Terra
Mechanical ventilation
-Geothermal Heat Pump (GHP)
High efficiency heat pump for space heating and domestic hot water purposes AC system with evaporative
condenser 2.3 m2 solar collector
Tankless gas hot water heater CFL lighting Efficient appliances Tanno meets Gemini Mechanical ventilation with HR Wall U-value 0.11W/m2.K)
Triple windows Solar collectors
CFL lighting Efficient appliances Solar Plus House Wall U-value 0.11W/m2.K) Roof U-value 0.09W/m2.K
Triple glazed low-e windows
CFL lighting Efficient appliances
Wall U-value 0.17W/m2.K Ceiling U-value 0.126W/m2.K
Double glazed fiberglass
windows Shading provided by solar panels
and trees Air tight construction(average ACH=0.1) Heat recovery (HR) ventilation system Natural Ventilation
Solar thermal heating (12 roof-mounted solar thermal
collectors) Summer cooling by natural
chimney effect through
skylight Ground cooled air through
buried pipes High efficiency AC
CFL lighting Efficient appliances
Thermal mass walls Radiant barrier sheeting
Blown in attic insulation(U=0.15W/m2.K) Low-e windows Large overhangs 2.43m Solar Harvest PVRES
Air tight construction (average ACH=0.13) No mechanical ventilation Photovoltaic crystaline modules Solar water heating
High efficiency HVAC system CFL lighting Efficient appliances Wall U-value 0.57W/m2.K Roof U-value 0.19W/m2.K
White reflective roof Thermal break + argon filled windows
Overhangs around the building
Residential Case Studies
Main Technical Features
Electricity Production
Energy Management Systems Air change Heating/Cooling & Hot
Water
Lighting & Appliances Envelope
34
controls, south side overhangs, north side clerestory windows, high levels of insulation for the walls and roof and occupancy sensor controls of all interior lighting systems. Moreover, premium efficiency ground source heat pumps are used to heat and cool the building, a heat pump assisted domestic hot water (DHW) system and ventilation energy recovery. Electricity is produced by integrated photovoltaic roof systems of flat plate polycrystalline silicon panels.
Figure 2.8: The Adam Joseph Lewis Center for Environmental Studies, Ohio (Pless, Torcellini e Petersen, Oberlin College Lewis Center for Environmental Studies: A Low-Energy Academic Building 2004)
Figure 2.9: The Science House at the Science Museum of Minnesota (Steinbock, Eijadi, Mcdougall, Vaidya, & Weier, 2006) The Hawaii Gateway Energy Center (Figure 2.10) is another example of a net zero energy
commercial building with an area of 334m2 built in 2005 that serves the Natural Energy Laboratory of
Hawaii (U.S Department of Energy 2008). The building combines extensive daylighting due to its orientation and configuration, a passive thermal chimney, and a cooling system that utilizes seawater to reduce energy consumption; nowadays it actually exports more electricity than it produces via a PV array system.
35
Figure 2.11: The Aldo Leopold Legacy Center, Baraboo, Wisconsin (Thermal Energy Systems Specialists 2007)
The Aldo Leopold Legacy Center (Figure 2.11) is a commercial (Interpretive Center,
Commercial office) carbon-neutral ZEB covering an area of 1100 m2, completed in 2007 in Baraboo,
Wisconsin (Thermal Energy Systems Specialists 2007). The construction maximizes the use of daylighting to reduce the need of electric lighting during the day; heating is provided by ground source heat pumps connected to a radiant slab and an earth tube system provides fresh air to the building. Finally, a rooftop PV array produces 10% more of the annual electricity needed for the building to operate.
In San Jose, California, in 2007, a 609m2 area commercial office carbon neutral ZEB was
constructed and called the IDeAs Z Squared Design Facility (Figure 2.12). The building utilizes a high-efficiency HVAC system featuring a ground-source water-to-water heat pump system that provides radiant heating and cooling via the floor slabs and a rooftop integrated photovoltaic system, which also uses PV panels for solar shading over the entrance (U.S Department of Energy 2009), (Nesler e Palmer 2009). Skylights and high performance windows maximize the amount of daylighting entering the building while east windows use electrochromic glass; an automatic lighting control system exists and high efficiency equipment is used.
Figure 2.12: The IDeAs Z Squared Design Facility, California (left) (U.S Department of Energy 2009)
A rather new example of a mixed use (office/ retail/residential) ‘beyond’ zero energy building is still under construction in Masdar city, United Arab Emirates and is planned to be completed in the
end of 2010.The Masdar Headquarters building (Figure 2.13) is planned to be the world’s large-scale
positive energy building. The building will feature integrated wind turbines, outdoor air quality monitors and one of the world’s largest building-integrated solar energy arrays while all materials
36
used will be sustainable. Wind towers will be used to exhaust warm air and naturally ventilate the building while at the same time bringing cool air up (Smith e Gordon 2008). Natural daylight will be provided to the building through cones which will support the building’s roof and allow for the creation of a shaded micro climate.
Figure 2.13: Masdar City Headquarters, United Arab Emirates (right) (Smith e Gordon 2008)
Table 2.2 presents a ‘summary’ of the main technical features of the commercial NZEBs described in this section, while Table 2.3 shows which NZEB examples discussed so far have their performance comproved by monitored data rather than only on design data.
Table 2.2: Main Technical Features of the Commercial NZEBs
Hawaii Gateway Energy Center
Passive thermal chimneys
20KW PV
system Occupancy and photosensors Deep seawater pumping for
passive cooling Energy efficient lighting and appliances Walls U-value 0.9W/m2.K Roof U-value 0.23W/m2.K
High performance windows Daylight harvest
Aldo Leopold Legacy Center
Mechanical ventilation with heat recovery Natural ventilation Energy efficient lighting and appliances Masdar City
Headquarters No available data
High efficiency HVAC system
Radiant heating & cooling Ground-source heat pump
Occupancy sensors Automatic controls Monitoring equipment Highly rated insulation
High efficiency windows Skylights Daylight harvesting IDeAs Z2 Design Facility -Energy efficient lighting and appliances 30 KW roof membrane integrated PVsystem -39.6-kW PV array Ground-source heat pumps Wood burning stoves
Earth tubes to preheat or pre-cool
High levels of insulation High performance windows Overhangs Increased daylight penetration
Adam Joseph Lewis Center
Science House in Minnesota
Monitoring of building systems Occupancy sensors
Photoelectric daylight sensors Carbon dioxide sensors Automated operable windows Roof integrated 60KW+100KW PV system Energy efficient lighting and appliances Closed-loop geothermal wells Wall U-value 0.14W/m2.K Roof U-value 0.2W/m2.K
High performance windows 1.21m overhangs (south) Maximum daylight
Daylight dimming controls Occupancy sensor controls Continuous computer
monitoring Control of mechanical systems Mechanical
ventilation with HR Wall U-value 0.4W/m2.K
Triple pane, argon filled, low-e glazing South-facing curtain wall Thermal mass through
concrete floors
Exposed masonry walls Window shades 8.8KW PVsystem Energy efficient lighting and appliances Premium efficiency ground
source heat pumps Heat pump assisted DHW Electric resistance back-up
Mechanical ventilation with heat recovery Multi-modal natural ventilation
Commercial
Case Studies Intelligent Energy
Management Systems
Main Technical Features
Heat Gain/Loss through Envelope
Heat Loss through Ventilation
Heating/Cooling & Hot Water
Lighting & Appliances
Electricity Production