Abstract
Railway track irregularities consist of a deviation of the inside edge of the rail from the ideal geometric rail contour and may occur even during the passage of the vehicle at a very low speed. Track irregularities can influence the dynamic behaviour of railways bridges and increase dynamic load effects. This paper addresses the influence of different irregularities on the dynamic behaviour of a medium span bridge. Random irregularities, continuous all over the rail, are considered. The maximum response of the bridge, displacements and accelerations, at the mid span is calculated. For these calculations the dynamic model of the ballast track, present in the ERRI studies, is used and the response of the ballast is also analysed.
Keywords: irregularities, railway bridges, ballast track, high speed trains.
1 Introduction
The response of railway bridges under the moving train is a complex task involving dynamic interaction between the vehicles and the bridge. The train running with high speed induces dynamic impact on the bridge; the vibration of the bridge affects the running stability and comfort of the train. The response of the bridges is conditioned by several factors: the characteristics of the bridge, first frequency and damping; the characteristics of the vehicles: speed, number of axles, axle spacing, axle loads and the characteristics of the ballast track, stiffness, damping and roughness profile. Several of these factors are random or dominated by statistical uncertainties, for example the track irregularities, and an appropriate assessment of the dynamic response of the bridge requires the development of probabilistic models where the consideration of randomness is applied.
In order to avoid complex dynamic calculations, whereby the bridge and specific track profiles are considered, the eurocode [1] applies a factor φ" to increase live
load effects which represents the additional dynamic effect due to track irregularities. The purpose of this paper is to present the dynamic response of a medium bridge when different profiles for superelevation irregularities are considered. Two wavelength ranges are used: D1, 3≤λ≤25 m, and D2, 25≤λ≤70 m, whereby the amplitude is defined as the maximum that trigger alarm limits given in [2], for the alert limit, and consequently for maintenance operations. The maximum response of the bridge, displacements and accelerations, at mid span, and the acceleration on a sprung mass, simulating the forth axle of the train are presented. As the dynamic model of the ballast track, presented in the ERRI studies [3], is implemented between the bridge and the moving vehicle, the response of the ballast is also analysed.
2 The bridge/track/vehicle system
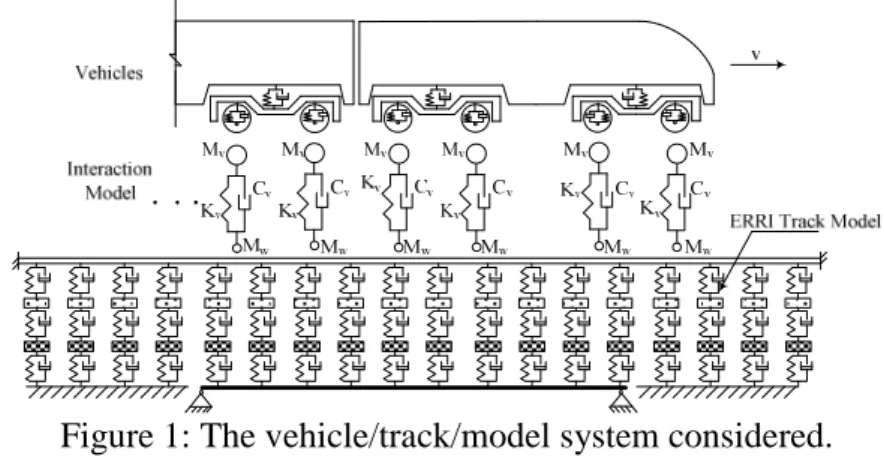
The railway ballasted track model is made of several elements which represent the rails, the sleepers, the connections between rails and sleepers, and the ballast. A large variety of ballasted track models has been investigated, from the simple 2D model, where a single rail is modelled as an infinite Bernoulli-Euler or Timoshenko beam resting on supports defined by springs, dampers and point masses, to more complex 3D models, where both rails are taken into account and bending and shear deformation of the sleepers are included. In these models, the ballast bed is included through vertical spring and damper elements [4], [5] e [6]. The ballast model used in this investigation is presented in the ERRI studies on the subject, [3]. In this model, the connections between rail and sleeper are included as linear springs and viscous dampers acting in parallel. Their elastic and damping properties are mainly determined by the properties of the material and the manufacturing processes. The sleepers are included as rigid bodies with point mass. The ballast bed is included as discrete linear springs and viscous dampers, the mass of the ballast is included as point mass instead of distributed mass, and springs and dampers are used to simulate the connection between bridge and ballast. The values of the mechanical properties for each model are presented in [3].
The bridge deck is a prestressed concrete, 23.5 meters long, simply supported slab with a slightly variable depth and a mass per unit length of about 21 ton/m, existing on the Austrian Railway, [7]. The stiffness of the bridge is EI=18722 MNm2 and the first frequency is n0=2.7 Hz. These parameters defined a flexible structure at the
lower frequency limit permitted by [1] and the resonance effects are very critical. A damping of 1% was assumed, as prescribed in [1], for bridges with a span L≥20 m. In order to ensure that the resonance effects were not underestimated, the ICE2 train was selected because it has the largest number of regularly repeating groups of axles. Additionally all the ICE2 vehicles have relatively high unsprung masses of 2 tonne, for the power car, and 1.7 tonne for all coach axles. The vehicle model applied in this study is formed by a single unsprung mass Mw and a sprung mass Mv,
supported by a spring with stiffness Kv, and a damper, representing the viscous
damping mechanism, with constant Cv. The values of the parameters for the vehicle
The software ADINA is used to compute the dynamic response, by direct time integration of the system of the dynamic equilibrium differential equations using the Wilson-θ method. Concerning the damping, the Rayleigh matrix was used, that is, C=α·M+β·K, with constants α and β compatible with the value of ξ at the first and fourth eigenfrequencies of the bridge.
Figure 1: The vehicle/track/model system considered.
3 Evaluation of the Irregularities Effects
3.1 Track superelevation irregularities
Railway track irregularities are normally due to imperfections, to fabrication, to the construction of the track or even due to inadequate maintenance. There are several kinds of irregularities that may be found on railway bridges: deterministic, isolated or regular along the rail, or irregular random, also along the rail, their probabilistic idealization involves the use of the theory of stochastic processes. An appropriate mathematical modelling of these irregularities can be based on the concept of stationary stochastic process, whose probabilistic structure can be conveniently characterized by their respective power spectral density functions Grr(Ω), in which Ω
is the spatial frequency (rad/m). According to [4], this power spectrum can be represented by the following formula for superelevation:
( )
(
)(
22)
r 2 2 2 2 1 2 A G Ω = Ω Ω + Ω Ω + Ω (1)where A=0.59E-06 rad.m, Ω1=23.3E-03 rad/m and Ω2=13.1E-02 rad/m, for the class
6, according to the Federal Railroad Administration (FRA), class 6 indicating the best quality. For this study, the value of A was assumed in order to establish samples profiles of irregularities with root mean-square values similar to the alert limits proposed in [2]. The irregularities were considered under a vertical deformation of the rail of the ballasted track.
The generation of an artificial discrete profile of the rail can be performed based on the previous knowledge of the power spectral density function Grr(Ω), assuming
( )
n i(
i i)
i 1
r x A cos x
=
=
∑
⋅ Ω ⋅ − θ (2)Ωi is a frequency within the interval of relevant spectral content, Ai is the amplitude
of the corresponding harmonic wave, θi is the random phase angle with uniform
distribution in the interval [0,2π] and n is the total number of harmonic waves considered. The amplitude Ai can be determined from a given power spectral density
by
( )
i i i
A = 4⋅ ∆Ω ⋅G Ω (3)
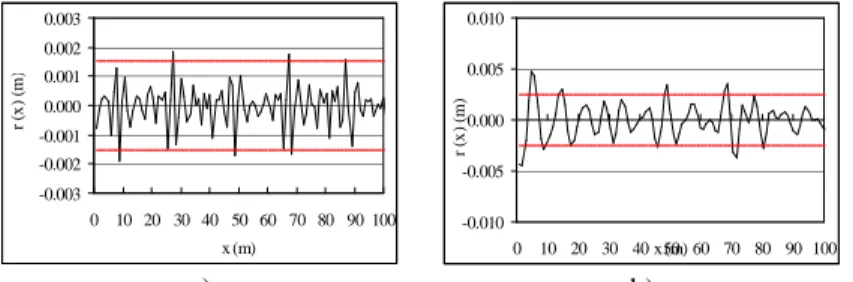
where ∆Ωi is the frequency increment. Figure 2 represents two artificially generated
profiles using different intervals of wavelengths, D1 and D2, as defined in [2]. In figure 2a) D1, 3≤λ≤25 m, and Figure 2b) D2, 25≤λ≤70 m, the red lines indicate the alerts limits for standard deviation.
-0.003 -0.002 -0.001 0.000 0.001 0.002 0.003 0 10 20 30 40 50 60 70 80 90 100 x (m) r (x ) (m ) a) -0.010 -0.005 0.000 0.005 0.010 0 10 20 30 40 50 60 70 80 90 100x (m) r (x ) (m ) b)
Figure 2: Track superelevation irregularities profiles with wavelengths range: a) D1 and b) D2.
Special attention should be paid to short wavelength defects, D1, which, although unlikely, can become dangerous when their amplitude is high.
3.2 Results on the bridge
When a dynamic analysis is made, a series of speeds up to the maximum design speed must be considered. The maximum design speed is 1,2 times the maximum live speed at the site. Calculations were made for speeds in the interval [140, 300] km/h with a step of about 5 km/h. A smaller step was adopted around the resonant speeds.
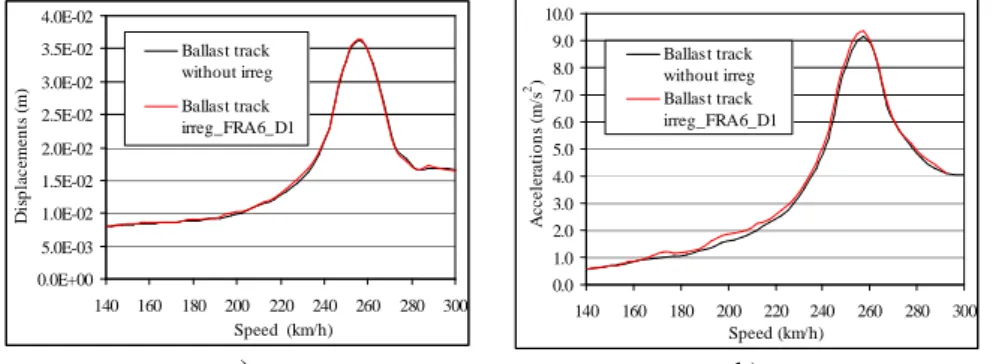
Considering the different profiles of irregularities, the displacements and accelerations were computed and the maximum values plotted against the speed. As it can be seen in Figure 3 and Figure 4, the responses of the bridge appear that track irregularities have a greater effect on deck accelerations than on dynamic deflections. For speeds below 200 km/h, the response of the bridge for the irregularities with wavelength D1 are more critical than the irregularities with wavelength D2. At resonance, the values for both situations are very similar, see
also Figure 5. Based on the maximum deflection and acceleration of the bridge at mid-span, values of the parameters φ"cal and φ"accl cal representing the increase in the
deflection and in the acceleration due to the track irregularities can be calculated at different speeds by the expressions (4) and (5):
0.0E+00 5.0E-03 1.0E-02 1.5E-02 2.0E-02 2.5E-02 3.0E-02 3.5E-02 4.0E-02 140 160 180 200 220 240 260 280 300 Speed (km/h) D is p la c e m e n ts ( m ) Ballast track without irreg Ballast track irreg_FRA6_D1 a) 0.0 1.0 2.0 3.0 4.0 5.0 6.0 7.0 8.0 9.0 10.0 140 160 180 200 220 240 260 280 300 Speed (km/h) A cc e le ra ti o n s (m /s 2 ) Ballast track without irreg Ballast track irreg_FRA6_D1 b)
Figure 3: Comparison of the maximum response of the bridge taken the wavelength range D1: a) Displacements; b) Accelerations.
0.0E+00 5.0E-03 1.0E-02 1.5E-02 2.0E-02 2.5E-02 3.0E-02 3.5E-02 4.0E-02 140 160 180 200 220 240 260 280 300 Speed (km/h) D is p la c e m e n ts ( m ) Ballast track without irreg Ballast track irreg_FRA6_D2 a) 0.0 1.0 2.0 3.0 4.0 5.0 6.0 7.0 8.0 9.0 10.0 140 160 180 200 220 240 260 280 300 Speed (km/h) A c c el e ra ti o n s (m /s 2 )
Ballast track without irreg
Ballast track irreg_FRA6_D2
b)
Figure 4: Comparison of the maximum response of the bridge taken the wavelength range D2: a) Displacements; b) Accelerations.
-0.100 -0.050 0.000 0.050 0.100 0.150 0.200 0.250 140 160 180 200 220 240 260 280 300 Speed (km/h) φ''accl cal φ''cal a) -0.200 -0.150 -0.100 -0.050 0.000 0.050 0.100 0.150 0.200 140 160 180 200 220 240 260 280 300 Speed (km/h) φ''accl cal φ''cal b)
Figure 5: Comparison of the maximum response of the bridge taken: a) the wavelength range D1; b) the wavelength range D2.
δmáx,irre is the maximum deflection of the beam at mid span with irregularities and δmáx, is maximum deflection of the beam at mid-span without irregularities.
máx,irre '' cal máx 1 δ ϕ = − δ (4) máx,irre '' accl cal máx a 1 a ϕ = − (5)
amáx,irre is the maximum acceleration of the beam at mid span with irregularities and
amáx, is maximum acceleration of the beam at mid-span without irregularities.
3.3 Results on the ballast
0.0 1.0 2.0 3.0 4.0 5.0 6.0 7.0 8.0 9.0 10.0 140 160 180 200 220 240 260 280 300 Velocidade (km/h) A ce le ra ç õ es ( m /s 2) Ballast without irreg Balast irreg_FRA6_D1 a) 0.0 1.0 2.0 3.0 4.0 5.0 6.0 7.0 8.0 9.0 10.0 140 160 180 200 220 240 260 280 300 Velocidade (km/h) A c e le ra ç õ es ( m /s 2) Ballast without irreg Ballast irreg_FRA6_D2 b)
Figure 6: Maximum acceleration response of the ballast taken: a) the wavelength range D1; b) the wavelength range D2.
The Figure 6 represents the maximum accelerations on the ballast mass of the railway track at the mid-span of the bridge. The response of the ballast on the resonance of the bridge is very similar for both situations, but for speeds lowers than 220 km/h the irregularities with the wavelength range D2 leads to higher accelerations.
3.4 Results on the normal contact force between rail and wheel
Figure 7 represents the comparison between the maximum and minimum values obtained for the normal contact forces of the fourth wheel of the ICE2 train, for the different situations analysed: the perfect railway track, irregularities with wavelength range D1and irregularities with wavelength range D2. The vertical contact between wheel and rail has been modelled with a spring according the Hertz theory [8]. The consideration of irregularities leads to higher and lower values on the normal contact forces between the rail and the wheel than those obtained for the perfect railway track. It can also be concluded, for the perfect railway, that the normal contact forces increase as the speed of the train increases, but for the railway with random irregularities this behaviour is not observed: the maximum difference happens for speeds between 180 km/h and 257.5 km/h, the resonance speed of the bridge, mainly for the irregularities with wavelength range D2.
50 75 100 125 150 175 200 225 250 275 300 325 350 375 400 425 140 160 180 200 220 240 260 280 300 Speed (Km/h) N o rm al c o n ta ct f o rc e (k N ) M ax CF withou irreg M in CF withou irreg M ax CF_irreg_FRA6_D1 M in CF_irreg_FRA6_D1 M ax CF_irreg_FRA6_D2 M in CF_irreg_FRA6_D2 a)
Figure 7: Comparison between the maximum and minimum values of normal contact forces of the 4th wheel of the train ICE2.
3.5 Results on sprung mass of the vehicle
Figure 8 represents the comparison between the maximum vertical accelerations on the sprung mass of the fourth axle of the train for the different situations analysed. The comfort criteria depend on the vertical accelerations inside the coach during the passage over the bridge. The level of comfort is associated to limiting values for the vertical accelerations given in [9]. A very good level is associated to a maximum acceleration equal to 1.0 m/s2, a good level equal to 1.3 m/s2 and an acceptable level equal to 2 m/s2. For the perfect railway, the vertical accelerations increase as the speed of the train increases, for a speed lower than 180 km/h the level of the comfort is very good and for speeds greater then 265 km/h the level of comfort is smaller than the acceptable.
0.0 0.5 1.0 1.5 2.0 2.5 3.0 3.5 4.0 140 150 160 170 180 190 200 210 220 230 240 250 260 270 280 290 300 Speed (km/h) A c c e le ra ti o n s (m /s 2 ) Perfect railway
Very good level of confort Good level of confort Acceptable level of confort irreg_FRA 6_D1 irreg_FRA 6_D2 a)
Figure 8: Comparison between the maximum and minimum values of normal contact forces of the 4th wheel of the train ICE2.
When the wavelength range D1 is considered, it can be observed that the level of comfort on the vehicle decreases, and corresponds to the acceptable level. For speeds greater then 265 km/h the level of comfort is less than acceptable. The consideration of the irregularities with the wavelength range D2 establish vertical accelerations, on the forth sprung mass, greater then 2 m/s2, so the level of comfort is always less than acceptable.
4 Conclusions
Several researchers and railway institutions have studied the influence of the irregularities on the dynamic behaviour of the system vehicle/ballast track/bridge, for example [4] and [6]. In this paper the response on the several elements of the vehicle/ballast track/bridge system is analysed. For that we have considered track superelevation irregularities, implemented on the rail, defined as random variables with an appropriate amplitude and wavelengths. The cases considered correspond to short wavelength D1, 3≤λ≤25 m, and D2, 25≤λ≤70 m. The amplitude was defined as the maximum that would trigger the alarm limits in order to be limited by maintenance action.
The response of the bridge allows to conclude that track irregularities have more effect on deck accelerations than on deflections, specially for speeds lower than 220 km/h. On the resonance response the values for both situations are similar to those obtained for the perfect railway. This conclusion is valid on the response of the ballast mass, but here, is observed the consideration of the irregularities with the wavelength range D2 is more adverse than the irregularities with the wavelength range D1.
The normal contact forces between the wheel and the rail is analysed too and it can be concluded that the consideration of irregularities establishes higher and lower values on the normal contact forces between the rail and the wheel than those obtained for the perfect railway track. Although for the perfect railway, the normal contact forces increase as the speed of the train increases, for the railway with random irregularities this behaviour is not valid, as the maximum difference happens for speeds between 180 km/h and 257.5 km/h, the resonance speed of the bridge, mainly for the for the irregularities with wavelength range D2.
In terms of the comfort level, the consideration of irregularities decrease the level of the comfort determined for the perfect railway. The irregularities with wavelength range D2 establish very high vertical accelerations on the fourth sprung mass of the train, conducting to a level of comfort lower than the acceptable level. The irregularities with wavelength range D1 determine values of vertical accelerations corresponding to the acceptable level in all dynamic analysis. According to these results it can stated that although the bridge shows some sensitivity to the presence of irregularities on the railway track, the critical behaviour seems to happen on the ballast, on the normal contact forces between the wheel and the rail and on the vertical acceleration of the sprung mass. For this bridge, the traffic safety and the passenger comfort are influenced by the presence of irregularities, even for irregularities where the alert limit is defined.
References
[1] EN1991-2, “Actions on structures – Part 2: General actions – Traffic loads on Bridges”, European Committee for Standardization, CEN, 2003.
[2] EN13848-5 Railway applications-Track- Track geometry quality – Part 5: Geometry quality levels,European Committee for Standardization, CEN, 2008.
[3] ERRI D214/RP5, “Railway bridges for speeds > 200km/h, Numerical Investigations of the effect of track irregularities at bridge resonance, European Rail Research Institute, Railway Technical Publications, 1999.
[4] Fryba L., “Dynamics of Railway Bridges”. Thomas Telford, 1996.
[5] Man A., “A Survey of Dynamic Railway Track Properties and Their Quality”, PhD. Thesis, Technische Universiteit Delft, DUP – Science, Delft University Press, 2002. [6] Yang Y.B., Yau J.D., Wu Y.S., Bridge Interactions Dynamics with Applications to
High-Speed Railways. World Scientific, 2004.
[7] Rebelo C., Simões da Silva L., Rigueiro C., Pircher M., “Dynamic behaviour of twin single-span ballasted railway viaducts – Fields measurements and modal identification”, Engineering Structures, 30(9), 2460-2469 (2008), doi: 10.1016/j.engstruct.2008.01.023.
[8] Esveld C., “Modern Railway track”, MRT – Productions, 1989.
[9] EN1990-Annex A2, “Basis of structural design – Annex A2 – Application for bridges (normative)”, European Committee for Standardization, CEN, 2005.