Contents lists available atScienceDirect
Journal of Environmental Management
journal homepage:www.elsevier.com/locate/jenvmanResearch article
Quantitative forecasting black (pyrogenic) carbon in soils by chemometric
analysis of infrared spectra
José M. De la Rosa
a,1, Marco A. Jiménez-González
b,∗,1, Nicasio T. Jiménez-Morillo
c,d,
Heike Knicker
a, Gonzalo Almendros
baInstituto de Recursos Naturales y Agrobiología de Sevilla, Consejo Superior de Investigaciones Científicas (IRNAS-CSIC), Reina Mercedes Av., 10, 41012, Seville, Spain bMuseo Nacional de Ciencias Naturales, Consejo Superior de Investigaciones Científicas (MNCN-CSIC), Serrano 115B, 28006, Madrid, Spain
cHercules Laboratory, University of Évora, Largo Marquês do Vimioso, 8, 7000-809, Évora, Portugal
dICAAM - Instituto de Ciências Agrárias e Ambientais Mediterrânicas, IIFA, Universidade de Évora, Núcleo da Mitra, Ap. 94, 7006-554, Évora, Portugal
A R T I C L E I N F O
Keywords: Carbon stabilization Black carbon
Partial least squares regression
A B S T R A C T
A detailed and global quantitative assessment of the distribution of pyrogenic carbon (PyC) in soils remains unaccounted due to the current lack of unbiased methods for its routine quantification in environmental sam-ples. Conventional oxidation with potassium dichromate has been reported as a useful approach for the de-termination of recalcitrant C in soils. However, its inaccuracy due to the presence of residual non-polar but still non-PyC requires additional analysis by13C solid-state nuclear magnetic resonance (NMR) spectroscopy, which is expensive and time consuming. The goal of this work is to examine the possibility of applying infrared (IR) spectroscopy as a potential alternative. Different soil type samples (paddy soil, Histic Humaquept, Leptosol and Cambisol) have been used. The soils were digested with potassium dichromate to determine the PyC content in environmental samples. Partial Least Squares (PLS) regression was used to build calibration models to predict PyC from IR spectra. A set of artificially produced samples rich in PyC was used as reference to observe in detail the IR bands derived from aromatic structures resistant to dichromate oxidation, representing black carbon. The results showed successful PLS forecasting of PyC in the different samples by using spectra in the 1800–400 cm−1 range. This lead to significant (P < 0.05) cross-validation coefficients for PyC, determined as the aryl C content of the oxidized residue. The Variable Importance for Projection (VIP) traces for the corresponding PLS regression models plotted in the whole IR range indicates the extent to which each IR band contributes to explain the aryl C and PyC contents. In fact, forecasting PyC in soils requires information from several IR regions. In addition to the expected IR bands corresponding to aryl C, other bands are informing about the patterns of oxygen-containing functional groups and the mineralogical composition characteristic of the soils with greater black carbon storage capacity. The VIP traces of the charred biomass samples confirm that aromatic bands (1620 and 1510 cm−1) are the most important in the prediction model for PyC-rich samples. These facts suggest that the mid-IR spectro-scopy could be a potential tool to estimate the black carbon.
1. Introduction
Up to three different pools of soil organic matter (SOM) are typically distinguished in terms of its stability in environmental conditions, viz, labile, mid and strongly refractory (De la Rosa et al., 2008a; Poirier et al., 2000). The least labile fraction is abundant in pyrogenic C (PyC; also called charcoal or black carbon), which has been thermally altered and is expected to be highly resistant against chemical and biological degradation (Masiello and Druffel, 1998;Schmidt and Noack, 2000). Therefore, the PyC-containing soils are expected to represent an
important sink within the global C-cycle (De la Rosa et al., 2008b; Lasslop et al., 2019; Jones et al., 2019; Santin et al., 2016) and would therefore play a relevant role in the recent “4 per mil” initiative (https://www.4p1000.org), which recognizes the pivotal role of soil in carbon sequestration. In order to properly elucidate the impact of PyC in soil biogeochemical cycle, its accurate detection and quantification is essential. However, both local and global spatial distribution patterns of PyC in soils is still missing due to the current lack of reliable methods for its routine quantification in environmental samples. This problem is related to the fact that PyC represents a wide continuum and modern
https://doi.org/10.1016/j.jenvman.2019.109567
Received 17 June 2019; Received in revised form 21 August 2019; Accepted 10 September 2019 ∗Corresponding author.
E-mail address:majimenez@mncn.csic.es(M.A. Jiménez-González). 1Both authors contributed equally.
0301-4797/ © 2019 Elsevier Ltd. All rights reserved.
approaches are often restricted to the detection of compounds in a certain window of molecular range. A further problem is related to difficulties to distinguish at a molecular level between residues derived from unburnt sources (natural organic matter NOM) and PyC compo-nents. In fact, degradative techniques are often applied for their se-paration but most of them show limited selectivity. The alternative use of non-degradative methods, such as solid-state nuclear magnetic re-sonance (NMR) spectroscopy, results in spectra in which the signals of PyC and NOM are difficult to be distinguished in bulk samples. For this reason, current contents on PyC in soil may have been underestimated to a large extent in classical studies (De la Rosa et al., 2011). In fact, accurate quantification of PyC would provide data required for con-sistent modelling of soil C turnover as well as to properly assess the soil potential for C sequestration. Preliminary intercomparative studies re-ported that a combination of several complementary analytical tools is essential to detect the whole continuum of combustion products (De la Rosa et al., 2011; Hammes et al., 2007; Leng et al., 2019).
In order to circumvent this problem, a simple wet chemical oxida-tion method with 0.1M potassium dichromate has been suggested for isolating PyC in soils (Knicker et al., 2007). Nevertheless, due to the fact that non-polar compounds such as lipids derived from NOM are not completely degraded by the chemical oxidation and thus remain in the nonhydrolyzable residue, the accurate quantification of PyC requires further application of solid-state 13C nuclear magnetic resonance (NMR) spectroscopy to the oxidation residue. With this approach, the abundance of PyC is calculated from the relative signal area of the13C
NMR aromatic C region of oxidation residue spectrum, which is referred to the total C in the untreated soil after the application of a correction factor. This experimental approach takes into account that polar groups (phenols or carboxylic aromatic residues) are attacked by the acid (Knicker et al., 2007). Nonetheless, considering the low availability of solid-state NMR spectrometer time which is also expensive alternatives are needed. Therefore, the present study is an attempt to routinely apply Fourier transform (FT) infrared (IR) spectroscopy to natural samples after chemical oxidation to assess the proportion of PyC.
Infrared spectroscopy is a non-destructive technique widely used for the structural characterization of SOM (Jiménez-González et al., 2019; Parolo et al., 2017; Terra et al., 2019). For general purposes, the re-lative intensity of IR spectral bands may be successfully used in che-mometric studies based on semi-quantitative data (Fernández-Getino et al., 2010; Sisouane et al., 2017). In fact, such data are valid to compare the intensity of the same band in different spectra, although not to compare proportions of different functional groups based on different bands in the same spectrum. A realistic alternative for the quantitative analysis of SOM components based in processing IR spectra is using suitable multivariate chemometric approaches (Russell et al., 2019). The partial least squares (PLS) regression, using the whole spectral data points as descriptors, is a more accurate method of ex-tracting underlying chemometric information from IR spectra, than simply digitizing large number of individual bands. Up to now, several attempts have been developed in bulk soil samples with contrasting outcomes.Zimmermann et al. (2007)demonstrated that the amount of chemically recalcitrant SOM after NaOCl oxidation could be predicted from IR spectroscopic data processed by multivariate data analyses such as PLS regression. Similar results were obtained byLeifeld (2006), who successfully predicted the alkyl and carboxyl C NMR intensities in SOM whereas the prediction of aromatic signals failed. At this point, the application of derivative spectroscopy may represent some improve-ment in avoiding subjective judgeimprove-ments in baseline tracing, required to obtain comparable data for peak intensities in series of spectra (Michaell, 1988; Hernández and Almendros, 2012). In addition, as we are particularly interested in the sources of information suitable to identify and quantify the resistant fraction of soil C, the IR spectra of the material resistant to oxidation are also analysed in terms of the Variable Importance for Projection (VIP) values of each spectral data point, calculated during the PLS modelling. This index informs on the
extent to which individual IR bands contribute to the PLS model, then illustrating soil components the concentration of which parallel that of the predicted dependant variable. Our hypothesis was that this ap-proach could be used as a rapid, non-expensive and unsupervised al-ternative to NMR spectroscopy to evaluate PyC contents in soils after wet chemical oxidation.
The main goal in this work is to quantitatively assess PyC content in soils and to examine the extent to which specific IR bands reflect the abundance of PyC. This method would be of importance to assess the potential of the soils to store black carbon. For this reason, spectral data points of IR spectra of 41 samples from 3 widely different soil types treated with potassium dichromate (independent variables) are pro-cessed in addition to dependent variables corresponding to i) carbon content, ii)13C NMR spectroscopy and iii) PyC abundance calculated according toKnicker et al. (2007). In addition, and in order to validate the prediction model of PyC in soils and to discern the origin of the bands corresponding to PyC, a supplementary set of seven PyC-rich samples produced by charring lignocellulosic plant materials under controlled conditions were incorporated to the study.
2. Materials and methods 2.1. Samples
Three sets of soils from different locations in addition to a collection of 7 samples of artificially charred biomass were selected for this study (Table 1). The three sets of previously characterized soils consisted of ancient paddy soils from the Yangtze River Delta (China) (Cao et al., 2006), Histic Humaquept soil from Doñana National Park (Huelva, Spain) and Leptosol and Cambisol from Sierra de Aznalcóllar (Seville, Spain) (World Reference Base for Soil Resources, 2014) (Knicker et al., 2013).
In addition, samples of casein and organosolv spruce lignin supplied by a pulp and paper plant in Kelheim (Germany) were charred in porcelain crucibles in a muffle oven at 350 °C and 450 °C for 4 min under oxic conditions (Knicker, 2010). Finally, two additional char samples were obtained under the same conditions from Lolium perenne grass and chips of pine wood heated for 4 min (Knicker et al., 2007). Further details for each sort of samples are shown in Table 1. All samples were dried (40 °C), homogenised and passed through a 2 mm mesh sieve before demineralization and chemical oxidation.
2.2. Demineralization and chemical oxidation
For demineralization, bulk soil samples were treated with hydro-fluoric acid (HF) according toGonçalves et al. (2003). Briefly, 10 g of sample was shaken with 50 cm3of 10% (w:w) HF for 12 h in
poly-ethylene bottles. After centrifugation, the supernatants were siphoned off and discarded. The procedure was repeated five times at room temperature. The remaining residue was washed with 50 cm3of
deio-nized water, freeze-dried and weighted.
Oxidation with acid solution of K2Cr2O7for PyC determination was
based onKnicker et al. (2007). About 300 mg HF-treated soils and the set of artificially charred materials was oxidized with 50 cm3of 0.1M
K2Cr2O7–2M H2SO4solution at 60 °C in an ultrasonic bath during 6 h in
duplicate. Thefinal residue was washed with deionized water, freeze-dried and weighted prior to elemental and spectroscopic analyses. 2.3. Total C analysis
Total C of bulk soil samples and its oxidized residues was measured in triplicate by dry combustion (975 °C) using an Elementar Vario EL microanalyzer detecting N as N2and C as CO2. Detection limits for C
and N were 0.4 and 1μg, respectively. The maximum standard devia-tion was 7% for C and 5% for N.
2.4. Solid-state13C-NMR spectroscopy
Solid-state13C cross polarization-magic angle spinning (CP-MAS)
NMR spectra of the samples were recorded with a Bruker Avance III 200 MHz instrument (Bruker Instruments, Billerica, Massachusetts, USA), using ZrO2rotors of 4 mm o.d. Magic angle spinning (MAS) was
applied at 6.8 kHz during cross polarization (CP) for 13C. The 13C
chemical shifts are referenced to tetramethylsilane and adjusted with glycine. A contact time of 1 ms and a pulse delay of 500 ms were used. For each sample between 10,000 and 200,000 FIDs were accumulated to increase the signal/noise ratio of the NMR spectra. The spectra were integrated into six chemical shift regions: alkyl C (0–45 ppm); N-alkyl/ methoxyl C (45–60 ppm); O-alkyl C (60–90 ppm); aryl C (90–140 ppm); O-aryl C (140–160 ppm); carbonyl/amide C (160–250 ppm). The Bruker WinNMR software was used to measure peak areas.
2.5. Fourier Transform-IR spectroscopy
Fourier transform-infrared spectra were obtained using a JASCO 4100 spectrometer (Jasco Corporation, Tokio, Japan) at a wavelength range of 4000–400 cm−1and a resolution of 2 cm−1. Potassium
bro-mide pellets containing 2 mg of powdered sample and 200 mg of KBr were scanned. In order to improve the signal to noise ratio, 60 spectra were co-added and averaged for each recorded spectrum. Spectral data were background corrected to a reference spectrum prior to every measurement and some spurious absorptions, such as peaks from at-mospheric CO2were removed.
2.6. Statistical analyses
Partial least squares regression models were carried out by using the ParLeS software (Viscarra-Rossel, 2008). This program was used to obtain prediction models for each of the dependent variables (viz, PyC, aryl C region and alkyl C region of NMR) from the information con-tained in independent variables consisting of arrays with the spectral intensities in the range 1800–400 cm−1(116 data points). Prior to PLS
regression, the spectral pre-processing treatments available in the pro-gram ParLeS were checked, tofinally select: a) light scatter and baseline correction by Standard Noise Variate (SNV), b) de-noising with a medianfilter rank of 2, and c) 2nd derivative transformation. Mean centering was also selected as further data pretreatment before PLS analysis. To select the best number of latent variables for each model, in order to prevent overfitting, the root mean squared error (RMSE) and the Akaike's information criterion (Akaike, 1974) were used. In addi-tion, the selected PLS models were validated by a stricter criterion consisting of comparing the PLS cross-validation tests (observed vs calculated) with those performed with the same number of latent variables and the same matrix of independent variables but after random permutation of the data of the dependent variable (i.e., checking that no significant (P < 0.01) cross validation plot is ob-tained with the randomized values (Supplementary Fig. 1). Finally, for the significant PLS model selected, the diagnostic spectral regions of the IR spectra were studied by plotting the VIP values in the 1800–400 cm−1
spectral range studied. These VIP traces are considered to reflect quantitatively the contribution of each independent variable to the prediction model, then they can be useful to identify which spectral peaks may be acting as surrogates of the concentration in the soil of the dependent variable under study.
3. Results and discussion
3.1. Carbon content and calculation of PyC by13C NMR spectroscopy
The PyC content was calculated for all samples by multiplying the relative intensity of the aryl C region of the13C NMR spectra with the
organic carbon (OC) content after acid oxidation with potassium
Table 1 General characteristics of the samples studied. Label Type Number of samples Location Depth range Other relevant information Paddy_S Paddy soil 14 Yangtze River Delta (China) 0– 190 cm Neolithic soils with a record of frequent fi res ( Cao et al., 2006; Knicker, 2007 ) Doñana_S Histic Humaquept 13 Doñana National Park (SW, Spain) 0– 50 cm Sandy acids soils covered mainly by bushes taken 1-to-24 years after severe wild fi res and from una ff ected sites Aznalcóllar_S Leptosols and Cambisol 14 Sierra de Aznalcóllar Park (S, Spain) 0– 30 cm Soils under Pinus and Quercus burned in the last 25 years ( Knicker et al., 2013; López-Martín et al., 2018 ) Py_M Pyrogenic C rich material arti fi cially produced 7 Charring performed in a mu ffl e oven at 350 and 450 °C during 4 or 8 min
dichromate of the samples (Table 2). As expected, both thefinal weight of non-degraded residue after dichromate oxidation and the13C NMR
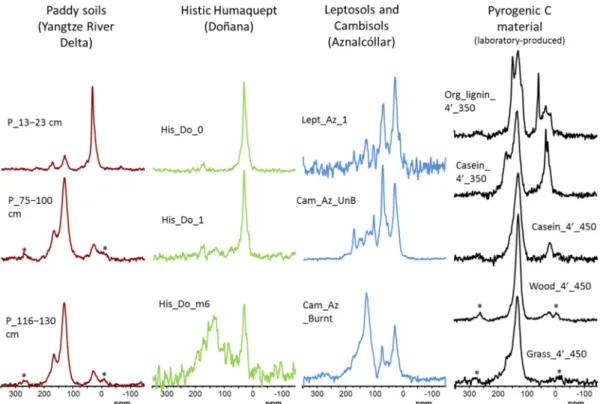
signal area for aryl C varied widely depending on the origin of the samples. Residues of the topsoil samples from burned sites reached up to 65% of aryl C, which accounts for over 20% of PyC. In contrast, the samples from horizons below 30–40 cm depth of the unburnt sandy soils resulted in aryl C contents≤ 20% and extremely low amounts of PyC (0–4%). Fig. 1 shows 13C NMR spectra of selected samples
re-presentative from each set of samples. Individually, the three sorts of soils also display a wide range of aromaticity. Another aspect shown by the13C NMR spectra is that SOM of alkyl nature is also resistant to the
dichromate oxidation under the conditions used (Knicker et al., 2007), which confirms the need to discriminate the aromatic fraction in order to achieve a reliable assessment of PyC in soils. The laboratory-charred C-rich samples show a high aromaticity (> 50% of total C), as expected from the origin of the samples, prepared to obtain materials re-presenting the most common sources of pyrogenic organic matter in soils.
3.2. IR spectroscopy and PLS analysis
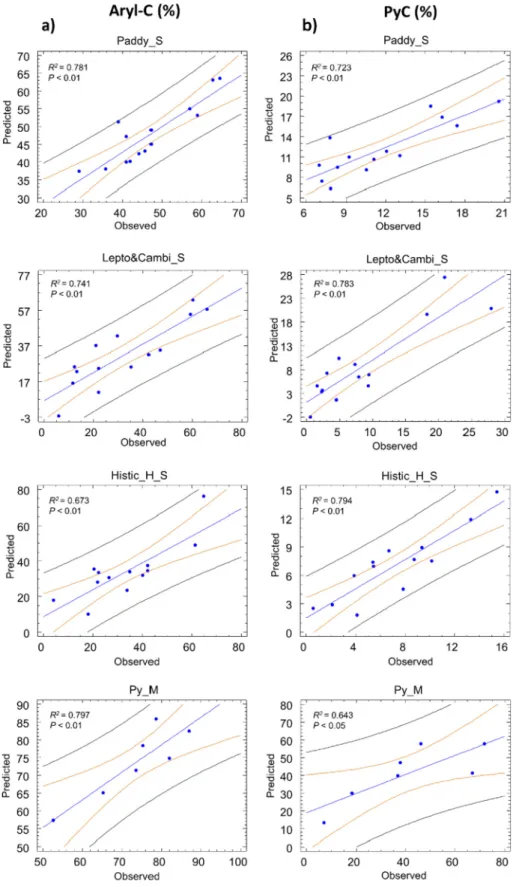
Fig. 2displays the cross validation plots (linear regression between predicted and observed values) for the aromaticity and PyC content of each set of samples.Fig. 2a illustrates the possibility of predicting sig-nificantly the concentration of aryl C as determined by 13
C NMR spectroscopy, using exclusively the information contained in the 1800–400 cm−1range of IR spectra from the dichromate-oxidized
re-sidues. The PLS models successfully predicted the percentages of aryl C in all sets of soils. The less significant prediction was for Histic Hu-maquept sandy soil (R2= 0.67; P < 0.05). This is probably related to
its comparatively low organic C content (< 1%) and the possible in-terferences due to the heterogeneous mineral fraction. In the same way, the application of this IR approach also leads to significant prediction of PyC (Fig. 2b). In an attempt to extend the applicability of the model and considering the presence of SOM of alkyl nature resistant to degrada-tion,Fig. 3shows the correlation between the independent variables measured by IR and the relative abundance of alkyl C of each sample measured by 13C NMR spectroscopy. The regression coefficients Table 2
Analytical characteristics determined in the samples.
Samples Carbon content of bulk samples (%; Ci)
Yield (material after oxidation; %)
Carbon content after oxidation (%) C yield (% of Ci) Aryl C (13C NMR sp; %) Alkyl C (13C NMR sp; %) PyC (%) from total Doñana_S1 6.4 87.0 1.5 20.5 26.6 46.8 5.5 Doñana_S2 2.7 93.0 0.6 21.7 40.3 35.6 8.7 Doñana_S3 8.0 87.0 2.1 22.7 18.1 65.2 4.1 Doñana_S4 3.3 95.0 0.9 24.2 22.4 56.0 5.4 Doñana_S5 1.8 98.0 0.4 24.1 42.3 36.1 10.2 Doñana_S6 1.0 100.0 0.2 21.6 61.5 16.8 13.3 Doñana_S7 4.3 86.0 0.5 10.2 20.6 45.0 2.1 Doñana_S8 1.5 97.0 0.4 22.2 42.3 30.5 9.4 Doñana_S9 0.4 100.0 0.1 23.8 64.8 18.7 15.4 Doñana_S10 29.3 43.0 9.0 13.2 4.0 80.2 0.5 Doñana_S11 4.1 91.0 0.8 17.6 22.0 57.9 3.9 Doñana_S12 1.8 95.0 0.4 19.1 35.0 38.5 6.7 Doñana_S13 2.1 96.0 0.5 23.1 34.0 44.1 7.8 Paddy_S1 8.7 25.0 6.9 19.9 39.0 30.8 7.8 Paddy_S2 7.1 26.0 7.8 28.6 57.0 14.3 16.3 Paddy_S3 19.7 36.0 16.2 29.6 59.0 21.6 17.4 Paddy_S4 11.9 32.0 10.9 29.5 41.0 38.1 12.1 Paddy_S5 3.7 13.0 5.8 20.4 41.0 38.1 8.3 Paddy_S6 16.7 25.0 18.0 24.0 29.0 14.2 7.0 Paddy_S7 2.7 27.0 5.0 17.0 42.0 10.6 7.1 Paddy_S8 19.7 31.0 20.2 31.9 64.7 9.6 20.6 Paddy_S9 4.1 13.0 6.9 21.8 35.8 34.5 7.8 Paddy_S10 13.8 25.0 10.8 19.6 47.2 25.3 9.2 Paddy_S11 7.4 24.0 8.5 27.7 47.2 25.3 13.1 Paddy_S12 6.4 26.0 6.0 24.3 45.8 16.7 11.1 Paddy_S13 5.9 23.0 6.1 23.8 44.2 24.7 10.5 Paddy_S14 13.4 24.0 13.7 24.6 62.8 10.6 15.4 Aznalcóllar_S1 18.0 60.0 27.1 42.4 66.0 10.3 28.0 Aznalcóllar_S2 11.3 56.0 19.7 30.8 59.3 15.3 18.3 Aznalcóllar_S3 12.8 47.2 19.0 34.7 60.3 20.4 20.9 Aznalcóllar_S4 1.4 29.6 15.4 7.2 22.2 54.3 1.6 Aznalcóllar_S5 7.3 31.6 20.4 26.4 35.3 35.0 9.3 Aznalcóllar_S6 8.1 24.0 16.5 24.8 12.3 58.4 3.0 Aznalcóllar_S7 6.7 26.6 21.6 19.4 11.7 65.5 2.3 Aznalcóllar_S8 5.3 32.8 18.5 20.1 46.9 35.1 9.4 Aznalcóllar_S9 7.1 28.6 18.0 24.6 29.7 47.3 7.3 Aznalcóllar_S10 5.3 38.9 17.0 18.6 42.5 37.6 7.9 Aznalcóllar_S11 5.2 8.9 25.8 9.1 5.9 70.2 0.5 Aznalcóllar_S12 7.0 18.7 16.9 17.6 13.3 55.9 2.3 Aznalcóllar_S13 5.9 25.7 15.2 23.1 21.0 49.5 4.9 Aznalcóllar_S14 4.6 29.6 11.5 20.2 22.1 59.2 4.5 Py_M1 65.8 17.4 50.5 13.3 52.6 23.4 7.0 Py_M2 62.9 86.6 59.4 81.7 82.0 9.9 67.0 Py_M3 47.0 24.2 48.4 24.9 73.6 8.4 18.3 Py_M4 30.7 34.0 45.5 50.3 75.4 0.0 37.9 Py_M5 57.2 55.4 60.9 58.9 78.6 3.2 46.3 Py_M6 66.2 55.8 67.1 56.5 65.3 17.1 36.9 Py_M7 64.3 77.0 69.0 82.6 87.0 6.9 71.9
between the observed and predicted values were significant (R2≥ 0.74;
P < 0.05) in all cases except for the paddy soils, this fact could be due to the low variability of alkyl-C in this soils. Whereas soils from Doñana and Aznalcóllar showed proportions of alkyl C ranging between 30 to 80% and 20–70%, respectively, the paddy soil showed values between 20 and 40%.
3.3. IR spectra and importance for PyC prediction
The considerable differences in the environmental factors involved in the accumulation of SOM in the studied soils must necessarily result in wide diversity in the concentration and composition of the re-calcitrant C forms. In this scenario, it is presumable that specific soil features are playing a key role in the preservation of the SOM as PyC intergrades. This could be examined by taking advantage of the VIP values calculated during the PLS.Fig. 4shows the VIP traces for the different dependent variables. Such traces inform on the extent to which the different IR peaks contributed to the prediction of PyC and aryl C for each set of samples. This figure shows that the most de-terminant IR bands for predicting the aromaticity of the residue or its PyC content vary according to the type of soil, or the origin of the charred samples. It was also observed that the VIP pattern, calculated during the prediction of PyC and aryl C are very similar, which could be due to the close relationship between these two variables. While in the set of samples of pyrogenic-rich material the most important bands were found at ca. 1700–1750 cm−1 (acid and ester structures) and
1600–1640 cm−1
(aromatic and amide structures), the lowest im-portance was found in bands 1420, 1350 and 1230 cm−1 which are characteristic of the lignin pattern frequently found in the IR spectra of slightly humified SOM (Fengel and Wegener, 1984; Miralles et al., 2007).
In the case of the ancient paddy soil from China it seems that the prediction of the aromaticity of the digested material derives mainly from the IR bands ca. 1000–1100 cm−1, 440–500 cm−1 and
1620–1690 cm−1, whereas the prediction of the PyC and aryl C values
of the sandy soils from Doñana was essentially described by the broad
band system between 1000 and 1100 cm−1and to a lesser extent by 440, 650, 750 and 1640 cm−1. A similar outcome was observed for the spectra from Leptosols/Cambisols of Aznalcóllar, dominated by bands over 440 and 500 cm−1. These bands are typically attributed to Si-O, Fe-O and/or Al-O groups in bulk soils, then suggesting a mineralogical control of PyC stabilization in soils. These results suggest that the dif-ferent soil nature and mineral composition play an important role in relation to what SOM fraction is associated with the presence of the PyC, maybe due to some organo-mineral interactions. For instance, in paddy soils the most differential predictor peaks (diagnostic region) for the PyC corresponded to bands attributed to carboxyl groups, aromatic structures and bands associated to minerals, whereas among Leptosol, Cambisol and Histic soils, the most differential ones correspond to minerals bands and to a lesser extent to carboxyl and aromatic bands. These differences in the association between PyC and SOM can be due to a contrasting origin of the PyC or different degree of transformation.
4. Conclusions
This study demonstrates that a prediction model based on PLS re-gression and on the information contained in the IR spectra is able to forecast the PyC content of contrasting soils and of artificially charred biomass. This approach showed its best predicting potential for soils with organic C concentrations greater than 1%. The VIP values of the IR spectra show that forecasting PyC in soils requires information from several IR regions in a way that, in general, none of which shows a primary importance. In general, the most important bands for the prediction in the spectra from soils correspond to minerals resistant to demineralizing treatments under the conditions used and to a lesser extent to carboxyl and aromatic bands. This contrast with the case of artificially charred biomass which was used as reference for PyC rich samples where, as expected, aromatic bands centered at 1620 and 1510 cm−1play a relevant role for the assessment of stable C in soils. Fig. 1. Solid state13C NMR spectra of potassium dichromate-treated samples representative for the different sets of soils: Paddy soils (brown), Histic Humaquept (green), Leptosols and Cambisols (blue) and of the laboratory-produced pyrogenic materials (black). Spinning side bands are indicated with asterisks (*).
Acknowledgements
José M. De la Rosa and Marco A. Jiménez-González thank the Spanish Ministry of Economy and Competitiveness (MINECO, Spain) for funding the“Ramón y Cajal” post-doctoral contract (RYC2014-16338)
and the pre-doctoral FPI fellowship (BES-2014-069238) respectively. Nicasio T. Jiménez-Morillo was funded by the scholarship PosDoc/Por 3O/OUT17 (FCT, Portugal).
Fig. 2. Cross validation plots between observed and predicted values obtained by partial least squares regression using data from the infrared spectral range (1800–400 cm−1) to predict a) aryl C content calculated by13C NMR spectroscopy and b) pyrogenic carbon content of soils (paddy soils, Histic Humaquept, Leptosols and Cambisols) and of laboratory-charred lignocellulosic biomass (Py_M).
Appendix A. Supplementary data
Supplementary data to this article can be found online athttps:// doi.org/10.1016/j.jenvman.2019.109567.
References
Akaike, H., 1974. A new look at the statistical model identification. IEEE Trans. Autom. Control 19, 716–723.https://doi.org/10.1007/978-1-4612-1694-0_16.
Cao, Z., Ding, J., Hu, Z., Knicker, H., Kögel-Knabner, I., Yang, L., Yin, R., Lin, X., Dong, Y., 2006. Ancient paddy soils from the neolithic age in China's Yangtze River Delta.
Fig. 3. Cross-validation plots between observed and predicted values obtained by partial least squares (PLS) regression using data from the infrared spectral range (1800–400 cm−1) to predict the alkyl C content independently calculated by13C NMR spectroscopy of soils (paddy soils, Histic Humaquept, Leptosols and Cambisols) and of laboratory-charred lignocellulosic biomass (Py_M).
Fig. 4. Average IR spectra (red trace) and Variable Importance for Projection (VIP) of the different spectral points (bar plot) obtained in the partial least squares (PLS) models for a) aryl C content calculated by13C NMR spectroscopy and b) pyrogenic carbon content.
Naturwissenschaften 93, 232–236.https://doi.org/10.1007/s00114-006-0083-4. De la Rosa, J.M., Knicker, H., López-Capel, E., Manning, D.A.C., González-Pérez, J.A.,
González-Vila, F.J., 2008a. Direct detection of black carbon in soils by Py-GC/MS, carbon-13 NMR spectroscopy and thermogravimetric techniques. Soil Sci. Soc. Am. J. 72, 258–266.https://doi.org/10.2136/sssaj2007.0031.
De la Rosa, J.M., González-Pérez, J.A., Hatcher, P.G., Knicker, H., González-Vila, F.J., 2008b. Determination of refractory organic matter in marine sediments by chemical oxidation, analytical pyrolysis and solid-state13C nuclear magnetic resonance
spec-troscopy. Eur. J. Soil Sci. 59, 430–438.https://doi.org/10.1111/j.1365-2389.2007. 00979.x.
De La Rosa, J.M., Sánchez García, L., de Andrés, J.R., González-Vila, F.J., González-Pérez, J.A., Knicker, H., 2011. Contribution of black carbon in recent sediments of the Gulf of Cadiz. Applicability of different quantification methodologies. Quat. Int. 243, 264–272.https://doi.org/10.1016/j.quaint.2011.01.034.
Fengel, D., Wegener, G., 1984. Wood, Chemistry, Ultrastructure, Reactions. De Gruyter, New York, pp. 613.
Fernández-Getino, A.P., Hernández, Z., Piedra Buena, A., Almendros, G., 2013. Exploratory analysis of the structural variability of forest soil humic acids based on multivariate processing of infrared spectral data. Eur. J. Soil Sci. 64, 66–79.https:// doi.org/10.1111/ejss.12016.
Gonçalves, C.N., Dalmolin, R.S.D., Dick, D.P., Knicker, H., Klamt, E., Kögel-Knabner, I., 2003. The effect of 10% HF treatment on the resolution of CPMAS13C NMR spectra
and on the quality of organic matter in Ferralsols. Geoderma 116, 373–392.https:// doi.org/10.1016/S0016-7061(03)00119-8.
Hammes, K., Schmidt, M.W.I., Smernik, R.J., Currie, L.A., Ball, W.P., Nguyen, T.H., Louchouarn, P., Houel, S., Gustafsson, O., Elmquist, M., Cornelissen, G., Skjemstad, J.O., Masiello, C.A., Song, J., Peng, P., Mitra, S., Dunn, J.C., Hatcher, P.G., Hockaday, W.C., Smith, D.M., Hartkopf‐Fröder, C., Böhmer, A., Lüer, B., Huebert, B.J., Amelung, W., Brodowski, S., Huang, L., Zhang, W., Gschwend, P.M., Flores‐Cervantes, D.X., Largeau, C., Rouzaud, J.-N., Rumpel, C., Guggenberger, G., Kaiser, K., Rodionov, A., Gonzalez‐Vila, F.J., Gonzalez‐Perez, J.A., De la Rosa, J.M., Manning, D.A.C., López‐Capél, E., Ding, L., 2007. Comparison of quantification methods to measure fire-derived (black/elemental) carbon in soils and sediments using reference mate-rials from soil, water, sediment and the atmosphere. Glob. Biogeochem. Cycles 21, GB3016.https://doi.org/10.1029/2006GB002914.
Hernández, Z., Almendros, G., 2012. Biogeochemical factors related with organic matter degradation and C storage in agricultural volcanic ash soils. Soil Biol. Biochem. 44, 130–142.https://doi.org/10.1016/j.soilbio.2011.08.009.
Jiménez-González, M.A., Álvarez, A.M., Carral, P., Almendros, G., 2019. Chemometric assessment of soil organic matter storage and quality from humic acid infrared spectra. Sci. Total Environ. 341, 1160–1168.https://doi.org/10.1016/j.scitotenv. 2019.06.231.
Jones, M.W., Santín, C., van der Werf, G.R., Doerr, S.H., 2019. Globalfire emissions buffered by the production of pyrogenic carbon (in press).https://doi.org/10.1038/ s41561-019-0403-x.
Knicker, H., 2007. How does char input affect the nature and stability of soil organic nitrogen and carbon?– a review. Biogeochemistry 85, 91–118.https://doi.org/10. 1007/s10533-007-9104-4.
Knicker, H., 2010. "Black nitrogen" - an important fraction in determining the recalci-trance of charcoal. Org. Geochem. 41, 947–950.https://doi.org/10.1016/j. orggeochem.2010.04.007.
Knicker, H., Müller, P., Hilscher, A., 2007. How useful is chemical oxidation with di-chromate for the determination of“Black Carbon” in fire-affected soils? Geoderma 142, 178–196.https://doi.org/10.1016/j.geoderma.2007.08.010.
Knicker, H., González-Vila, F.J., González-Vázquez, R., 2013. Biodegradability of organic matter infire-affected mineral soils of Southern Spain. Soil Biol. Biochem. 56, 31–39.
https://doi.org/10.1016/j.soilbio.2012.02.021.
Lasslop, G., Coppola, A.I., Voulgarakis, A., Yue, C., Veraverbeke, S., 2019. Influence of fire on the carbon cycle and climate. Curr. Clim. Change Rep. 5, 112–123.https:// doi.org/10.1007/s40641-019-00128-9.
Leifeld, J., 2006. Application of diffuse reflectance FT-IR spectroscopy and partial least squares regression to predict NMR properties of soil organic matter. Eur. J. Soil Sci. 57, 846–857.https://doi.org/10.1111/j.1365-2389.2005.00776.x.
Leng, L., Huang, H., Li, H., Li, J., Zhou, W., 2019. Biochar stability assessment methods: a review. Sci. Total Environ. 647, 210–222.https://doi.org/10.1016/j.scitotenv.2018. 07.402.
López-Martín, M., González-Vila, F.J., Knicker, H., 2018. Distribution of black carbon and black nitrogen in physical soil fractions from soils seven years after an intense forest fire and their role as C sink. Sci. Total Environ. 637–638, 1187–1196.https://doi. org/10.1016/j.scitotenv.2018.05.084.
Masiello, C.A., Druffel, E.R.M., 1998. Black carbon in deep-sea sediments. Science 280, 1911–1913.https://doi.org/10.1126/science.280.5371.1911.
Michaell, A.J., 1988. Second derivative F.T.-I.R. spectra of celluloses I and II and related mono- and oligosaccharides. Carbohydr. Res. 173, 185–195.
Miralles, I., Ortega, R., Sánchez-Marañon, M., Soriano, M., Almendros, G., 2007. Assessment of biogeochemical trends in soil organic matter sequestration in Mediterranean calcimorphic mountain soils (Almería, Southern Spain). Soil Biol. Biochem. 39, 2459–2470.https://doi.org/10.1016/j.soilbio.2007.04.017. Parolo, M.E., Savini, M.C., Loewy, R.M., 2017. Characterization of soil organic matter by
FT-IR spectroscopy and its relationship with chlorpyrifos sorption. J. Environ. Manag. 196, 316–322.https://doi.org/10.1016/j.jenvman.2017.03.018.
4 PER 1000https://www.4p1000.org/(accessed 5 August 2019).
Poirier, N., Derenne, S., Rouzaud, J.N., Largeau, C., Mariotti, A., Balesdent, J., Maquet, J., 2000. Chemical structure and sources of the macromolecular, resistant, organic fraction isolated from a forest soil (Lacadée, south-west France). Org. Geochem. 31, 813–827.https://doi.org/10.1016/S0146-6380(00)00067-X.
Russell, F.E., Boyle, J.F., Chiverrell, R.C., 2019. NIRS quantification of lake sediment composition by multiple regression using end-member spectra. J. Paleolimnol. 62, 73–88.https://doi.org/10.1007/s10933-019-00076-2.
Santín, C., Doerr, S.H., Kane, E.S., Masiello, C.A., Ohlson, M., Rosa, J.M., Preston, C.M., Dittmar, T., 2016. Towards a global assessment of pyrogenic carbon from vegetation fires. Glob. Chang. Biol. 22, 76–91.https://doi.org/10.1111/gcb.12985. Schmidt, M.W.I., Noack, A.G., 2000. Black carbon in soils and sediments: analysis,
dis-tribution, implications, and current challenges. Glob. Biogeochem. Cycles 14, 777–794.https://doi.org/10.1029/1999GB001208.
Sisouane, M., Cascant, M.M., Tahiri, S., Garrigues, S., El Krati, M., Boutchich, G.E.K., Cervera, M.L., de la Guardia, M., 2017. Prediction of organic carbon and total ni-trogen contents in organic wastes and their composts by infrared spectroscopy and partial least square regression. Talanta 167, 352–358.https://doi.org/10.1016/j. talanta.2017.02.034.
Terra, F.S., Viscarra Rossel, R.A., Demattê, J.A.M., 2019. Spectral fusion by outer product analysis (OPA) to improve predictions of soil organic C. Geoderma 335, 35–46.
https://doi.org/10.1016/j.geoderma.2018.08.005.
Viscarra Rossel, R.A., 2008. ParLeS: software for chemometric analysis of spectroscopic data. Chemometr. Intell. Lab. Syst. 90, 72–83.https://doi.org/10.1016/j.chemolab. 2007.06.006.
World Reference Base for Soil Resources, 2014. International Soil Classification System for Naming Soils and Creating Legends for Soil Maps. World Soil Resources Reports No. 106. FAO, Rome.
Zimmermann, M., Leifeld, J., Fuhrer, J., 2007. Quantifying soil organic carbon fractions by infrared-spectroscopy. Soil Biol. Biochem. 39, 224–231.https://doi.org/10.1016/ j.soilbio.2006.07.010.