EUROPEAN ORGANISATION FOR NUCLEAR RESEARCH (CERN)
CERN-PH-EP-2014-244
Submitted to: JHEP
Measurement of the
W W + W Z
cross section and limits on
anomalous triple gauge couplings using final states with one
lepton, missing transverse momentum, and two jets with the
ATLAS detector at
√
s = 7
TeV
The ATLAS Collaboration
Abstract
The production of a W boson decaying to eν or µν in association with a W or Z boson decaying to two jets is studied using 4.6 fb−1 of proton–proton collision data at√s = 7 TeV recorded with the ATLAS detector at the LHC. The combined W W +W Z cross section is measured with a significance of 3.4σand is found to be 68 ± 7 (stat.) ± 19 (syst.) pb, in agreement with the Standard Model expectation of 61.1 ± 2.2 pb. The distribution of the transverse momentum of the dijet system is used to set limits on anomalous contributions to the triple gauge coupling vertices and on parameters of an effective-field-theory model.
Prepared for submission to JHEP
Measurement of the W W + W Z cross section and
limits on anomalous triple gauge couplings using
final states with one lepton, missing transverse
momentum, and two jets with the ATLAS detector
at
√
s = 7 TeV
The ATLAS Collaboration
Abstract:
The production of a W boson decaying to eν or µν in association with a W or Z boson decaying to two jets is studied using 4.6 fb−1 of proton–proton collision data at√s = 7 TeV recorded with the ATLAS detector at the LHC. The combined W W + W Z cross section is measured with a significance of 3.4σ and is found to be 68 ± 7 (stat.) ± 19 (syst.) pb, in agreement with the Standard Model expectation of 61.1 ± 2.2 pb. The distribution of the transverse momentum of the dijet system is used to set limits on anomalous contributions to the triple gauge coupling vertices and on parameters of an effective-field-theory model.
Keywords: ATLAS, LHC, diboson, semileptonic, anomalous Triple Gauge Couplings
Contents
1 Introduction 1
2 Analysis strategy 2
3 The ATLAS detector 3
4 Simulated event samples 4
5 Object and event reconstruction 5
6 Event selection 7
7 Signal and background estimation 7
8 Cross-section definition and fit method 8
9 Systematic uncertainties 11
10 Cross-section results 13
11 Anomalous triple gauge couplings 14
12 Conclusion 23
1 Introduction
The study of vector boson pair production at the Large Hadron Collider (LHC) provides an important test of the electroweak sector of the Standard Model (SM) at the highest available energies. Deviations observed in the total or differential cross sections from the SM predictions may arise from anomalous triple gauge boson interactions [1] or from new particles decaying into vector bosons [2]. Vector boson pair production is also an important source of background in studies of the Higgs boson and in searches for signals of physics beyond the SM.
The cross sections for W W and W Z production at the LHC have previously been measured in fully leptonic final states [3–6]. The semileptonic final states suffer from larger backgrounds from W or Z boson production in association with jets, but benefit from significantly larger branching fractions than the fully leptonic states and thus represent important complementary measurements. In this paper the W W + W Z cross section is measured in the `νjj (` = e, µ) final state using a data sample of proton–proton (pp) collisions with an integrated luminosity of 4.6 fb−1 collected by the ATLAS detector at
the LHC. In addition, the reconstructed dijet transverse momentum distribution is used to set limits on anomalous contributions to the triple gauge coupling vertices (aTGCs), after requiring that the dijet invariant mass is close to the mass of the W or Z boson.
The combined W W +W Z production cross section (hereafter, W V cross section, where V = W, Z) has been measured in the `νjj final state in proton–antiproton collisions at the Tevatron collider by both the CDF [7] and D0 [8] collaborations, and more recently in pp collisions by the CMS [9] collaboration. Limits on anomalous triple gauge couplings in W V → `νjj production have also been presented by CDF [10], D0 [11], and CMS [9].
This paper is organised as follows. The overall analysis strategy is described in section2 and a short description of the ATLAS detector is given in section3. The Monte Carlo (MC) simulation used for the signal and background modelling is summarized in section4. Details of the object and event reconstruction and of the event selection are given in sections5and6 respectively. The method to estimate the signal and background processes is discussed in section 7. The cross section measurement is detailed in section 8 and the systematic uncertainties are described in section 9. The results of the cross-section measurement are summarized in section10, and the extraction of the anomalous triple gauge coupling limits is discussed in section11. Finally, conclusions are drawn in section12.
2 Analysis strategy
Candidate W V → `νjj events are required to contain exactly one lepton (electron or muon), large missing transverse momentum ETmiss, and exactly two jets. The selected events are accepted if they pass a set of kinematic cuts chosen to enhance the signal-to-background ratio. The invariant mass distribution of the two jets (mjj), representing the candidate decay products of the hadronically decaying boson, is obtained from all the selected events. The W W + W Z signal yield (NW V) is obtained by performing a binned maximum-likelihood fit to the mjj distribution using templates based on MC simulations. The fit is performed
on events in an mjj range much larger than the range where the signal peaks, allowing
the nearly signal-free mjj regions to constrain the rate of the W + jets events, which are the largest background. Because of the finite dijet mass resolution, there is considerable overlap between the mjj peaks from W W → `νq ¯q0 and W Z → `νq ¯q decays. Given the
expected uncertainties in this measurement, and the relatively small contribution from the W Z process (about 20% of the total signal yield), no attempt is made to distinguish between the W W and W Z contributions in this analysis. Instead, the signal yield is obtained under the assumption that the ratio of the W W and W Z cross sections is equal to the SM prediction.
The fiducial cross section (σfid) is evaluated from the measured signal yield. The fiducial phase space is defined to be as close as possible to the phase space defined by the reconstructed event selection. The fiducial cross-section measurement is obtained as:
σfid = X `=e,µ N`W V L · Dfid,` , (2.1)
where L is the integrated luminosity and Dfid,` are factors that correct for the difference between the number of W V → `νjj events produced in the fiducial phase space and the number of reconstructed events passing the event selection. The total cross section (σtot) is obtained by extrapolating the fiducial cross section to the full phase space using theoretical predictions: σtot= X `=e,µ N`W V L · Dtot,` , (2.2)
where Dtot,` are factors that depend on acceptances, reconstruction efficiencies, and the branching fractions for W W → `νjj and W Z → `νjj. Details of the maximum-likelihood fit and the precise definition of the fiducial-volume and of the factors Dfid,` and Dtot,` are
given in section 8.
Lastly, the transverse momentum distribution of the hadronically decaying V candi-dates (pTjj) is used to set limits on the aTGCs affecting the W W Z and W W γ vertices. The event selection is the same as the one used for the cross-section measurement, except that the dijet mass is required to be close to the masses of the W/Z bosons in order to increase the signal-to-background ratio. The aTGC limits are calculated by performing a binned maximum-likelihood fit to the pTjj distributions. The ratio of the W W and W Z
cross sections at each aTGC point is assumed to be that predicted by theory, including the aTGC contribution. Details of the limit extraction are given in section11.
3 The ATLAS detector
The ATLAS detector [12] is a general-purpose particle detector with cylindrical geometry1 which consists of several sub-detectors surrounding the interaction point, and covering al-most the full solid angle. The trajectories and momenta of charged particles are measured within the pseudorapidity region |η| < 2.5 by multi-layer silicon pixel and microstrip detec-tors and a transition radiation tracker. The tracking system is located in a superconducting solenoid producing a 2 T magnetic field and is surrounded by a high-granularity liquid-argon (LAr) sampling electromagnetic (EM) calorimeter with coverage up to |η| = 3.2. The EM calorimeter is split into a barrel section (|η| < 1.475) and endcaps (1.375 < |η| < 3.2). A scintillating tile hadronic calorimeter using steel as absorber provides coverage in the range |η| < 1.7. In the forward region, LAr calorimeters provide electromagnetic and hadronic measurements and extend the coverage to |η| < 4.9. The muon spectrometer surrounds the ATLAS calorimeter system and it operates in a toroidal magnetic field provided by air-core superconducting magnets and includes tracking chambers for precise muon momentum measurement up to |η| = 2.7 and trigger chambers covering the range |η| < 2.4. The online event selection is based on a three-level trigger system. The hardware-based Level-1 trigger
1
ATLAS uses a right-handed coordinate system with its origin at the nominal interaction point (IP) in the centre of the detector and the z-axis coinciding with the axis of the beam pipe. The x-axis points from the interaction point to the centre of the LHC ring, and the y-axis points upward. Cylindrical coordinates (r, φ) are used in the transverse plane, φ being the azimuthal angle around the beam pipe. The pseudorapidity η is defined in terms of the polar angle θ as η = − ln[tan(θ/2)].
uses a subset of the detector data to reduce the event rate from 20 MHz to below 75 kHz. Two subsequent software-level triggers further reduce the rate to about 300 Hz using the complete detector information.
4 Simulated event samples
Simulated event samples are used to model both the signal and all background processes except for the multijet background, which is estimated using a data-driven procedure. The signal and background MC samples are processed using the ATLAS detector simulation [13] based on Geant4 [14] and the same reconstruction algorithms as used for collision data. The simulation includes the modelling of additional pp interactions in the same and neigh-bouring bunch crossings (pile-up).
Diboson signal events are generated using mc@nlo v4.07 [15] interfaced to herwig [16, 17] for the parton showering and hadronisation and to jimmy2 [18] for the modelling of the underlying event. The on-shell gauge bosons are generated in mc@nlo and are subsequently decayed by herwig. This leads to a zero width for the decayed W/Z bosons and to the loss of the spin-correlation information for the decay products. The effects arising from this generation procedure are studied and considered, where needed, as systematic uncertainties. The ct10 [19] parton distribution function (PDF) set is used. The diboson samples are normalised to the next-to-leading-order (NLO) cross sections of 43.7 ± 1.9 pb and 17.4 ± 1.1 pb for W W and W Z, respectively. The central values of the diboson cross sections are estimated using mc@nlo, with factorisation and renormalisation scales equal to q
(m2
W + p2T,W + m2V + p2T,V)/2. The uncertainties are evaluated by varying the scales, the
PDF, and αs. The combined PDF+αs uncertainties are estimated by varying them within
their 68% confidence-level (CL) limits, following the procedure in ref. [20]. The gg → W W and H → W W processes are not included in the signal samples nor in the cross-section prediction, since their contributions are small compared to the expected sensitivity of this measurement. The gg → W W process would increase the total predicted W V cross section by about 2–4%. The H → W W process would increase the W V cross section by about 5%, but after applying all event selection criteria (see section 6), it would only increase the expected number of signal events by about 2%. The γγ → W W process [21] is also neglected. While this paper was in preparation, a next-to-next-to-leading-order (NNLO) calculation of W+W−production was published [22]. The NNLO corrections would increase the total W V cross section by about 4% beyond the gg → W W and H → W W corrections already mentioned. Additional signal samples generated with pythia3 [23] are used for systematic studies.
The dominant background to the W V → `νjj process is vector boson W/Z production in association with jets, which is modelled using alpgen v2.13 [24] with cteq6l1 [25] for the PDF, interfaced to herwig and jimmy. The W/Z + jets cross sections predicted by alpgen are scaled to the QCD NNLO inclusive cross section [26] times branching fraction for a single lepton species: σ(W → `ν) = 10.46 ± 0.42 nb and σ(Z/γ∗ → ``) =
2
The versions herwig v6.520 and jimmy v4.31 are used whenever these generators are mentioned. 3
1.070 ± 0.054 nb for invariant masses of the two leptons (m``) > 40 GeV. Production of a
W or Z boson plus heavy-flavour jets is also modeled using the alpgen+herwig+jimmy generator combination described above, and overlap with the inclusive W/Z + jets samples is removed to avoid double-counting. Samples generated using sherpa v1.4.1 [27–30] with ct10 PDFs are used for cross-checks.
Samples of t¯t events are produced using mc@nlo v4.01 [31] with the ct10 PDF set, interfaced to herwig and jimmy. The t¯t cross section is σt¯t= 177+10−11 pb for a top quark
mass of 172.5 GeV. It has been calculated at NNLO in QCD including resummation of next-to-next-to-leading logarithmic (NNLL) soft gluon terms with top++2.0 [32–37]. Samples of t¯t events generated with acermc v3.8 [38] interfaced to pythia are also considered for systematic uncertainty studies.
Single-top events from the W t and s-channel processes are generated using mc@nlo v4.01 [39,40] interfaced to herwig and jimmy with cross sections of 15.7 ± 1.2 pb [41] and 4.6 ± 0.2 pb [42], respectively. The ct10 PDF set is used. The single-top t-channel process is generated using acermc v3.8 + pythia with the mrst LO** [43] PDF set, using a cross section of 64.6+2.6−1.7 pb [44].
The ZZ diboson background process is generated using herwig with mrst LO** PDFs. It is normalised to the NLO cross section of 5.96 ± 0.3 pb (m``> 60 GeV), estimated with mcfm [45]. The uncertainty is evaluated using the same procedure as for the diboson signal. The W γ process is generated with madgraph v4 [46] interfaced to pythia. After the selection criteria are applied, the contribution of this process to the background is very small (less than 0.5% of the total), and so it is neglected.
5 Object and event reconstruction
Events were selected by a single-lepton (electron or muon) trigger with a threshold on the transverse energy (ET) in the electron case or on the transverse momentum (pT) in the muon case. The pT threshold for the single-muon trigger was 18 GeV, while for electrons it
was required to be ET> 20 GeV for the early part of data-taking and ET > 22 GeV when
the instantaneous luminosity of the LHC increased.
Proton–proton collision events are identified by requiring that the events have at least one reconstructed vertex with at least three associated tracks with transverse momentum pT,track > 0.4 GeV. If two or more such vertices are found, the one with the largest sum of
p2T,track is considered to be the primary vertex.
Electron candidates are formed by associating clusters of cells in the EM calorimeter with tracks reconstructed in the inner detector [47]. The transverse energy (ET), calculated
from the cluster energy and the track direction, must be greater than 25 GeV, in order to be in the region with maximum trigger efficiency. Candidates are accepted if they lie in the region |η| < 2.47, excluding the transition region between the barrel and endcap EM calorimeters, 1.37 < |η| < 1.52. The candidate must satisfy “tight” identification criteria described in ref. [47]. For the electron-candidate track, the ratio of the transverse impact parameter, d0, to its uncertainty, σ(d0), must satisfy |d0/σ(d0)| < 10. The longitudinal
are measured with respect to the primary vertex. To ensure isolation from surrounding particles, calorimetric and tracking criteria are applied. The total calorimeter ET in a
cone of size ∆R = p∆φ2+ ∆η2 = 0.3 around the electron candidate, excluding any
ET associated with the candidate itself, must be less than 14% of the electron ET value.
The calorimeter response is corrected for the additional energy deposited by pile-up. In addition, the scalar sum of the pT of the tracks within ∆R = 0.3 of the electron candidate (not including the electron track) must be less than 13% of the electron pT value.
Muon candidates are identified [48] by associating tracks reconstructed in the muon spectrometer with tracks reconstructed in the inner detector. The momentum of the com-bined muon track is calculated from the momenta of the two tracks, correcting for the energy loss in the calorimeter. Muon candidates must satisfy pT > 25 GeV and |η| < 2.4.
The pT threshold is chosen to be well within the plateau of the trigger efficiency. Muon candidates must also be consistent with originating from the primary vertex, in order to reject muons from cosmic-ray interactions and to reduce background from heavy-flavour decays. Specifically, the d0 significance must satisfy |d0/σ(d0)| < 3 and |z0| must be less
than 1 mm. To reduce misidentification and improve the muon momentum resolution, re-quirements on the minimum number of hits in the various detectors are applied to the muon tracks. Isolated muons are selected with a requirement that the scalar sum of the pT of the tracks within ∆R = 0.3 of the muon (not including the muon track) be less than 15% of the muon pT, and that the total calorimeter ET in a cone of ∆R = 0.3 around the muon candidate (excluding ET associated with the muon) be less than 14% of the muon pT. The electron and muon isolation requirements are the same as used in ref. [3].
Corrections are applied to MC events in order to account for differences between data and MC simulation in the trigger and identification efficiencies, and in the lepton momentum and energy scale and resolution. The trigger and reconstruction efficiency scale factors are measured using the tag-and-probe method on events with Z-boson candidates events [47, 48]. The lepton momenta are calibrated with scale factors obtained by comparing the reconstructed mass distribution of Z boson candidate events in data with that of simulated events [48,49].
Jets are reconstructed from calorimeter energy clusters by using an anti-ktalgorithm [50,
51] with a radius parameter of 0.4. The selected jets must satisfy ET> 25 GeV and |η| < 2.8. Reconstructed jets are corrected for the non-compensating calorimeter response, upstream material and other effects using pT- and η-dependent correction factors derived from MC
and validated with test-beam and collision data [51]. Jets consistent with being produced from pile-up interactions are identified using the Jet Vertex Fraction variable (JVF). This variable is calculated using tracks that are associated with the jet, and is defined as the ratio of the scalar pT sum of the associated tracks that originate from the primary vertex to the scalar pT sum of all associated tracks. Jets that are within |η| < 2.5 are retained if
they have JVF larger than 75% or if they have no associated track. The efficiency of this cut is ∼ 95% up to |η| < 2.5 and is well modelled by the MC simulation. Jets are required to satisfy quality criteria and to lie at a distance ∆R > 0.5 from well-identified leptons.
The ETmiss is estimated from reconstructed electrons with |η| < 2.47, muons with |η| < 2.7, jets with |η| < 4.9, and clusters of energy in the calorimeter not associated with
reconstructed objects having |η| < 4.5 [52]. The energy clusters are calibrated to the EM scale or the hadronic energy scale according to cluster characteristics. The expected energy deposit of identified muons in the calorimeter is subtracted.
6 Event selection
The W V candidates are selected by requiring exactly one high-pT lepton, missing trans-verse momentum, and exactly two jets. Events are required to contain exactly one re-constructed lepton candidate with pT > 25 GeV; events with more than one identified
lepton are rejected in order to suppress the Z+jets and t¯t backgrounds. The lepton can-didate must be the one that triggered the event. Furthermore, events are required to have ETmiss > 30 GeV in order to account for the presence of the unobserved neutrino from the W → `ν decays. The transverse mass of the leptonically decaying W boson candidate is defined as mT =
q
2 · pT(`) · ETmiss· (1 − cos ∆φ), where ∆φ is the azimuthal angle between
the lepton momentum and missing transverse momentum vectors, and is required to satisfy mT > 40 GeV. The ETmiss and mT criteria highly suppress the multijet background. To
further suppress the multijet background the azimuthal angular separation between the leading jet transverse momentum and the missing transverse momentum vectors must fulfil |∆φ(Emiss
T , j1)| > 0.8. Backgrounds containing top quark decays are highly reduced by
vetoing events that contain more than two jets with pT > 25 GeV and |η| < 2.8. Events are required to contain exactly two jets with |η| < 2.0 and pT > 25 GeV, with a pT > 30 GeV
requirement for the leading jet. In order to improve the signal-to-background ratio, the two jets are required to satisfy |∆η(j1, j2)| < 1.5. The angular distance between the two jets
must satisfy ∆R(j1, j2) > 0.7 if the pTof the dijet system is less than 250 GeV. Finally, the
dijet invariant mass must be in the range 25 < mjj< 250 GeV. The selection criteria were optimised to both increase the signal-to-background ratio and select a phase space region well described by the Monte Carlo simulation. After applying all event selection criteria, 127 650 events are found in the electron channel and 134 846 in the muon channel.
7 Signal and background estimation
The shapes of the expected mjj and pTjj distributions are used as templates for the cross-section fit and for the aTGC limit calculation, respectively. The expected shapes and rates of the distributions for the W +jets, Z +jets, t¯t, single-top, and signal processes are obtained from the MC simulation samples. The W + jets and Z + jets predicted rates are corrected using scale factors obtained with a data-driven method as explained below.
Multijet background events can pass the event selection if one of the jets is reconstructed as a lepton. The rate and shape of the multijet background are estimated with data-driven methods since the MC simulation does not reliably predict the rate of jets passing the lepton identification.
The data-driven method consists of two steps: the first one is designed to estimate the mjj, pTjj, and ETmiss shapes of the multijet background and the second one to measure its
The first step exploits suitably modified lepton identification criteria to define data samples enriched in multijet background and with kinematic characteristics as close as possible to those of the standard selection. The lepton identification criteria are modified differently for the muon and electron channels.
For the muon channel, the multijet-enriched sample is obtained by applying the full selection but inverting the transverse impact parameter requirement (|d0/σ(d0)| > 3). The
selected sample is composed of muons that do not originate from the primary vertex, as expected for muons produced from heavy-flavour decays in jets. For the electron channel, the multijet-enriched sample is obtained by applying the full nominal selection but requiring the electron candidate to satisfy the “medium” [53] identification criteria but not the “tight” ones. This results in a sample enriched in events with a jet that mimics an electron. Finally, the shape of the multijet background is obtained from the data in these multijet-enriched samples, after subtracting the MC-based prediction for non-multijet processes.
The second step uses the Emiss
T shape of the multijet background, determined in the
previous step, to obtain the multijet rate and a correction to the W/Z + jets normalisation. This is done fitting the ETmiss spectra obtained with the nominal selection but with the Emiss
T requirement removed. The fit, performed in the range 0 < ETmiss < 400 GeV, extracts
separate scale factors used to normalise the multijet and W/Z + jets samples. From this fit, the multijet contribution is extrapolated to the signal region (ETmiss > 30 GeV) and is found to represent 5.3% and 3.7% of the events for the electron and muon channels respectively. The W/Z + jets scale factors obtained from this fit are close to one and well within the systematic uncertainty of the theoretical prediction both for the electron and muon channel. Table 1 shows the expected number of events for the signal and for each background process after the full selection is applied. The numbers of events observed in data are also listed. The signal-to-background ratio in the subrange 60 < mjj < 120 GeV is about
2%. Figure 1 shows the mjj distributions for data and the SM prediction for the electron
and muon channels prior to performing the maximum-likelihood fit to extract the signal W V yield. The bottom plots in figure 1 show the ratios of data to the SM predictions overlaid with systematic uncertainty bands. The sources of systematic uncertainties and the strategy to evaluate them are discussed in section 9. The data distributions are well within the systematic uncertainty bands for all values of dijet mass for both channels.
8 Cross-section definition and fit method
As discussed in section 2, W V → `νjj candidates are selected in a fiducial phase space designed to increase the signal-to-background ratio. The fiducial phase space, which is identical for the electron and muon channels, is defined for Monte Carlo events by applying to the particle-level objects a selection as close as possible to the analysis selection described in section6. This selection requires a W boson decaying leptonically and a W or Z boson decaying hadronically. W → τ ν decays are not included in the definition of the fiducial cross section.
The leptonically decaying W boson is required to decay to an electron or a muon with pT > 25 GeV and |η| < 2.47. The lepton pT is obtained by summing together the lepton
50 100 150 200 250 Events / 5 GeV 0 2000 4000 6000 8000 10000 Data WW/WZ top quarks multijet W/Z + jets -1 L dt = 4.6 fb ∫ = 7 TeV s + 2 jets ν e → W ATLAS
Dijet mass [GeV]
50 100 150 200 250 Data/SM 0.8 0.9 1.0 1.1 1.2 (a) 50 100 150 200 250 Events / 5 GeV 0 2000 4000 6000 8000 10000 Data WW/WZ top quarks multijet W/Z + jets -1 L dt = 4.6 fb ∫ = 7 TeV s + 2 jets ν µ → W ATLAS
Dijet mass [GeV]
50 100 150 200 250
Data/SM 0.9 1.0 1.1
(b)
Figure 1. Distributions of the dijet invariant mass for (a) the electron and (b) the muon channels before the likelihood fit. The error bars represent statistical uncertainties, and the stacked his-tograms are SM predictions. The lower panel displays the ratio of the data to the MC expectation. The systematic band contains only systematic uncertainties that affect the shape of the background and signal processes.
transverse momentum and the transverse momenta of all photons within ∆R = 0.1 of the selected lepton. The transverse mass of the leptonically decayed W boson is required to be mT > 40 GeV.
Events must contain a hadronically decaying W or Z boson and two particle-level jets separated by ∆R > 0.5 from the selected leptons. Particle-level jets are reconstructed from particles with a mean decay length cτ > 10 mm using the anti-kt algorithm with radius
parameter R = 0.4. Decay products from leptonically decaying W/Z bosons (including photons within ∆R = 0.1 of the charged leptons) are excluded from the particle-level jets. The two selected jets must lie within |η| < 2.0 and have pT > 25 GeV with at least one of them having pT > 30 GeV. Events containing more than two particle-level jets with pT > 25 GeV and |η| < 2.8 are rejected. Moreover, the two selected jets must satisfy
|∆η(j1, j2)| < 1.5, 25 < mjj< 250 GeV and ∆R(j1, j2) > 0.7.
The last condition is applied only if the transverse momentum of the dijet system is pTjj < 250 GeV. Finally the ETmiss, defined as the transverse momentum of the neu-trino from the leptonically decaying W boson, is required to satisfy ETmiss > 30 GeV and |∆φ(Emiss
T , j1)| > 0.8.
maximum-Table 1. Total number of events in data and expected yields for each process in the e and µ channel. The multijet and W/Z +jets yields are obtained from the fit to the Emiss
T distribution as explained in section7. Uncertainties for the expected signal yields are based on the corresponding cross-section uncertainties, while for multijet and the other backgrounds the uncertainties correspond to the total rate uncertainty. Signal processes e µ W W 1435 ± 70 1603 ± 79 W Z 334 ± 23 370 ± 26 Background processes W + jets (107 ± 21) × 103 (116 ± 23) × 103 Z+ jets (55 ± 11)×102 (46.3 ± 9.3)×102 t¯t (47.2 ± 7.1)×102 (47.2 ± 7.1)×102 Single-top (20.2 ± 3.0)×102 (20.5 ± 3.1)×102 Multijet (67 ± 10)×102 (50.5 ± 7.6)×102 ZZ 19.2 ± 3.8 21.1 ± 4.2 Total SM prediction (128 ± 17)×103 (135 ± 19)×103 Total Data 127 650 134 846
likelihood fit to the mjjdistributions in the electron and muon channels. This method takes
advantage of the difference between the shapes of the mjj distributions of the various
pro-cesses to separate the signal from the large underlying background. The mjj templates, normalised to unit area, for the various processes contributing to the total expected mjj
distribution are shown in figure2.
Systematic uncertainties (described in section9) on the signal and background normal-isation as well as on the mjj shapes are included by introducing nuisance parameters (~α) into the fit. The combined likelihood function (L) is expressed as:
L(β, ~α) =Y ` Y b Poisson(n`b|(ν`bbkg+ βν`bsig)(~α)) · Y p fp(αp), (8.1)
where β is the parameter of interest extracted from the fit and is a multiplicative factor applied to the signal normalisation; n`b is the number of data events in bin b and channel
`, with ` = e, µ; ν`bbkg and ν`bsig are the number of expected events for background and signal processes respectively in bin b and channel `; and fpare Gaussian constraints on the nuisance
parameters αp. The expected number of signal events ν`bsigcontains contributions from both
the W W and W Z processes. The measured signal yield N`W V is obtained from the product of the fitted β value and the expected number of signal events as N`W V = β ·P
bν sig `b .
The diboson fiducial cross section (σfid) is extracted from N`W V using eq. (2.1). The
factors Dfid,` account for the fact that two processes, W W → `νjj and W Z → `νjj, con-tribute to the signal yield with different cross sections, acceptances and correction factors and are defined as:
Dijet mass [GeV] 50 100 150 200 250 Arbitrary Units 0 0.05 0.1 + 2 jets ν e → W ATLAS WW/WZ top quarks multijet W/Z + jets (a)
Dijet mass [GeV] 50 100 150 200 250 Arbitrary Units 0 0.05 0.1 + 2 jets ν µ → W ATLAS WW/WZ top quarks multijet W/Z + jets (b)
Figure 2. The nominal templates for the reconstructed dijet invariant mass for (a) the electron and (b) the muon channels. The templates for W W/W Z, W/Z + jets and top quarks, including single-top production, are obtained from MC, while the multijet template is obtained using a data-driven method. All templates are normalised to unit area.
where C`W V are the ratios of the detector-level signal yield after all analysis cuts to the signal yield in the fiducial phase space for the respective processes and lepton flavour. The values of CW W and CW Z vary between 0.61 and 0.74 and depend on the process and on the channel (electron, muon) considered. The factor ffidW W represents the ratio of the W W to the W W + W Z fiducial cross sections. The two processes are not separated by this analysis, so ffidW W is fixed to the SM value of 0.82, calculated with mc@nlo.
The total cross section is obtained by extrapolating the fiducial event yield to the full phase space using eq. (2.2). The factors Dtot,` are obtained from theoretical predictions
and are defined as:
Dtot,`= ftotW W· C`W W · B`W W · A`W W + (1 − ftotW W) · C`W Z · B`W Z · AW Z` (8.3)
where the acceptances AW W` and AW Z` are calculated as the fraction of signal events satis-fying the fiducial-volume selection criteria; they vary in the range 0.08–0.09 depending on the process and are independent of the lepton flavour. BW W` and B`W Z are the branching fractions for the decays W W → `νjj and W Z → `νjj respectively [54].
9 Systematic uncertainties
The total systematic uncertainties on the fiducial and total cross sections are obtained by summing in quadrature the uncertainties on the signal yield, on the factors Dfid or Dtot,
Systematic uncertainties that affect the fitted signal yield are accounted for by including nuisance parameters with Gaussian constraints in the maximum-likelihood fit (“profiled” systematic uncertainties), with a few exceptions that are described below. The nuisance parameters describe the estimated rate or shape variations of the templates for the various processes. Systematic uncertainties arising from the same source are assumed to be 100% correlated between the electron and muon channels. Uncertainties from different sources are assumed to be independent.
Two of the largest systematic uncertainties are the jet energy scale (JES) and jet energy resolution (JER) uncertainties, determined as described in refs. [51] and [55]. The JES uncertainty also includes the effect of energy deposits due to pile-up, and the uncertainties on the JES and JER are propagated to the ETmiss. The main impact of the JES and JER uncertainties on the measurement of the signal yield is due to the effect of these uncertainties on the shapes of the background distributions.
The largest contribution to the background is from the production of a W or Z boson in association with jets; this background was modelled using alpgen. Variations of the factorisation and normalisation scales are considered in evaluating the systematic uncer-tainty; also, the parameters that describe the matching scheme in the matrix element to initial/final-state radiation (ISR/FSR) particles are varied. Alternative W/Z + jets samples generated with sherpa [27] were also analysed; the mjj and pTjj distributions from these
samples are consistent with the alpgen samples within the aforementioned alpgen gener-ator uncertainties, so no additional systematic uncertainty is assigned for alpgen-sherpa differences. The total rate uncertainty assigned to the W/Z + jets processes is 20% and it includes rate changes due to cross-section, MC modelling, JES, and JER uncertainties.
The uncertainties on the modelling of the t¯t and single-top processes include shape and rate uncertainties due to variation of the ISR/FSR description. These are calculated with dedicated samples generated with acermc. The total rate uncertainty assigned to the single-top and t¯t processes is 15% and includes contributions from cross-section, MC modelling, JES, and JER uncertainties.
The multijet rate and shape uncertainties are determined by cross-checking the data-driven multijet estimation method in a multijet validation region with modified selection criteria: ETmiss < 25 GeV and mT > 10 GeV. The uncertainty on the multijet rate is
determined to be 15%. Shape and rate uncertainties for the electron and muon channels are assumed to be uncorrelated. The shape uncertainties are described in the likelihood fit by means of two independent nuisance parameters, one for the electron channel and one for the muon channel. The effect of the multijet rate uncertainty on the extracted signal yield is estimated using pseudo-experiments as mentioned below.
The signal shape modelling uncertainty (including sources such as fragmentation, parton-shower, underlying-event and hadronisation modelling) is assessed by considering alterna-tive templates obtained with samples produced with the pythia generator. Varying the PDF is found to have a negligible impact on the shape of the mjj and pTjj distributions.
Some uncertainties on the fitted signal yield were not described through nuisance pa-rameters, either in order to limit the number of parameters in the fit, or because of the difficulty of fully parameterising the possible systematic variation in terms of a nuisance
parameter. In such cases the impact of these uncertainties on the signal yield is estimated using an ensemble of pseudo-experiments. These uncertainties include the multijet rate un-certainty and the unun-certainty due to the size of the MC event samples. The finite size of the MC event samples produces an uncertainty since it limits the precision with which the mjj templates are known. This systematic uncertainty is one of the largest, and is dominated by the size of the event sample for the W + jets process.
The total uncertainty on the signal yield is obtained by summing contributions from the profiled and non-profiled sources in quadrature.
The fiducial and total cross sections are also affected by uncertainties on the values of Dfid and Dtot, respectively. The following sources of uncertainty are considered for these
factors: JES, JER, PDF, signal modelling (fragmentation, underlying-event, parton-shower, hadronisation, loss of spin-correlation information), lepton trigger and reconstruction effi-ciencies, and lepton energy scale. The largest contributions to the Dfid and Dtot
uncertain-ties come from the JES and JER uncertainuncertain-ties while the uncertainuncertain-ties affecting the leptons give very small contributions.
Table 2 summarizes the percent contributions to the systematic uncertainties on the cross sections from the different sources. In the case of profiled systematic uncertainties, the contribution of each individual source to the total uncertainty on N`W V is estimated by repeating the fit while fixing the nuisance parameter associated with the source under consideration to its best-fit value. The uncertainty on N`W V from this modified fit is sub-tracted in quadrature from the uncertainty on NW V
` given by the nominal fit, and the result
is taken to be the systematic uncertainty due to the source in question. The data statistics uncertainty is calculated as the fit uncertainty on N`W V when all nuisance parameters are fixed to their best-fit values. The largest source of uncertainty is the W/Z + jets rate, dominated by the W + jets rate uncertainty.
10 Cross-section results
The mjjmaximum-likelihood fit, including all the nuisance parameters, is performed on the
data, and yields a value of β = 1.11 ± 0.26, where β is defined in eq. (8.1). The uncertainty includes all the systematic uncertainties from the profiled sources; the purely statistical uncertainty on β is 10%. The total systematic uncertainty on the signal yield, including unprofiled systematic uncertainties, is 26%. The measured signal yields are NeW V = 1970 ± 200 (stat.) ± 500 (syst.) and NµW V = 2190 ± 220 (stat.) ± 560 (syst.) in the electron and muon channels respectively. This signal yield translates into a fiducial cross section of
σfid= 1.37 ± 0.14 (stat.) ± 0.37 (syst.) pb (10.1)
for the W W and W Z production processes summed over the muon and electron channels, and a total cross section of
σtot= 68 ± 7 (stat.) ± 19 (syst.) pb , (10.2)
in good agreement with the Standard Model prediction obtained with mc@nlo of σtot =
Table 2. Statistical and systematic uncertainties, in %, on the measured fiducial and total cross sections. The uncertainties are split according to the quantity (N`W V, Dfid, Dtot, L) they are affect-ing.
Source σfid σtot
N`W V
Data statistics ±10
MC statistics ±12
W/Z + jets rate and shape modelling ±17
Multijet shape and rate ±8
Top rate and initial/final-state radiation shape modelling ±6
Jet energy scale (background and signal shapes) ±9
Jet energy resolution (background and signal shapes) ±11
W V shape modelling ±5
Dfid Dtot
JES/JER uncertainty ±6 ±6
Signal modelling ±4 ±5
Jet veto scale dependence - ±5
Others (loss of spin-corr information, lepton uncertainties, PDF) ±1 ±4
Luminosity ±1.8
Total systematic uncertainty ±27 ±28
The signal yield significance is estimated using the likelihood ratio, defined as the ratio of the maximum-likelihood with the signal fixed to zero, to the maximum-likelihood including the signal component in the fit [56,57]. The expected significance is estimated to be 3.2σ by performing fits with and without the signal component to pseudo-data generated from MC samples with and without the signal component. The observed significance is 3.4σ. The effect of systematic uncertainties is included in the significance calculations.
The mjj distribution of the data overlaid with the fit result is shown in figure3 for the sum of the electron and muon channels. In addition, the background-subtracted data is shown overlaid with the fitted signal distribution.
As a cross-check, separate fits to the electron and muon channels were performed to extract the most probable β values for the two channels. The values obtained, 1.00 ± 0.37 for the electron channel and 1.13 ± 0.36 for the muon channel, are in agreement with the value obtained with the simultaneous fit.
11 Anomalous triple gauge couplings
The measured W V cross section agrees well with the SM predictions; in this section lim-its are set on anomalous triple gauge couplings affecting the W W Z and W W γ vertices. Anomalous couplings tend to enhance the diboson cross section at high boson pT. Limits
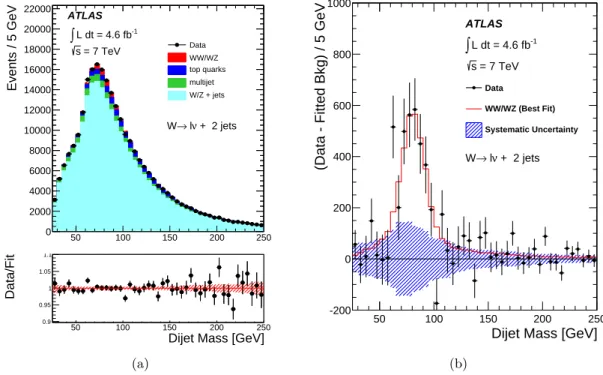
50 100 150 200 250 Events / 5 GeV 0 2000 4000 6000 8000 10000 12000 14000 16000 18000 20000 22000 Data WW/WZ top quarks multijet W/Z + jets -1 L dt = 4.6 fb ∫ = 7 TeV s ATLAS + 2 jets ν l → W
Dijet Mass [GeV]
50 100 150 200 250 Data/Fit 0.9 0.95 1 1.05 1.1 (a)
Dijet Mass [GeV]
50 100 150 200 250
(Data - Fitted Bkg) / 5 GeV
-200 0 200 400 600 800 1000 + 2 jets ν l → W -1 L dt = 4.6 fb ∫ = 7 TeV s ATLAS Data WW/WZ (Best Fit) Systematic Uncertainty (b)
Figure 3. (a) Distributions of the dijet invariant mass for the sum of the electron and muon channels after the likelihood fit. The error bars represent statistical uncertainties, and the stacked histograms are the signal and background contributions. The normalisations and shapes of the histograms are obtained from the best fit to the data, after being allowed to vary within their systematic uncertainties. The lower panel displays the ratio between the data and the total fit result, including both signal and backgrounds. The hatched band shows the systematic uncertainty on the fitted signal plus background. (b) Distribution of the background-subtracted data for the sum of the electron and muon channels. The error bars represent the statistical error on the data. The superimposed histogram shows the fitted signal and the hatched band shows the systematic uncertainty on the background after profiling the nuisance parameters.
of the reconstructed hadronically decaying V , pTjj. The event selection is the same as used for the cross-section measurement, except that mjj is additionally required to be between
75 and 95 GeV to improve the signal-to-background ratio. The mjj range and the binning
of the pTjj histogram are chosen to optimise the expected aTGC limits.
To quantify possible deviations from the SM affecting triple gauge boson vertices, the couplings of the W W Z and W W γ vertices are described in terms of five dimensionless parameters: λγ, λZ, κγ, κZ, and g1Z, only considering couplings that conserve C and P
and satisfy electromagnetic gauge invariance [58]. No form factors are applied to these parameters in this analysis. In the SM, λγ = λZ = 0, and κγ = κZ = g1Z = 1. Various
assumptions can be made to decrease the number of free parameters. In this analysis, limits are given using the so-called LEP scenario [59] in which the following additional constraints,
derived from SU (2) × U (1) gauge invariance, are imposed:
λγ = λZ ≡ λ , (11.1)
∆κZ = ∆g1Z− ∆κγtan2θw, (11.2)
where ∆κγ ≡ κγ− 1, ∆κZ ≡ κZ− 1, and ∆gZ
1 ≡ g1Z− 1. In this scenario, there are three
free parameters: λ, ∆κγ, and ∆gZ 1.
An alternative approach to the aTGC parametrisation describes deviations from the SM in terms of an effective-field-theory (EFT), valid only up to some mass scale Λ. This EFT [1,60] contains three C- and P -conserving dimension-6 operators. The coefficients of these operators are denoted by cW, cB, and cW W W, and can be related to the LEP-scenario
parameters by the following equations: cW Λ2 = 2 m2 Z ∆gZ1 , (11.3) cB Λ2 = 2 m2 W ∆κγ− 2 m2 Z ∆g1Z, (11.4) cW W W Λ2 = 2 3g2m2 W λ , (11.5)
where g is the electroweak coupling constant.
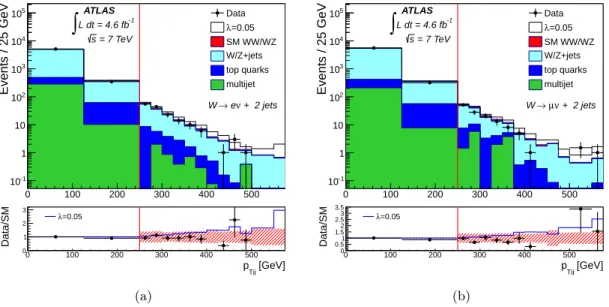
The diboson signal with anomalous couplings is modeled using the same generator (mc@nlo+herwig) as for the SM signal. The dijet pT distribution is shown in figure 4
for data and MC simulation, along with the signal prediction for an aTGC of λ = 0.05. The limits on the anomalous couplings are calculated by performing a binned maximum-likelihood fit to the pTjj spectrum. To determine whether a point ~α in the anomalous
coupling parameter space is excluded by the data, the likelihood ratio L(~α)/L(~αmax) is
computed, where ~αmaxis the value of the anomalous coupling(s) that maximizes the
likeli-hood. Then the probability of observing such a small likelihood ratio is determined through pseudo-experiments, in which pseudo-data are generated by randomly sampling the prob-ability density function. Systematic uncertainties are incorporated in the fit via nuisance parameters which affect the rates and pTjj distribution shapes of the signal and background
processes. The same sources of systematic uncertainty are included as are described for the mjj fit in section 9, except for those found to be negligible, such as the effect of PDF
un-certainties on the signal. In addition, an uncertainty is included on the pTjj distribution
shape of the signal due to increasing and decreasing the scales by a factor of two. The factorisation and renormalisation scales are varied simultaneously by the same amount. As can be seen in figure4, at very high pTjj the statistical uncertainties dominate, whereas at
lower values of pTjj the systematic uncertainties are more important.
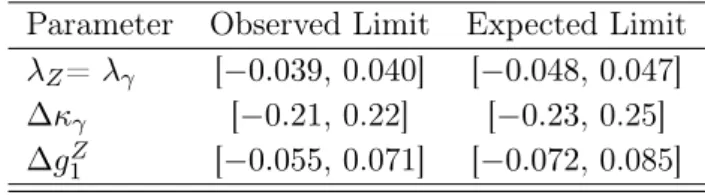
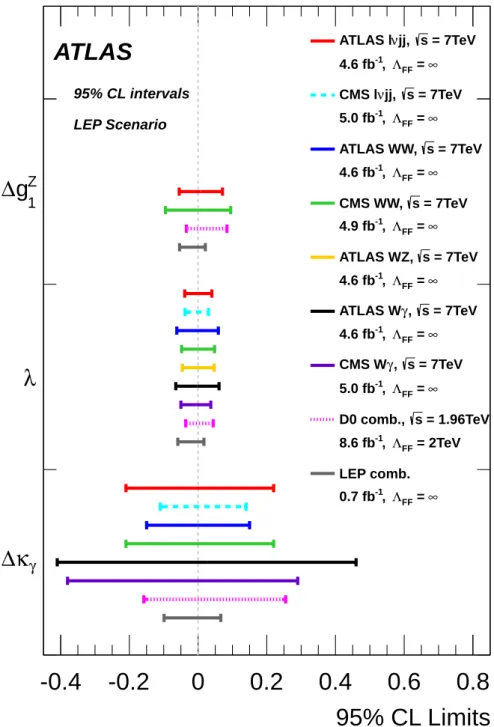
The expected and observed 95% CL limits for λ, ∆κγ, and ∆gZ1 in the LEP scenario
are given in table 3. If there were no systematic uncertainties at all, the expected aTGC limits would improve by about 25%.
In figure5, the observed limits are compared with previous limits from ATLAS [3,4,61], CMS [6, 9, 62], D0 [11], and LEP [63], in a variety of channels including W W → `ν`ν, W Z → `ν``, W V → `νjj, and W γ → `νγ. All limits are given at 95% CL, and calculated
Table 3. The observed and expected 95% CL limits on the anomalous triple gauge coupling parameters λ, ∆κγ, and ∆g1Z in the LEP scenario with no form factor applied. The limits on each parameter are calculated while fixing the other two parameters to zero.
Parameter Observed Limit Expected Limit λZ= λγ [−0.039, 0.040] [−0.048, 0.047]
∆κγ [−0.21, 0.22] [−0.23, 0.25]
∆g1Z [−0.055, 0.071] [−0.072, 0.085]
within the LEP scenario. The form factor ΛFF used for each limit calculation is specified on the figure 5; ΛFF = ∞ is equivalent to no form factor. The limits for each parameter
are obtained while fixing the other two parameters to zero. In the CMS `νjj analysis and the in ATLAS and CMS W γ analyses, no limits on ∆gZ
1 were given. The ATLAS
W W and W Z analyses gave limits on ∆gZ1, but with ∆κZ = 0 rather than ∆κγ = 0,
so they are not comparable with these results and are thus excluded. For the ATLAS W W result, the published limits on ∆κZ are converted to limits on ∆κγ using the formula
∆κZ = −∆κγtan2θw. The ATLAS W Z analysis published limits on ∆κZ, which can also
be converted to ∆κγ, but those limits are not shown, since they are much larger than the other limits in this figure. The limits obtained in this analysis are competitive with the limits from the other analyses. Compared to the fully leptonic W W analyses from hadron colliders, the limits shown here are slightly more stringent for λ and ∆g1Z and slightly worse for ∆κγ.
In table 4, the limits are shown for each of the five aTGC parameters when no rela-tionship between the different parameters is imposed. In this scenario, ∆gZ1 has very little effect on the W W process, whereas ∆κZ has very little effect on the W Z process.
Table 4. The observed and expected 95% CL limits on the anomalous triple gauge parameters λZ, ∆κZ, ∆gZ
1, λγ, and ∆κγ, not subjected to any constraints between them. No form factors are applied to the aTGC parameters. The limits on each parameter are calculated while fixing the other four parameters to zero.
Parameter Observed Limit Expected Limit λZ [−0.043, 0.044] [−0.056, 0.056]
∆κZ [−0.090, 0.105] [−0.11, 0.12]
∆g1Z [−0.073, 0.095] [−0.11, 0.12] λγ [−0.15, 0.15] [−0.17, 0.16]
∆κγ [−0.19, 0.23] [−0.22, 0.25]
Thus, analyses that restrict themselves to either the W W process or the W Z process have limited sensitivity to at least one of the aTGC parameters. In contrast, this analysis combines the two processes, and therefore has good sensitivity to all five aTGC parameters. As an illustration, this analysis has four times better expected limits on ∆g1Z than the
ATLAS W W → `ν`ν analysis [3], and four times better expected limits on ∆κZ than the ATLAS W Z → `ν`` analysis [4].
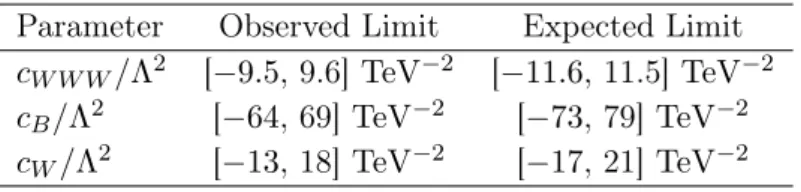
Finally, table5, gives limits on the EFT parameters. The limits on the EFT parameters cW, cB, and cW W W are in the range (10–70)×(Λ/TeV)2. In all cases, when computing the
limits on one parameter, all the other parameters are fixed to zero.
Table 5. The observed and expected 95% CL limits on the effective field theory parameters cW W W/Λ2, cB/Λ2, and cW/Λ2. The limits on each parameter are calculated while fixing the other two parameters to zero.
Parameter Observed Limit Expected Limit cW W W/Λ2 [−9.5, 9.6] TeV−2 [−11.6, 11.5] TeV−2
cB/Λ2 [−64, 69] TeV−2 [−73, 79] TeV−2
cW/Λ2 [−13, 18] TeV−2 [−17, 21] TeV−2
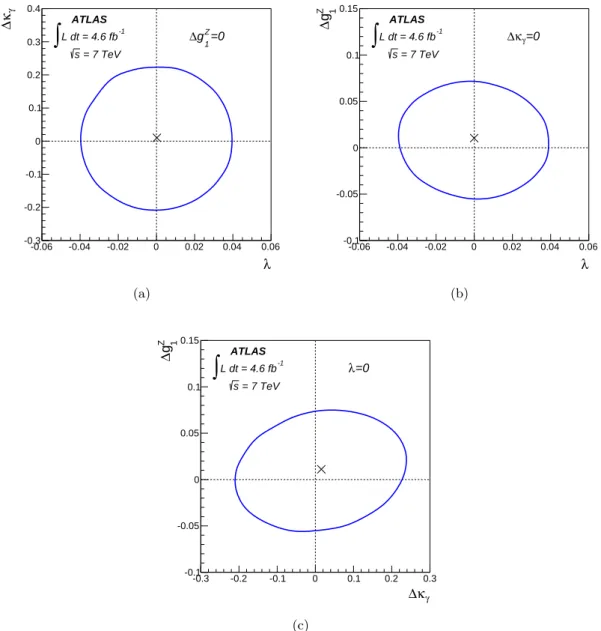
The observed two-dimensional 95% CL limits are shown in figure6for the LEP scenario. The limits on ∆κγ and ∆g1Z are significantly correlated, but the limits on the other pairs of
parameters do not have large correlations. In addition, the observed two-dimensional 95% CL limits on the EFT parameters are shown in figure 7. None of the EFT parameter pairs exhibit strong correlations.
0 100 200 300 400 500 Events / 25 GeV -1 10 1 10 2 10 3 10 4 10 5 10 Data =0.05 λ SM WW/WZ W/Z+jets top quarks multijet ATLAS -1 L dt = 4.6 fb
∫
s = 7 TeV + 2 jets ν e → W [GeV] Tjj p 0 100 200 300 400 500 Data/SM 0 1 2 3 =0.05 λ (a) 0 100 200 300 400 500 Events / 25 GeV -1 10 1 10 2 10 3 10 4 10 5 10 Data =0.05 λ SM WW/WZ W/Z+jets top quarks multijet ATLAS -1 L dt = 4.6 fb∫
s = 7 TeV + 2 jets ν µ → W [GeV] Tjj p 0 100 200 300 400 500 Data/SM 0 0.51 1.52 2.53 3.5 =0.05 λ (b)Figure 4. The observed distribution of the transverse momentum of the two jets, compared to the expectation for SM signal plus background, for (a) the electron channel and (b) the muon channel. The error bars represent statistical uncertainties, and the stacked histograms are background and signal predictions as described in the legend. The effect of an aTGC of λZ = λγ= 0.05 is shown for comparison (white histogram) on top of the SM predictions (coloured histograms). The rightmost bin includes overflow. The bottom panels show the ratio between the data and the SM prediction overlaid with the systematic uncertainty on the shape of the pTjj distribution. The binning in the plots is the same as that one used to perform the calculation of the limits. The red vertical line indicates that the event selection is different for pTjj less than and greater than 250 GeV, as described in section6.
95% CL Limits
-0.4
-0.2
0
0.2
0.4
0.6
0.8
γκ
∆
λ
1 Zg
∆
LEP comb. ∞ = FF Λ , -1 0.7 fb = 7TeV s jj, ν ATLAS l ∞ = FF Λ , -1 4.6 fb = 7TeV s jj, ν CMS l ∞ = FF Λ , -1 5.0 fb = 1.96TeV s D0 comb., = 2TeV FF Λ , -1 8.6 fb = 7TeV s ATLAS WW, ∞ = FF Λ , -1 4.6 fb = 7TeV s CMS WW, ∞ = FF Λ , -1 4.9 fb = 7TeV s ATLAS WZ, ∞ = FF Λ , -1 4.6 fb = 7TeV s , γ ATLAS W ∞ = FF Λ , -1 4.6 fb = 7TeV s , γ CMS W ∞ = FF Λ , -1 5.0 fbATLAS
95% CL intervals LEP ScenarioFigure 5. Comparison of limits on anomalous triple gauge coupling parameters obtained in this analysis with limits quoted by other experiments and/or in different channels (see text for details).
λ -0.06 -0.04 -0.02 0 0.02 0.04 0.06 γ κ∆ -0.3 -0.2 -0.1 0 0.1 0.2 0.3 0.4 ATLAS -1 L dt = 4.6 fb
∫
= 7 TeV s =0 Z 1 g ∆ (a) λ -0.06 -0.04 -0.02 0 0.02 0.04 0.06 Z 1 g ∆ -0.1 -0.05 0 0.05 0.1 0.15 ATLAS -1 L dt = 4.6 fb∫
= 7 TeV s =0 γ κ ∆ (b) γ κ ∆ -0.3 -0.2 -0.1 0 0.1 0.2 0.3 Z 1 g ∆ -0.1 -0.05 0 0.05 0.1 0.15 ATLAS -1 L dt = 4.6 fb∫
= 7 TeV s =0 λ (c)Figure 6. The observed two-dimensional 95% CL contours for the anomalous triple gauge couplings (a) λ versus ∆κγ, (b) λ versus ∆gZ1, and (c) ∆κγ versus ∆g1Z. The limits are for the LEP scenario without a form factor.
] -2 [TeV 2 Λ / WWW c -15 -10 -5 0 5 10 15 ] -2 [TeV 2 Λ / B c -80 -60 -40 -20 0 20 40 60 80 100 120 ATLAS -1 L dt = 4.6 fb
∫
= 7 TeV s =0 W c (a) ] -2 [TeV 2 Λ / WWW c -15 -10 -5 0 5 10 15 ] -2 [TeV 2 Λ / W c -15 -10 -5 0 5 10 15 20 25 30 ATLAS -1 L dt = 4.6 fb∫
= 7 TeV s =0 B c (b) ] -2 [TeV 2 Λ / B c -100 -80 -60 -40 -20 0 20 40 60 80 100 ] -2 [TeV 2 Λ / W c -15 -10 -5 0 5 10 15 20 25 30 ATLAS -1 L dt = 4.6 fb∫
= 7 TeV s =0 WWW c (c)Figure 7. The observed two-dimensional 95% CL contours for the effective field theory parameters (a) cW W W/Λ2versus cB/Λ2, (b) cW W W/Λ2 versus cW/Λ2, and (c) cB/Λ2versus cW/Λ2.
12 Conclusion
A measurement of the pp → W V cross section (V = W, Z) at √s = 7 TeV is performed with 4.6 ± 0.1 fb−1 of data collected by ATLAS at the LHC, using the W V → `νjj (`=e,µ) decay channels. The total W W + W Z cross section is measured to be σ(W W + W Z) = 68 ± 7 (stat.) ± 19 (syst.) pb, where the observed significance of the signal is 3.4σ. This measurement is consistent with the mc@nlo cross-section prediction of 61.1 ± 2.2 pb. In addition, a fiducial cross section is measured in a phase space corresponding closely to the event selection used in the analysis, and is found to be σfid = 1.37 ± 0.14 (stat.) ± 0.37 (syst.) pb.
The same process is also used to place limits on anomalous triple gauge couplings (aTGCs) and on the coefficients of dimension-6 operators of an effective-field-theory. Within the LEP scenario, the observed 95% CL limits on the anomalous triple gauge parameters are −0.039 < λ < 0.040, −0.21 < ∆κγ < 0.22, and −0.055 < ∆g1Z < 0.071. The limits on
anomalous couplings are similar to those obtained by other diboson analyses.
Acknowledgments
We thank CERN for the very successful operation of the LHC, as well as the support staff from our institutions without whom ATLAS could not be operated efficiently.
We acknowledge the support of ANPCyT, Argentina; YerPhI, Armenia; ARC, Aus-tralia; BMWFW and FWF, Austria; ANAS, Azerbaijan; SSTC, Belarus; CNPq and FAPESP, Brazil; NSERC, NRC and CFI, Canada; CERN; CONICYT, Chile; CAS, MOST and NSFC, China; COLCIENCIAS, Colombia; MSMT CR, MPO CR and VSC CR, Czech Republic; DNRF, DNSRC and Lundbeck Foundation, Denmark; EPLANET, ERC and NSRF, European Union; IN2P3-CNRS, CEA-DSM/IRFU, France; GNSF, Georgia; BMBF, DFG, HGF, MPG and AvH Foundation, Germany; GSRT and NSRF, Greece; ISF, MIN-ERVA, GIF, I-CORE and Benoziyo Center, Israel; INFN, Italy; MEXT and JSPS, Japan; CNRST, Morocco; FOM and NWO, Netherlands; BRF and RCN, Norway; MNiSW and NCN, Poland; GRICES and FCT, Portugal; MNE/IFA, Romania; MES of Russia and ROSATOM, Russian Federation; JINR; MSTD, Serbia; MSSR, Slovakia; ARRS and MIZŠ, Slovenia; DST/NRF, South Africa; MINECO, Spain; SRC and Wallenberg Foundation, Sweden; SER, SNSF and Cantons of Bern and Geneva, Switzerland; NSC, Taiwan; TAEK, Turkey; STFC, the Royal Society and Leverhulme Trust, United Kingdom; DOE and NSF, United States of America.
The crucial computing support from all WLCG partners is acknowledged gratefully, in particular from CERN and the ATLAS Tier-1 facilities at TRIUMF (Canada), NDGF (Denmark, Norway, Sweden), CC-IN2P3 (France), KIT/GridKA (Germany), INFN-CNAF (Italy), NL-T1 (Netherlands), PIC (Spain), ASGC (Taiwan), RAL (UK) and BNL (USA) and in the Tier-2 facilities worldwide.
References
[2] L. J. Dixon, Z. Kunszt, and A. Signer,Phys. Rev. D60 (1999) 114037,
arXiv:hep-ph/9907305 [hep-ph].
[3] ATLAS Collaboration,Phys. Rev. D87 (2013) 112001,arXiv:1210.2979 [hep-ex]. [4] ATLAS Collaboration,Eur. Phys. J. C72 (2012) 2173,arXiv:1208.1390 [hep-ex]. [5] CMS Collaboration,Phys. Lett. B721 (2013) 190,arXiv:1301.4698 [hep-ex]. [6] CMS Collaboration,Eur. Phys. J. C73 (2013) 2610, arXiv:1306.1126 [hep-ex]. [7] CDF Collaboration, T. Aaltonen et al.,Phys. Rev. D82 (2010) 112001,arXiv:1008.4404
[hep-ex].
[8] D0 Collaboration Collaboration, V. M. Abazov et al.,Phys. Rev. Lett. 108 (2012) 181803,
arXiv:1112.0536 [hep-ex].
[9] CMS Collaboration,Eur. Phys. J. C73 (2013) 2283, arXiv:1210.7544 [hep-ex]. [10] CDF Collaboration, T. Aaltonen et al.,Phys. Rev. D76 (2007) 111103,arXiv:0705.2247
[hep-ex].
[11] D0 Collaboration, V. M. Abazov et al.,Phys. Lett. B718 (2012) 451,arXiv:1208.5458 [hep-ex].
[12] ATLAS Collaboration,JINST 3 (2008) S08003.
[13] ATLAS Collaboration,Eur. Phys. J. C70 (2010) 823,arXiv:1005.4568 [physics.ins-det].
[14] GEANT4 Collaboration, S. Agostinelli et al.,Nucl. Instrum. Meth. A506 (2003) 250–303. [15] S. Frixione and B. R. Webber, JHEP 06 (2002) 029, arXiv:hep-ph/0204244.
[16] G. Corcella et al., JHEP 01 (2001) 010,arXiv:hep-ph/0011363 [hep-ph].
[17] G. Marchesini, B. Webber, G. Abbiendi, I. Knowles, M. Seymour, and L. Stanco,Computer Physics Communications 67 no. 3, (1992) 465.
http://www.sciencedirect.com/science/article/pii/0010465592900554. [18] J. M. Butterworth, J. R. Forshaw, and M. H. Seymour,Z. Phys. C72 (1996) 637,
arXiv:hep-ph/9601371.
[19] H. L. Lai et al.,Phys. Rev. D82 (2010) 074024,arXiv:1007.2241 [hep-ph]. [20] A. Martin, W. Stirling, R. Thorne, and G. Watt, Eur. Phys. J. C 64 (2009) 653,
arXiv:0905.3531 [hep-ph].
[21] M. Luszczak, A. Szczurek, and C. Royon,arXiv:1409.1803 [hep-ph].
[22] T. Gehrmann et al.,Phys. Rev. Lett. 113 (2014) 212001,arXiv:1408.5243 [hep-ph]. [23] T. Sjostrand, S. Mrenna, and P. Z. Skands,JHEP 05 (2006) 026, arXiv:hep-ph/0603175
[hep-ph].
[24] M. L. Mangano et al., JHEP 07 (2003) 001,hep-ph/0206293.
[25] J. Pumplin et al.,JHEP 07 (2002) 012,arXiv:hep-ph/0201195 [hep-ph].
[26] K. Melnikov and F. Petriello,Phys. Rev. D74 (2006) 114017, arXiv:hep-ph/0609070 [hep-ph].
[28] S. Höche, F. Krauss, S. Schumann, and F. Siegert,JHEP 05 (2009) 053,arXiv:0903.1219 [hep-ph].
[29] T. Gleisberg and S. Höche,JHEP 12 (2008) 039,arXiv:0808.3674 [hep-ph]. [30] S. Schumann and F. Krauss,JHEP 03 (2008) 038, arXiv:0709.1027 [hep-ph].
[31] S. Frixione, P. Nason, and B. R. Webber, JHEP 08 (2003) 007,arXiv:hep-ph/0305252. [32] M. Cacciari, M. Czakon, M. Mangano, A. Mitov, and P. Nason,Phys. Lett. B710 (2012)
612,arXiv:1111.5869 [hep-ph].
[33] P. Bärnreuther, M. Czakon, and A. Mitov,Phys. Rev. Lett. 109 (2012) 132001,
arXiv:1204.5201 [hep-ph].
[34] M. Czakon and A. Mitov, JHEP 12 (2012) 054,arXiv:1207.0236 [hep-ph]. [35] M. Czakon and A. Mitov, JHEP 01 (2013) 080,arXiv:1210.6832 [hep-ph].
[36] M. Czakon, P. Fiedler, and A. Mitov,Phys. Rev. Lett. 110 (2013) 252004,arXiv:1303.6254 [hep-ph].
[37] M. Czakon and A. Mitov, Comput. Phys. Commun. 185 (2014) 2930,arXiv:1112.5675 [hep-ph].
[38] B. P. Kersevan and E. Richter-Was,Comput. Phys. Commun. 184 (2013) 919,
arXiv:hep-ph/0405247 [hep-ph].
[39] S. Frixione, E. Laenen, P. Motylinski, and B. R. Webber,JHEP 03 (2006) 092,
arXiv:hep-ph/0512250.
[40] S. Frixione, E. Laenen, P. Motylinski, B. R. Webber, and C. D. White,JHEP 07 (2008) 029,
arXiv:0805.3067 [hep-ph].
[41] N. Kidonakis,Phys. Rev. D82 (2010) 054018,arXiv:1005.4451 [hep-ph]. [42] N. Kidonakis,Phys. Lett. D81 (2010) 054028,arXiv:1001.5034 [hep-ph]. [43] A. Sherstnev and R. Thorne,arXiv:0807.2132 [hep-ph].
[44] N. Kidonakis,Phys. Rev. D83 (2011) 091503,arXiv:1103.2792 [hep-ph].
[45] J. M. Campbell and R. K. Ellis,Phys. Rev. D60 (1999) 113006, arXiv:hep-ph/9905386. [46] J. Alwall et al.,JHEP 09 (2007) 028, arXiv:0706.2334 [hep-ph].
[47] ATLAS Collaboration,Eur. Phys. J. C74 (2014) 2941,arXiv:1404.2240 [hep-ex]. [48] ATLAS Collaboration,Eur. Phys. J. C74 (2014) 3130,arXiv:1407.3935 [hep-ex]. [49] ATLAS Collaboration,Eur. Phys. J. C74 (2014) 3071,arXiv:1407.5063 [hep-ex]. [50] M. Cacciari, G. P. Salam, and G. Soyez,JHEP 04 (2008) 063,arXiv:0802.1189 [hep-ph]. [51] ATLAS Collaboration, Eur. Phys. J. C73 (2013) 2304,arXiv:1112.6426 [hep-ex]. [52] ATLAS Collaboration,Eur. Phys. J. C72 (2012) 1844,arXiv:1108.5602 [hep-ex]. [53] ATLAS Collaboration, Eur. Phys. J. C72 (2012) 1909,arXiv:1110.3174 [hep-ex]. [54] Particle Data Group Collaboration, J. Beringer et al.,Phys. Rev. D86 (2012) 010001. [55] ATLAS Collaboration,Eur. Phys. J. C73 (2013) 2306,arXiv:1210.6210 [hep-ex]. [56] ATLAS Collaboration, ATL-PHYS-PUB-2011-011.http://cds.cern.ch/record/1375842.
[57] CMS Collaboration, CMS NOTE-2011/005.http://cds.cern.ch/record/1379837. [58] K. Hagiwara, R. Peccei, D. Zeppenfeld, and K. Hikasa,Nucl. Phys. B282 (1987) 253. [59] Altarelli, G. and Sjöstrand, T. and Zwirner, F., Physics at LEP2, CERN, 1996. [60] C. Degrande et al.,Annals Phys. 335 (2013) 21,arXiv:1205.4231 [hep-ph].
[61] ATLAS Collaboration,Phys. Rev. D87 no. 11, (2013) 112003,arXiv:1302.1283 [hep-ex]. [62] CMS Collaboration,Phys. Rev. D89 (2014) 092005,arXiv:1308.6832 [hep-ex].
[63] ALEPH, DELPHI, L3, OPAL, LEP Electroweak Collaboration, S. Schael et al.,Phys. Rept. 532 (2013) 119,arXiv:1302.3415 [hep-ex].
The ATLAS Collaboration
G. Aad85, B. Abbott113, J. Abdallah152, S. Abdel Khalek117, O. Abdinov11, R. Aben107, B. Abi114, M. Abolins90, O.S. AbouZeid159, H. Abramowicz154, H. Abreu153, R. Abreu30, Y. Abulaiti147a,147b, B.S. Acharya165a,165b,a, L. Adamczyk38a, D.L. Adams25,
J. Adelman108, S. Adomeit100, T. Adye131, T. Agatonovic-Jovin13a,
J.A. Aguilar-Saavedra126a,126f, M. Agustoni17, S.P. Ahlen22, F. Ahmadov65,b,
G. Aielli134a,134b, H. Akerstedt147a,147b, T.P.A. Åkesson81, G. Akimoto156, A.V. Akimov96, G.L. Alberghi20a,20b, J. Albert170, S. Albrand55, M.J. Alconada Verzini71, M. Aleksa30, I.N. Aleksandrov65, C. Alexa26a, G. Alexander154, G. Alexandre49, T. Alexopoulos10, M. Alhroob113, G. Alimonti91a, L. Alio85, J. Alison31, B.M.M. Allbrooke18, L.J. Allison72, P.P. Allport74, A. Aloisio104a,104b, A. Alonso36, F. Alonso71, C. Alpigiani76,
A. Altheimer35, B. Alvarez Gonzalez90, M.G. Alviggi104a,104b, K. Amako66,
Y. Amaral Coutinho24a, C. Amelung23, D. Amidei89, S.P. Amor Dos Santos126a,126c, A. Amorim126a,126b, S. Amoroso48, N. Amram154, G. Amundsen23, C. Anastopoulos140, L.S. Ancu49, N. Andari30, T. Andeen35, C.F. Anders58b, G. Anders30, K.J. Anderson31, A. Andreazza91a,91b, V. Andrei58a, X.S. Anduaga71, S. Angelidakis9, I. Angelozzi107, P. Anger44, A. Angerami35, F. Anghinolfi30, A.V. Anisenkov109,c, N. Anjos12, A. Annovi47, A. Antonaki9, M. Antonelli47, A. Antonov98, J. Antos145b, F. Anulli133a, M. Aoki66, L. Aperio Bella18, R. Apolle120,d, G. Arabidze90, I. Aracena144, Y. Arai66, J.P. Araque126a, A.T.H. Arce45, F.A. Arduh71, J-F. Arguin95, S. Argyropoulos42, M. Arik19a,
A.J. Armbruster30, O. Arnaez30, V. Arnal82, H. Arnold48, M. Arratia28, O. Arslan21, A. Artamonov97, G. Artoni23, S. Asai156, N. Asbah42, A. Ashkenazi154, B. Åsman147a,147b, L. Asquith150, K. Assamagan25, R. Astalos145a, M. Atkinson166, N.B. Atlay142,
B. Auerbach6, K. Augsten128, M. Aurousseau146b, G. Avolio30, B. Axen15, G. Azuelos95,e, Y. Azuma156, M.A. Baak30, A.E. Baas58a, C. Bacci135a,135b, H. Bachacou137,
K. Bachas155, M. Backes30, M. Backhaus30, E. Badescu26a, P. Bagiacchi133a,133b, P. Bagnaia133a,133b, Y. Bai33a, T. Bain35, J.T. Baines131, O.K. Baker177, P. Balek129, F. Balli137, E. Banas39, Sw. Banerjee174, A.A.E. Bannoura176, H.S. Bansil18, L. Barak173, S.P. Baranov96, E.L. Barberio88, D. Barberis50a,50b, M. Barbero85, T. Barillari101,
M. Barisonzi176, T. Barklow144, N. Barlow28, S.L. Barnes84, B.M. Barnett131, R.M. Barnett15, Z. Barnovska5, A. Baroncelli135a, G. Barone49, A.J. Barr120, F. Barreiro82, J. Barreiro Guimarães da Costa57, R. Bartoldus144, A.E. Barton72, P. Bartos145a, V. Bartsch150, A. Bassalat117, A. Basye166, R.L. Bates53, S.J. Batista159, J.R. Batley28, M. Battaglia138, M. Battistin30, F. Bauer137, H.S. Bawa144,f,
J.B. Beacham110, M.D. Beattie72, T. Beau80, P.H. Beauchemin162, R. Beccherle124a,124b, P. Bechtle21, H.P. Beck17,g, K. Becker120, S. Becker100, M. Beckingham171, C. Becot117, A.J. Beddall19c, A. Beddall19c, S. Bedikian177, V.A. Bednyakov65, C.P. Bee149,
L.J. Beemster107, T.A. Beermann176, M. Begel25, K. Behr120, C. Belanger-Champagne87, P.J. Bell49, W.H. Bell49, G. Bella154, L. Bellagamba20a, A. Bellerive29, M. Bellomo86, K. Belotskiy98, O. Beltramello30, O. Benary154, D. Benchekroun136a, K. Bendtz147a,147b, N. Benekos166, Y. Benhammou154, E. Benhar Noccioli49, J.A. Benitez Garcia160b, D.P. Benjamin45, J.R. Bensinger23, S. Bentvelsen107, D. Berge107,
E. Bergeaas Kuutmann167, N. Berger5, F. Berghaus170, J. Beringer15, C. Bernard22, P. Bernat78, C. Bernius110, F.U. Bernlochner21, T. Berry77, P. Berta129, C. Bertella83, G. Bertoli147a,147b, F. Bertolucci124a,124b, C. Bertsche113, D. Bertsche113, M.I. Besana91a, G.J. Besjes106, O. Bessidskaia147a,147b, M. Bessner42, N. Besson137, C. Betancourt48, S. Bethke101, W. Bhimji46, R.M. Bianchi125, L. Bianchini23, M. Bianco30, O. Biebel100, S.P. Bieniek78, K. Bierwagen54, M. Biglietti135a, J. Bilbao De Mendizabal49, H. Bilokon47, M. Bindi54, S. Binet117, A. Bingul19c, C. Bini133a,133b, C.W. Black151, J.E. Black144, K.M. Black22, D. Blackburn139, R.E. Blair6, J.-B. Blanchard137, T. Blazek145a, I. Bloch42, C. Blocker23, W. Blum83,∗, U. Blumenschein54, G.J. Bobbink107, V.S. Bobrovnikov109,c, S.S. Bocchetta81, A. Bocci45, C. Bock100, C.R. Boddy120, M. Boehler48, T.T. Boek176, J.A. Bogaerts30, A.G. Bogdanchikov109, A. Bogouch92,∗, C. Bohm147a, V. Boisvert77, T. Bold38a, V. Boldea26a, A.S. Boldyrev99, M. Bomben80, M. Bona76, M. Boonekamp137, A. Borisov130, G. Borissov72, M. Borri84, S. Borroni42, J. Bortfeldt100, V. Bortolotto60a, K. Bos107, D. Boscherini20a, M. Bosman12, H. Boterenbrood107, J. Boudreau125,
J. Bouffard2, E.V. Bouhova-Thacker72, D. Boumediene34, C. Bourdarios117, N. Bousson114, S. Boutouil136d, A. Boveia31, J. Boyd30, I.R. Boyko65, I. Bozic13a, J. Bracinik18, A. Brandt8, G. Brandt15, O. Brandt58a, U. Bratzler157, B. Brau86, J.E. Brau116, H.M. Braun176,∗, S.F. Brazzale165a,165c, B. Brelier159, K. Brendlinger122, A.J. Brennan88, R. Brenner167, S. Bressler173, K. Bristow146c, T.M. Bristow46,
D. Britton53, F.M. Brochu28, I. Brock21, R. Brock90, J. Bronner101, G. Brooijmans35, T. Brooks77, W.K. Brooks32b, J. Brosamer15, E. Brost116, J. Brown55,
P.A. Bruckman de Renstrom39, D. Bruncko145b, R. Bruneliere48, S. Brunet61, A. Bruni20a, G. Bruni20a, M. Bruschi20a, L. Bryngemark81, T. Buanes14, Q. Buat143, F. Bucci49, P. Buchholz142, A.G. Buckley53, S.I. Buda26a, I.A. Budagov65, F. Buehrer48, L. Bugge119, M.K. Bugge119, O. Bulekov98, A.C. Bundock74, H. Burckhart30, S. Burdin74,
B. Burghgrave108, S. Burke131, I. Burmeister43, E. Busato34, D. Büscher48, V. Büscher83, P. Bussey53, C.P. Buszello167, B. Butler57, J.M. Butler22, A.I. Butt3, C.M. Buttar53, J.M. Butterworth78, P. Butti107, W. Buttinger28, A. Buzatu53, M. Byszewski10, S. Cabrera Urbán168, D. Caforio20a,20b, O. Cakir4a, P. Calafiura15, A. Calandri137, G. Calderini80, P. Calfayan100, L.P. Caloba24a, D. Calvet34, S. Calvet34,
R. Camacho Toro49, S. Camarda42, D. Cameron119, L.M. Caminada15,
R. Caminal Armadans12, S. Campana30, M. Campanelli78, A. Campoverde149, V. Canale104a,104b, A. Canepa160a, M. Cano Bret76, J. Cantero82, R. Cantrill126a, T. Cao40, M.D.M. Capeans Garrido30, I. Caprini26a, M. Caprini26a, M. Capua37a,37b, R. Caputo83, R. Cardarelli134a, T. Carli30, G. Carlino104a, L. Carminati91a,91b,
S. Caron106, E. Carquin32a, G.D. Carrillo-Montoya146c, J.R. Carter28, J. Carvalho126a,126c, D. Casadei78, M.P. Casado12, M. Casolino12, E. Castaneda-Miranda146b, A. Castelli107, V. Castillo Gimenez168, N.F. Castro126a, P. Catastini57, A. Catinaccio30, J.R. Catmore119, A. Cattai30, G. Cattani134a,134b, J. Caudron83, V. Cavaliere166, D. Cavalli91a,
M. Cavalli-Sforza12, V. Cavasinni124a,124b, F. Ceradini135a,135b, B.C. Cerio45, K. Cerny129, A.S. Cerqueira24b, A. Cerri150, L. Cerrito76, F. Cerutti15, M. Cerv30, A. Cervelli17, S.A. Cetin19b, A. Chafaq136a, D. Chakraborty108, I. Chalupkova129, P. Chang166, B. Chapleau87, J.D. Chapman28, D. Charfeddine117, D.G. Charlton18, C.C. Chau159,