I
The influence of Augmented Reality
on Consumers’ Online Purchase
Intention:
The Sephora Virtual Artist Case
MICHAELA SANTULLI
Dissertation written under the supervision of Nuno Crispim
Dissertation submitted in partial fulfilment of requirements for the MSc in
Management at Universidade Católica Portuguesa and for the MSc in Marketing
III
ABSTRACT
Title: “The influence of Augmented Reality on Consumers’ Online Purchase
Intention: The Sephora Virtual Artist Case”
Author: Michaela Santulli
The advent of digitalization lead to the change of many business models and it
has had a particular impact on retail. Indeed, brands are experimenting new ways
to respond to consumers’ needs, blurring digital and physical experiences. An
answer to this is Augmented Reality (AR) and it can be implemented in
companies’ online platforms.
This dissertation relies on studying this phenomenon through Sephora Virtual
Artist, an e-commerce platform with AR features launched by the company. This
research analyses if this technology can contribute to an e-commerce business in
the cosmetic industry, through an experimental design comparing consumers’
responses to the Sephora 2D traditional website to Sephora Virtual Artist.
From the outcome of the study, it was possible to affirm that AR could be a
successful strategy for beauty companies that want to increment the performances
of their online channels. Moreover, the main drivers of Online Purchase Intention
were identified, and a specific target as well. The collected data might contribute
for companies of the beauty industry whether to decide or not to invest in
Augmented Reality and how to implement it. Moreover, it might also help brand
managers communicating in the right way, to the right target and on the right
channel.
Keywords: Augmented Reality, E-commerce, Sephora, Innovations, Cosmetic
IV
RESUMO
Título: “A influência da Realidade Aumentada na Intenção de Compra On-line
do Consumidor: O Caso da Artista Virtual Sephora”
Autora: Michaela Santulli
O advento da digitalização leva à mudança de muitos modelos de negócios e tem
um impacto particular no retalho. De fato, as marcas estão a experimentar novas
maneiras de responder às necessidades dos consumidores, fundindo as
experiências digitais e físicas. A Realidade Aumentada (RA) é uma resposta para
isso e pode ser implementada nas plataformas online das empresas.
Esta dissertação baseia-se no estudo desse
fenómeno
através da Sephora Virtual
Artist, uma plataforma de e-commerce com recursos de RA lançados pela
empresa. Esta pesquisa analisa se esta tecnologia pode contribuir para um negócio
de e-commerce na indústria cosmética, através de um projeto experimental
comparando as respostas dos consumidores do site tradicional da Sephora 2D aos
da Sephora Virtual Artist.
A partir do resultado do estudo, foi possível afirmar que a RA pode ser uma
estratégia bem-sucedida para empresas de beleza que desejem incrementar o
desempenho de seus canais online. Além disso, os principais fatores de sucesso
para a plataforma foram identificados bem como o seu
público
alvo.
Os dados recolhidos podem contribuir para que empresas do setor de beleza
decidam ou não investir em Realidade Aumentada e como implementá-la. Além
disso, também pode ajudar os gerentes de marca a comunicarem da maneira certa,
para o
público
certo e no canal certo.
Palavras-Chave: Realidade Aumentada, E-commerce, Sephora, inovações
,
V
ACKNOWLEDGMENTS
First of all, I would like to express my gratitude to my advisor Nuno Crispim for
his essential help, his support and his constant availability.
To my parents for making this possible and for giving me the possibility to
always follow my dreams.
To my grandpa, for always being my number one supporter.
To my brother for always being a guide in these last years.
To Edoardo, thanks to whom I did not crazy over this thesis. For always
believing in myself even when I did not.
VI
TABLE OF CONTENTS
CHAPTER 1: INTRODUCTION ... 1
1.1 BACKGROUND ... 1
1.2 AIM OF THE STUDY AND RESEARCH QUESTIONS: ... 1
1.3 RESEARCH METHODOLOGY ... 2
1.4 ACADEMIC AND MANAGERIAL RELEVANCE... 2
1.5 DISSERTATION OUTLINE ... 3
CHAPTER 2: LITERATURE REVIEW ... 4
2.1 AUGMENTED REALITY: ... 4
2.1.1 DEFINITION AND CHARACTERISTICS ... 4
2.1.2 ORIGINS AND EMERGENCE: ... 5
2.1.3 AR FIEDS OF APPLICATIONS ... 6
2.1.4 AR IN ENTERTAINMENT, EDUCATION AND HEALTH ... 6
2.1.5 AR IN MARKETING ... 7
2.2 AR IN THE BEAUTY INDUSTRY: VIRTUAL MIRRORS ... 8
2.3 CASE STUDY: SEPHORA VIRTUAL ARTIST APP... 10
2.3.1 OVERVIEW OF SEPHORA ... 10
2.3.2 SEPHORA VIRTUAL ARTIST: ... 10
2.4 THEORETICAL BACKGROUND: ... 12
2.4.1 ONLINE PURCHASE INTENTION ... 12
2.4.2 ATTITUDE TOWARD THE BRAND... 12
2.4.3 ONLINE TRUST ... 13
2.4.4 PERCEIVED VALUE ... 13
2.4.5 PERCEIVED RISK BARRIERS ... 14
VII
2.4.7 INVOLVEMENT INTO PRODUCT CATEGORY ... 14
2.4.8 TECHNOLOGY ADOPTION PROPENSITY ... 15
2.4.9 INDIVIDUAL INNOVATIVENESS ... 15
2.5 RESEARCH MODEL ... 15
2.5.1 PROPOSED FRAMEWORK: ... 16
CHAPTER 3: METHODOLOGY ... 17
3.1 QUALITATIVE RESEARCH: IN DEPTH-INTERVIEWS ... 17
3.2 QUANTITATIVE RESEARCH: ONLINE SURVEY ... 18
CHAPTER 4: RESULTS AND DISCUSSION ... 20
4.1 QUALITATIVE ANALYSIS ... 20
4.2 QUANTITATIVE ANALYSIS ... 22
4.2.1 SAMPLE CHARACTERIZATION: ... 22
4.2.2 CONSTRUCT VALIDITY AND RELIABILITY: ... 23
4.2.3 PAIRED SAMPLE T-TEST: ... 24
4.2.4 CORRELATIONS: ... 25
4.2.5 MULTIPLE LINEAR REGRESSION... 26
4.2.6 CORRELATIONS: ... 30
4.2.7 CLUSTER ANALYSIS ... 31
CHAPTER 5: DISCUSSION AND LIMITATIONS ... 37
5.1 DISCUSSION ... 37
5.2 MANAGERIAL IMPLICATIONS ... 39
5.3 LIMITATIONS AND FURTHER RESEARCH ... 40
APPENDICES ... 41
1
CHAPTER 1: INTRODUCTION
1.1 BACKGROUND
Augmented Reality (AR) is a new interactive technology applied to several fields. One emerging application of AR is in the cosmetic industry, as this sector is very dynamic in its nature. Indeed, this industry has a very rapid pace compared to other sectors as luxury and fashion, and it is the ideal incubator for innovations.
Thus, globalization completely changed retail rules due to an increase of competition that posed new challenges to companies. Consequently, marketers are forced to come up with new strategies to satisfy the new consumers’ changing needs (Srinivasan & Srivastava, 2010). Consequently, an increase in the delivering of experiences is evident, modifying the entire retail environment (Backstrom & Johansson, 2006; Srinivasan & Srivastava, 2010). More in particular, e-commerce environments need to be enhanced with experiences in order to be more appealing for customers and to provide them with a seamless and interactive experience. A potential response to this could be the introduction of Augmented Reality to online platforms. Indeed, this technology could be used to drive sales on this channel. Indeed, in the digital word, the key to success is not only delivering good products, but also delivering in an enjoyable way, especially in the beauty industry. This interactive technology could be a differentiating factor in a cosmetic company’s digital strategy.
Little is still known about the commercial applications of Augmented Reality and more in particular about how consumers respond to this new technology (Javornik, 2016). Moreover, there is a lack of research about this topic applied to the cosmetic industry.
1.2 AIM OF THE STUDY AND RESEARCH QUESTIONS:
This dissertation aims to reveal the potentialities of AR to improve e-commerce performances, analysing consumers’ responses to this technology. Moreover, a segmentation of potential consumers’ will be done to target AR to the right group of people and to maximize its value. To do this, I will use Sephora Virtual Artist website, comparing it with the traditional 2D
2 order to understand if applying AR features on their websites could be a successful strategy to increase their online performances. Therefore, the problem statement is the following:
How can AR contribute to e-commerce platforms in the cosmetic industry?
The problem statement is divided in the following research questions (RQ) to better structure the final managerial implications:
RQ1: Does the use of Sephora Virtual Artist affect consumers’ online purchase intention? RQ2: if so, what can explain the possible change of online purchase intention when
experiencing Sephora Virtual Artist’s AR features?
RQ3: What types of consumers best respond to AR website features?
1.3 RESEARCH METHODOLOGY
In this work, both primary and secondary data were used in order to completely answer the research questions. Indeed, the first part of the analysis was constituted by secondary research: articles from scientific papers, journals, books and articles from past studies in this field. This analysis was necessary to have a clear understanding of the topic.
After, primary data were collected. Firstly, a qualitative research was conducted though in-depth interviews with a sample of Italian women. This analysis had the objective to deliver the basis for the quantitative analysis. Finally, the results of the quantitative online survey were analysed from a statistical point of view in order to answers the research questions and to derive meaningful managerial implications.
1.4 ACADEMIC AND MANAGERIAL RELEVANCE
From this research I expect to provide new insights on consumers’ responses to Augmented Reality platforms in the beauty industry. Furthermore, the main goal of this work is to understand if Augmented Reality could be a successful investment for beauty companies to improve their digital strategies. This work will be focused on Sephora Virtual Artist, but the results are generalizable to every brand of the cosmetic industry interested in the technology.
3 Moreover, the results of this work may also help the marketing departments of beauty companies to understand what may drive consumers to use AR and what target of people they should address.
1.5 DISSERTATION OUTLINE
Chapter 2 addresses the literature review, necessary to a primary understanding of the topic.
Moreover, the conceptual framework is described.
Chapter 3 presents the methodology used for the primary researches and the research design.
Chapter 4 includes the results of the two research methods: qualitative and quantitative.
Chapter 5 addresses the conclusions of the research, the managerial implications and limitation
4
CHAPTER 2: LITERATURE REVIEW
2.1 AUGMENTED REALITY:
2.1.1 DEFINITION AND CHARACTERISTICS
Augmented reality (AR) is a new trend of the digital world and it enhances the user’s perception and interaction with the real world. It has been widely investigated in the computer technology and human-computer interaction fields (Javornik, 2016) and three most accepted definitions are recognized:
Azuma et al. (2001)
“Any system that has the following three characteristics:
• Combines real and virtual objects in a real environment; • Runs interactively and in real time;
• Register real and virtual objects with each other.”
Reitmayr and Drummond (2006)
“A promising user interface technique for mobile, wearable computing and location-based systems.”
Carmigniani et al. (2011)
“A time direct or indirect view of a physical real-world environment that has been” enhanced/augmented by adding virtual computer- generated information to it.
Moreover, five different media characteristics of AR had been identified in these definitions:
interactivity, virtuality, geolocation feature (or location specificity), mobility and synchronization of the virtual and physical world (Javornik, Augmented reality: Research
agenda for studying the impact of its media characterstics on consumer behaviour, 2016). Augmented Reality aims at a simplification of the user’s life bringing virtual information to his real world. (Carmigniani, Furht, Anisetti, & Ceravolo, 2011). This emerging technology has varied opportunities of applications. Indeed, it is important to consider that AR is not limited to the sense of sight and it is not limited to specific displays technologies. Moreover, it can be
6
Sensorama. Even though this machine is one of the earliest examples of immersive and
multi-sensory technologies, it never really took off and it was always stalled in the prototype stage due to a lack of investors (Turi, 2014). In 1990s, Tom Caudell and David Mizell from Boeing aeronautical company were the first ones coining the phrase “augmented reality” and they started discussing its advantages (Carmigniani, Furht, Anisetti, & Ceravolo, 2011). Regardless of this, AR applications have just been confined in labs or art exhibitions due to their high costs. Only in the last decade, several technological advancements, as smartphone AR browsers or tracking devices, speeded up the development of AR systems and made these technologies accessible to individuals too (Rouse, Enberg, JafariNaimi, & Bolter, 2015; Carmigniani, Furht, Anisetti, & Ceravolo, 2011).
In the last years these new technologies are attiring many colossal companies due to their high potential. For example, the national newspaper The Guardian published an article, “Augmented
reality: Apple and Google’s next battleground”, where Gibbs (2017) stated that these two giants
are investing in this technology to provide the masses with AR. CEO of Apple affirmed that AR “is going to change everything” and that he clearly sees how small and large businesses could exploit their productivity through AR apps (Strange, 2017). Indeed, Apple is not the only one betting on the technology but other companies, as Facebook, HTC and Intel, are aggressively investing in it (Molla, 2017).
2.1.3 AR FIEDS OF APPLICATIONS
As already stated, AR can be used in many innovative ways and four main areas of application can be identified: entertainment, education, health and marketing. Indeed, this technology may be used to directly create a whole new service or to bring better or cheaper alternatives in some areas (Carmigniani, Furht, Anisetti, & Ceravolo, 2011).
2.1.4 AR IN ENTERTAINMENT, EDUCATION AND HEALTH
AR was created firstly for the entertainment industry and this is why companies and researchers of this field have been highly interested in the technology. Indeed, many AR gaming apps already exist; they use the real-world environment to create a playing field with it. (Rouse M. , 2016). The most famous example that reached high popularity with consumers is Pokémon
7
GO, which is considered the breakthrough application for AR gaming. Indeed, the application
combines the real world and with the Pokémon creatures using a smartphone camera, the GPS and clock (Warner, 2016).
In the education area, AR can be used in several ways from enhancing museums experiences to increase the effectiveness of teaching in schools. For example, there are already a few systems exploiting AR technologies for museums visits, using mobile phones as interphases that can benefit the customers with efficient communications through multimedia presentations and at the same time they do not require excessive investments from the institutions (Carmigniani, Furht, Anisetti, & Ceravolo, 2011). However, AR has not reached its potential to enter these areas (Carmigniani, Furht, Anisetti, & Ceravolo, 2011) and there are still many opportunities for introducing AR in didactic environments. To do this, educators and researches should work together in order to explore possible opportunities (Billinghurst, 2002).
Most of the applications in the medical field are about image guided and robot-assisted surgery; consequently, studies have been made to incorporate AR in these two main activities (Carmigniani, Furht, Anisetti, & Ceravolo, 2011). Moreover, two other areas where AR could be implemented are treating phobias and developing augmented reality exposure-based therapies (Oliver & Bouchard, 2014). Even in this area AR did not reach its potential and increasing AR applications are being discovered (Carmigniani, Furht, Anisetti, & Ceravolo, 2011).
2.1.5 AR IN MARKETING
The application of AR in marketing is relatively new but it is increasingly gaining importance in the field. One of the first examples of this is MINI, famous brand of the automotive industry, that in December 2008 ran an AR advertisement in many car magazines. The reader had to go on the brand website, show the paper ad in front of the computer webcam and a tridimensional version of the car appeared on the screen. This was a way of turning a static advertising on a magazine into an interactive experience (Carmigniani, Furht, Anisetti, & Ceravolo, 2011). Since then, there was an increase of the presence of these kinds of simulations of products in a physical space (Javornik, Rogers, Mutinho, & Freeman, 2016). An example of this are furniture brands, like Ikea, that through mobile apps allow users to imagine how the pieces of furniture would look like in the surrounding space of their houses. Moreover, companies as LogoGrab or Aurasma have developed mobile applications that allowed consumers to see products in 3D
8 pop-ups and other visual contents. Other applications of AR in marketing are the interactive displays and mirrors both in the retail environment (Javornik, Rogers, Mutinho, & Freeman, 2016) and on their online platforms or mobile applications. For instance, Burberry introduced a “Digital Runway Nail Bar” in its concept stores that enabled consumers to try on the different nails shades with AR. Another example is Converse that developed an app to enable users to virtually try on several models of shoes (Watson, Alexander, & Salavati, 2018).
As these examples show, AR has the potential to develop and expand the brand communications to better engage customers to the brand (Baratali, Abdrahim, Parhizkar, & Gebril, 2016). Moreover, AR is a very powerful tool and companies should exploit it to gain their customers attention (Baratali, Abdrahim, Parhizkar, & Gebril, 2016). Indeed, due to its potential in this area, many researchers have started studying and investigating the impacts of AR in marketing. There is an increasing interest in this technology’s potential to deliver appealing experiences to the consumers in the retail contexts, both online and offline (Javornik, Rogers, Mutinho, & Freeman, 2016). Indeed, nowadays AR in marketing started to receive increasing attention because of its potential to deliver an enhanced consumer experience (Javornik, Rogers, Mutinho, & Freeman, 2016). For these reasons, in my research I am going to focus on the applications of AR in marketing, more in particular in the online retail context. In order to do this, it is necessary to overview the latest transformations in this environment.
2.2 AR IN THE BEAUTY INDUSTRY: VIRTUAL MIRRORS
Image Interactive Technology (IIT) is a technology used in order to improve virtual experiences,
enabling users to have access to enriched product information. IIT is being used by some e-commerce websites, but it surely represents the future of “online consumer marketing”. Three kinds of IIT can be recognized: 3D product visualization, mix-and-match and 3D try-on (Merle, Senecal, & St-Onge, 2012). In this study, I am going to focus on the last ones, also called virtual
mirrors. This specific technology is one of the latest innovation in the Augmented Reality
world, but it’s becoming widely available in the online retail environment (Javornik, Rogers, Mutinho, & Freeman, 2016; Kim & Forsythe, 2008). This technology “can include any 2D or
3D interactive image technology that essentially allows consumers to construct personalized virtual models to try on products in a virtual setting” (Cho & Schwarz, 2012: pp. 236).
9 One of the first forms of virtual mirrors allows the users to select a model that resemble their body shape, skin color and other physical characteristics. A further variation of this one lets consumer build a model that is a “virtual proxy” of themselves and that they can manipulate. The latest variation of this allows consumers to try on products utilizing the consumer’s own image (3D or 2D), letting them see how they would look with a certain cosmetic, apparel peace or model of glasses (Cho & Schwarz, 2012; Javornik, Rogers, Mutinho, & Freeman, 2016). The virtual try-on technology has high potential of affecting the online shopping experience, since it can deliver information about products that are similar to the ones obtained in direct contact with the items (Kim & Forsythe, 2008). This technology allows consumers to receive product information as if they were in a brick and mortar store with direct product trials, zooming product features, rotating the product and trying the product on themselves (Kim & Forsythe, 2008).
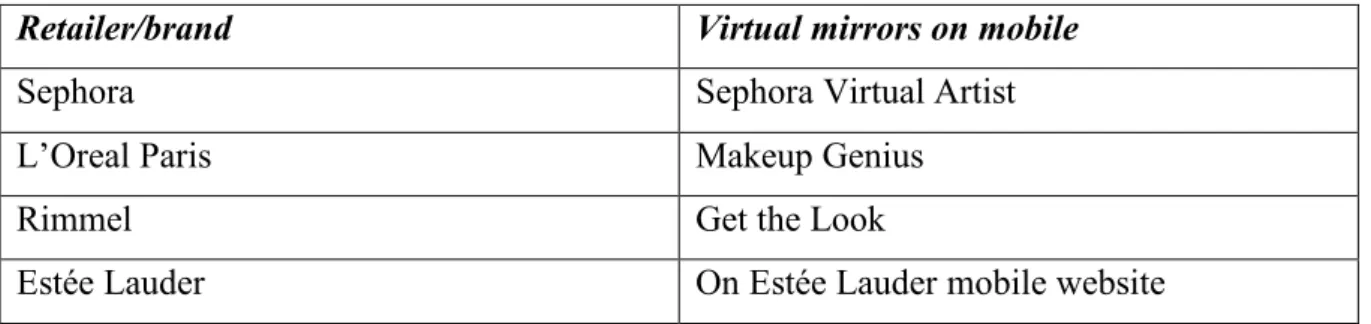
Virtual mirrors mobile features can be extremely useful for industries where the main barrier to online shopping is the lack of product trials. Indeed, even if AR and the beauty industry seem like two contrasting concepts, this technology has the potential to revolutionize the industry, as many players are adopting virtual mirrors to attract more consumers (GlobalData Retail , 2017). As shown in figure 2, the main brands that have established websites or mobile applications with virtual mirrors are Sephora, L’Oreal Paris, Rimmel and Estée Lauder. Some others, as
MAC or Coty, are implementing Virtual Mirrors technologies in their physical stores, but they
still don’t have plans to create AR features on their e-commerce platform to implement online sales.
Figure 2: Brands of the beauty industry offering AR mobile technologies
Retailer/brand Virtual mirrors on mobile
Sephora Sephora Virtual Artist
L’Oreal Paris Makeup Genius
Rimmel Get the Look
Estée Lauder On Estée Lauder mobile website
Source: personal research
As some brands are investing on Augmented Reality features, the question is more relevant than ever: is AR having an impact on the brands’ performances?
10 2.3 CASE STUDY: SEPHORA VIRTUAL ARTIST APP
2.3.1 OVERVIEW OF SEPHORA
Sephora is a leader in the cosmetic retail, earning its reputation through its expertise, innovation and entrepreneurial spirit. Indeed, it has been a pioneer in experiential retailing since its foundation in France in 1969. From 1997 the company is part of the group LVMH Moët Hennessy Louis Vuitton, leader in the luxury sector. A year after the acquisition, Sephora expands to North America, with a model revolutionizing the beauty industry. Today, the company counts 430 stores in the Americas, including the USA, Canada, Mexico and Brazil, and 600 stores in Europe. Nowadays, it has the plan to expand its network of stores worldwide, especially in the U.S. and in China.
Sephora’s concept is to provide a beauty dedicated store where it is possible to find different brands: from the more classic ones to the more original ones. Moreover, all the Sephora stores provide consumers with the access to many services such as make-up classes, beauty consulting and other free cosmetic treatments. At Sephora, clients have the opportunity to see and test 14,000 products from 200 brands.
Moreover, as Mary Beth Laughton, Sephora’s executive vice president of omni retail, stated: “Digital and innovation have always been part of our DNA at Sephora” (DeNisco Rayome, 2018). The company has always been very reactive on innovations and has a strong focus on the digital word to enhance the consumer experience. Indeed, the Sephora in 2015 launched its
Sephora’s Innovation Lab, where marketing, product development and tech executives work to
develop new innovative digital offerings to improve the shopping experience (www.sephora.it 8/09/2018)
2.3.2 SEPHORA VIRTUAL ARTIST:
Sephora Virtual Artist is a feature of the Sephora application and website introduced in 2016. Sephora worked with ModiFace for 5 years to launch this feature on its online platforms, a company that create Augmented Reality tech for beauty brands (www.modiface.com 8/09/2018). When Sephora realized that the technology was sufficiently precise and high quality, it realized that it could impact their business (DeNisco Rayome, 2018). Since its launch in 2016, Sephora and ModiFace every four months add more innovative features in the application.
11 The Augmented Reality features are the following:
1. Product Try-On; this function enables customers to virtually try on eye, lip and cheek makeup, in many different colors and palettes. They can then save their favorite combinations in “My Looks” and share them with friends.
2. Looks; consumers may get inspired by specific looks created by experts and try them on themselves. The different groups are divided by category (daytime, trend, night time and natural).
3. Virtual Tutorials; customers can learn new techniques by professionals step-by-step straight on their faces.
4. Color Match; users can find the perfect makeup shades that match an outfit, an accessory or a celebrity look.
5. Swatch me; a virtual arm swatch is available to try and compare hundreds of shades instantly.
Moreover, using these features users are able to get more information on the specific products, save their favorite products, filter the research by brands and by color IQ number, access to product ratings and reviews, and buy the products straight from the app or website.
These AR features are available in two different online platforms: the website and the mobile application. For this study I chose to consider Sephora Virtual Artist in its website version, in order to avoid consumers’ bias between the traditional website version and the mobile app. Indeed, consumers are driven by different motivations to use the app or the website and it would be imprecise to compare two different platforms (www.sephoravirtualartist.com 8/09/2018).
12 2.4 THEORETICAL BACKGROUND:
2.4.1 ONLINE PURCHASE INTENTION
In the last decade, the popularity of the internet has risen rapidly and it’s consequently affecting companies’ dynamics and the way they act. Indeed, the electronic commerce is one of the most peculiar characteristics of our era (Li & Zhang, 2002). The internet made it possible for consumers to be exposed to a substantial number of online retailers letting them to be able to choose between different deals. For this reason, it is necessary for companies to gain a competitive advantage in the digital environment (Ling, Siong, San, Hock, & Kian, 2010 ; Hong & Kim, 2012).
Online purchase intention has originated from purchase intention (Close & Kukar-Kinney, 2010) and it can be defined as the consumers’ willingness to buy a product or services via the internet (Li & Zhang, 2002). Indeed, in order to analyse consumers’ purchase behaviour of an online store, researchers started studying online purchase intention as a substitute of it. This variable needs to be explored as a predictor of consumers’ actual behaviour in an online environment (Lim, Osman, Salahuddin, Romle, & Abdullah, 2015). The study of it is extremely important as the lack of it is the main obstacle to the development of an online retail store (He, Lu, & Zhou, 2008).
2.4.2 ATTITUDE TOWARD THE BRAND
This variable is present in the models of many researchers due to its high importance in the study of consumers’ actions. Consequently, several definitions had been developed, but in this study attitude toward a brand will be considered as a lasting summary evaluation of the brand
that strengthens behavioural intentions (Machleit, Allen, & Madden, 1993). An attitude may
be generated through several ways: experiences with products, information retrieved from the media or from individuals (Le Roux & Maree, 2016). Moreover, Brand Attitude is a necessary component to analyse a brand’s equity and have a clearer vision of the strategy that needs to be adopted (Liu, Jianyao, Dick, & Huangting, 2012).
Thus, as the reported in the previous definition, brand attitude reinforces the probability of shopping behaviours and furthermore it can be considered one of the most important predictors of purchase intention (Abzari, Ghassemi, & Vosta, 2014) and therefore necessary to be included in this research.
13 2.4.3 ONLINE TRUST
Trust is a difficult concept to define since due to its multidimensionality. Rousseau et al. (1998) defined it as: “the psychological state comprising the intention to accept vulnerability based on positive
expectations of the intentions or behaviours of another” (Rousseau, Bitkin, Burt, & Camerer, 1998, p.
395).
Perceived trust is extremely important in the e-commerce environment since it helps consumers overcoming their uncertainties and to consequently participate in “trust-related behaviours” such as online purchases. Indeed, the luck of trust can block the development of an e-commerce development (McKnight, Choudhury, & Kacmar, 2002).For this reason, Trust is widely considered as a key driver in the adoption of new technologies and more in particular in engaging in e-commerce behaviours (Bhattacherjee, 2006). Indeed, the effect of trust of engaging in activities without having the total control makes it one of the most important pre-condition of e-commerce (Gefen, 2000).
2.4.4 PERCEIVED VALUE
In the latest years, perceived value has become a very important variable in consumers’ research and it has become an important pre-condition in order to reach a sustainable competitive advantage in the marketplace (Gamage & Ahsan, 2014). Indeed, in the marketing literature it is highly recognized that there is a link between perceived value and profits (Pura & Gummerus, 2007).
There are different definitions of perceived value and in this work I will consider it as the “customer’s assessment of the benefits of using a product/service based on experiences of use
that facilitate achieving the customer’s purpose in a specific use situation compared to other alternatives ” (Gamage & Ahsan, 2014). In this sense, customer value is determined by
potential clients’ perception and intentions (Khalifa, 2004).
Moreover, perceived value of online services is extremely different from tangible products, as other variables such as context and time specific dimensions play a role (Gummerus & Pihlstrom, 2011; Gamage & Ahsan, 2014). For these reasons, it is worth the study of it correlated to consumers’ behaviours in the online context to provide some indications on the conditions preferred by potential customers (Gamage & Ahsan, 2014).
14 2.4.5 PERCEIVED RISK BARRIERS
Perceived risk has been studied to explain consumers’ behaviours since the 1960s. It has been defined as “a function of the uncertainty about the potential outcomes of a behaviour and the
possible unpleasantness of these outcomes” (Forsythe & Shi, 2003, p. 869). Applying this
concept to online shopping, risk can be considered as every uncertain negative consequence rising from the of consumers’ activities online. This variable becomes extremely important to consider as consumers are not able to touch, feel and try a specific product in an online context. Indeed, researchers has long been considering perceived risk as a barrier to online behaviours and more in specific of purchase intention (Akram, 2018).
In my research I will focus on product performance risk which is defined as the damage that incur when consumers’ experience a brand or product that don’t perform as expected (Horton, 1976). This kind of risk in the online context can be translated as wrong product choices due to the inability to evaluate and examine the products on a website (Forsythe & Shi, 2003).
2.4.6 SEGMENTING CONSUMERS
The information and services provided by a website are not the only drivers to influence consumers’ behaviours. Indeed, it is very important to understand consumers’ preferences in order to maintain a strong relationship with them (Hong & Kim, 2012). Indeed, to maximize the value of customers, it is important to have different strategies (Chen, Zhang, & Fu, 2007). Thus, every consumer has a different preference and consequently customer segmentation benefits online stores with providing them with what they prefer (Hong & Kim, 2012). For this reason, researchers are extremely interested in the factors that affect consumers’ behaviours in order to segment them and consequently to maximize the expected profits (Hung & Tsai, 2008; Hong & Kim, 2012).
2.4.6.1 INVOLVEMENT INTO PRODUCT CATEGORY
Product involvement refers to the attachment to a certain product class (Drichoutis, Lazardis, & Nayga, 2007). Moreover, a person that is involved in a product category believes that this class meets important values or goals (Bruwer, 2012). Product involvement is particularly important as it explains part of consumers’ behaviour and more in particular purchase intention. As a matter of fact, the involvement into a product category differs among people and consequently they have different behaviours. Indeed, people with a higher product involvement have a longer choice process and a deeper product knowledge (Bruwer, 2012). It is clear how
15 the involvement into cosmetic products may influence the online purchase intention how it has to be considered in this research.
2.4.6.2 TECHNOLOGY ADOPTION PROPENSITY
The new world we are living in is full of new technologies and consequently consumers are obliged to live with these new dynamics. Moreover, more and more highly sophisticated products are being produced and the different consumers react differently to them (Parasuraman , 2000). Indeed, there is a transformation in the interaction between the consumers and companies (Pires, Cunha, & Costa, 2011). A scale that measures consumers’ tendency to adopt technologically advanced products may be developed (Bruner II, Kumar, & Heppner, 2007), in order to measure the different reactions of consumers.
Being Augmented Reality a new technologically advanced innovation, it is clear how different people could react differently to it and the “Technology Adoption Propensity” has to be measured to have a better comprehension on the topic.
2.4.6.3 INDIVIDUAL INNOVATIVENESS
Individual innovativeness may be defined as a disposition that determines how people react to any kind of innovations in their lives (Yi, Fiedler, & Park, 2006). Of course, a more positive level of this psychographics variable leads to a higher positive reaction to new products (Ali, 2018). In this research, this variable will be considered as an index about how people react to new ideas, new ways of doing things and invention. Moreover, the propensity to accept challenges, improvise and create ideas will be considered (Hurt, Joseph, & Cook, 1977). Individual innovativeness is always analysed in the context of innovations (Ali, 2018) and consequently it is important in this research to study the consumers’ different responses to AR technologies.
2.5 RESEARCH MODEL
After having reviewed the literature, a conceptual model is introduced to delineate the experiment of the research. The main goal of it is to compare Sephora Virtual Artist website (with AR) with Sephora traditional 2D website (no AR), in terms of consumers’ responses. In order to do this, the Online Purchase Intention is going to be measured in both of the websites and three main drivers are going to be studied for each model: Perceived Trust, Perceived Value and Perceived Risk Barriers. Moreover, in order to better analyse and compare consumers’
18 of online shopping in the cosmetic industry, its benefits and obstacles, and an initial understanding of consumers’ appreciation of the introduction of AR in a cosmetic online website.
The researcher applied just two criteria for the selection of the sample: females using and buying cosmetic products on a regular basis. Nonetheless, there were no other restrictions in order the have a wider perspective of the topic from different angles.
Six interviews were conducted either face to face or via phone. They took an average of 30 minutes each and were based on a half-standardised questionnaire. All of them have been recorded, under the respondents’ consent, and the anonymity was granted beforehand.
It was created a guide for these interviews, in order to assure to reach all of these topics:
1. Consumers’ shopping journey in the cosmetic industry
2. Online Shopping in the cosmetic industry: advantages and disadvantages 3. Attitudes towards AR in general
4. Presentation of Sephora Virtual Artist and overall impressions
The respondents were asked to talk about their behaviours in the decision-making process for cosmetic products and their preferences in terms of brands and shopping habits. Afterword’s, the conversation was shifted to online shopping for beauty products, highlighting its main advantages and disadvantages. In a further phase, the respondents were asked to answer some questions about their attitudes and interests towards Augmented Reality in general, whether they were informed or not about these new technologies and their Potential. Next, Sephora Virtual Artist and all its AR features were presented to the respondents and the researcher collected the first impressions and attitudes towards the site/app.
The results of these in-depth interviews were then used to develop the survey for the quantitative research.
3.2 QUANTITATIVE RESEARCH: ONLINE SURVEY
3.2.1 EXPERIMENT DESIGN
To precisely answer the research questions, a quantitative research has been adopted. Indeed, this kind of research is characterised by the use of statistical tools in order to provide an objective and reliable outlook on the topic studied (Neuman, 2014). I conducted an online
19 survey to test consumers’ different responses to Sephora Virtual Artist and to the 2D traditional website. The survey was developed through Qualtrics and spread through social media and emails. Pre-tests were conducted in order to perfect the final survey.
Through a statistical analysis I am going to measure the difference in the online purchase
intention of the two websites, considering its three main drivers (perceived trust, perceived value and perceived risk obstacles) and some behavioural and demographic variables.
To develop this research, an experiment design was developed using two different groups of respondents: the control group who had been exposed to Sephora 2D traditional website and the experimental group exposed to Sephora Virtual Artist. After having let the respondents browse the retailer’s websites, through the respective links, to get an idea of how they work, the questions of the survey were administered to the respondents. This way, I analysed and compared the responses of potential consumers to the two online e-commerce platforms.
20
CHAPTER 4: RESULTS AND DISCUSSION
.
4.1 QUALITATIVE ANALYSIS
From the 6 In-Depth interviews conducted, some insights about shopping habits in the cosmetic industry, AR technologies and attitudes towards Sephora Virtual Artist were developed in order to provide some information for the development of the quantitative research.
About the first set of questions of the in-depth interviews about the consumers’ shopping journey in the cosmetic industry, it emerged that most of the respondents purchase beauty products either when they finish their old ones or when they are exposed to external stimuli, as promotions, new launches or sponsorships by influencers. Moreover, one respondent differentiated between two specific categories of products: she stated that for make-up she is always willing to try new shades and new products, but when it comes to beauty-care, such as dermo-cosmetics, she just purchases the same products when the old ones are finished.
Thus, all of the respondents stated to enjoy shopping for cosmetic, especially when it comes to make-up.
Finally, when asked for their favourite brands in the industry every respondent named Sephora, one of the most-well brand in the industry.
In the second set of questions, the respondents were been asked about their shopping activities in the online and offline channel. Most of them shop both through online and physical stores but one main trend emerged: they prefer the online channel when they know exactly what they want and contrarily physical stores when they feel the need of looking for new products. When asked for advantages of online shopping, every respondent stated that the saving of time cause by not having to go to the physical store is the main advantage. Another plus named by more than one person was the fact that the whole assortment is always present on the online channel and that consequently every product is always available. When asking for the disadvantages of purchasing online cosmetic products, a homogeneous answer emerged: the impossibility of trying on the products, to feel textures and to test the different shades and how they look on the different skin colours.
In the third block of questions about general attitudes towards AR, every respondent knew about this new technology but just few of them actually tried it. Thus, a general interest and curiosity
21 emerged towards this new technology and its possible applications. Moreover, they all stated to be interested in this technology applied to online shopping to enhance their experience, but more than one respondent added that is extremely important that AR is technologically advanced and extremely effective in representing the reality.
In the last part of the in-depth interviews, Sephora Virtual Artist was presented, and all its features explained. Every respondent showed a strong interest and curiosity in the innovative characteristics of this new platform and stated it would help to enrich their shopping experience. At the same time, it emerged again that the technology needs to be very realistic and that otherwise they would rather shop offline avoiding the risk to purchase wrong products or shades.
Summarizing, the interviews complemented and added more information to the literature review, giving insights about this topic from a consumers’ point of view. The main leads are the followings:
- Consumers may be driven by different needs when shopping online or offline. They shop in physical stores when they want to “explore” and they shop online only when they look for a product that they already tried.
- One main obstacle to online shopping may have emerged: the impossibility to try-on the product before buying, feel the textures and try on the shades.
- The attitudes towards Augmented Reality were generally positive, but one concern arose in its application in online shopping: the necessity that AR technologies are the most advanced and as realist as possible.
- Sephora Virtual Artist was well accepted by the interviewees.
Taking into consideration the results of this qualitative analysis, the quantitative survey was developed. Indeed, some questions relative the variables were changed according to the responses from the in-depth interviews. In the “Perceived Risk Barriers” variable, the questions of the survey involved only risks related to the product, as emerged from the qualitative as the most relevant obstacle in purchasing online. Moreover, the variable “Perceived Value” was included in the model after this qualitative analysis, because almost every interviewee expressed that the most important thing when it comes to AR was the quality of the website and of the technology.
22 4.2 QUANTITATIVE ANALYSIS
4.2.1 SAMPLE CHARACTERIZATION:
Through the data collection period, a total of 428 responses were collected: 209 for the experimental group and 219 for the control group. Since it was required that the respondents answered every question to complete and send the survey, all these responses were therefore valid. At the beginning of the survey a screening was done through a question asking if the respondent had the possibility to browse the website through a computer (with a webcam for Sephora Virtual Artist). Consequently, the researcher discarded from the database the responses that were not able to navigate the websites: 11 responses for the experimental group and 4 responses for the control group. Consequently, the following statistical procedures was based on a sample of 209 respondents for the experimental group and on a sample of 215 for the control group.
During the data collection, one of the main objectives was to reach two homogenous samples in order to be able to compare the experimental and control group without significative bias. According to the “Age”, in the experimental group the 4% of the respondents were less than 18 years old, the 16.7% between 18 and 24 years old, the 34.8% between 25 and 30 years old, the 31.8% between 30 and 40 years old and the remaining 12.6% above 50 years old. In the control group, the results are consistent: the 2.3% of the respondents were less than 18 years old, the 12.1% between 18 and 24 years old, the 31.2% between 25 and 30 years old, the 36.7% between 30 and 40 years old and the remaining 17.7% above 50 years old. About the “Degree” of the respondents, the majority of the respondents of both groups have a bachelor’s degree (52.5% experimental group and 46.5% control group), followed by the people with a high school diploma (accordingly 31.3% and 32.6%). People with a master’s degree are just the 14.6% for the experimental group and 19.5% for the control group. The respondents that have a PhD are in extreme minority. After, about to the “Occupation”, 65.7% (experimental group) and 61.9% (control group) are employed, followed by students and by freelancer. There are a minority of housewives and unemployed people. Finally, about the “Place of Residence”, the majority of the two samples live in a City (57.1% for the experimental group and 55.8% for the control group), followed by people living in a town and again by people living in the countryside. The complete table with the demographics data for the experimental and control group can be found in Appendix D.
23 4.2.2 CONSTRUCT VALIDITY AND RELIABILITY:
To process the data from the experiment, several analyses were conducted with SPSS, in order to start answering the research questions. Firstly, an Exploratory Factor Analysis (EFA) was conducted. EFA is a multivariate technique which means that different variables are analysed together. It identifies groups of variables that present strong correlations within each other. Each of these groups identify a latent variable, not directly observable. This analysis’ main objective is to extract from each groups of items a new variable that can be used in the following analysis. The ultimate main goal is to provide a clear image that is the most effective as possible to describe the respondents’ responses and behavioural traits.
The primary step of conducting an Exploratory Factor Analysis (EFA) is the Principal Component Analysis (PCA). Before proceeding with the analysis, there are some criterions to be satisfied. The Kaiser-Meyer-Olkin (KMO), measuring the sampling adequacy, needs to be higher than the minimum value of 0.6 for the analysis to be consistent. In this case the KMO was 0,937 showing that the sample is adequate for the model. Moreover, the Barlett’s Test of
Sphericity is significant (0,000): there are at least two variables that are correlated. Finally, it is
important to control the communalities after the extraction because if they have low values, the items do not account for a consistent part of the variance. To evaluate the number of factors to take in consideration, the components with an Eigenvalue higher than 1 had been identified: in this case 9 variables. After, the Exploratory Factor Analysis (EFA) had been conducted (Appendix E) to identify the latent factors. To facilitate the interpretation, the factor loadings expressing a variance minor to 0.4 were suppressed. A rotation was performed, a procedure that rotate the factor to obtain a simple and interpretable structure. The rotation method chosen was Promax since the factors are correlated and therefore an oblique method was required. As shown in Appendix E, Hedonic perceived value and utilitarian perceived value were identified as a single item named “Perceived Value”. Moreover, in the scale Technology Propensity Index was divided into two named respectively: “Technology Expertise” and “Technology Pioneers
Index”. Indeed, the first variable represents the consumers’ capacities of using technological
devices. The second one represents the disposition and desire of people of being ahead of others when it comes to discovering high-tech items.
After, to test the new scales reliability the Cronbach’s Alfa was identified. This analysis aims at testing the internal consistency of the scales and the value has to be higher than the standard value of 0.7. In this study, the Cronbach’s Alfa values ranges was between 0.847 and 0.964,
24 showing a very strong consistency reliability. After, the Average Variance Extracted (AVE) was measured, which represents the variance captured by each construct relative to the total variance with error. Generally, it is an indicator of the latent factors have factorial and discriminant validity. It denotes that the latent factors identified represent the intended measures precisely. The AVE was calculated as such:
An AVE above 0.5 shows a reliable latent factor. As the following table shows, every variable shows a value above the minimum value of 0.5 but “Technology Expertise” with an AVE of 0.41. It was decided to keep this variable, since every other analysis performed did not present any out-of-range values.
The summary of the results of these analysis (Construct validity and Reliability) are shown in the appendix E.
This first analysis was done in order to answer to the first research question (RQ1), whether or not the use of Sephora Virtual Artist affect consumers’ purchase intention.
4.2.3 PAIRED SAMPLE T-TEST:
A paired sample t-test was conducted to determine the difference between the experimental and control group in the response to the platforms. Indeed, this analysis aims at testing the null hypothesis where the paired populations means are equal (H0: 𝜇 = 𝜇 ), with a confidence
interval percentage of 95%. Assuming that the two groups are similar, these scales considered are the means of all the items that make-up a scale. As shown in the table below representing the results of the paired sample t-test, the experimental group scored higher in the Online Purchase Intention dimension with a mean a 5.294 compared to a mean of 3.9804 of the control group with a difference of 1.31373 between the two. Moreover, the difference between the two groups in the Online Purchase Intention is significant (sig. 0.000) and the null hypothesis is discarded.
26
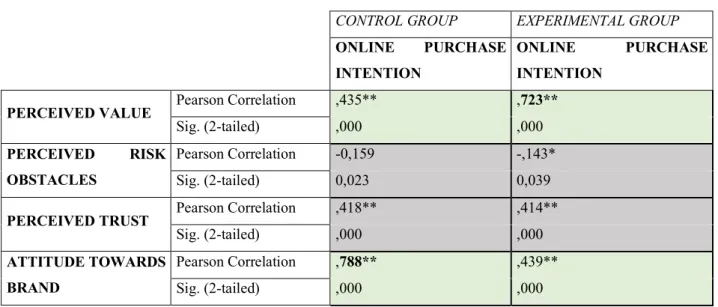
Perceived Risk Obstacles and Perceived Trust do not present any substantial difference in the
two groups. Contrarily, there is a significant difference between the correlation between
Perceived Value and Online Purchase Intention in the two groups: indeed, in the control group,
there is a correlation of 0,435 and in the experimental one of 0,723. There is a very strong correlation between the group that was exposed to Sephora Virtual Artist between the Perceived Value and the Purchase Intention. Furthermore, another difference can be found in the Attitude
Toward the Brand: indeed, the control group shows a very solid correlation of 0,788 and the
experimental one a moderate correlation of 0,439.
CONTROL GROUP EXPERIMENTAL GROUP
ONLINE PURCHASE INTENTION
ONLINE PURCHASE INTENTION
PERCEIVED VALUE Pearson Correlation ,435** ,723**
Sig. (2-tailed) ,000 ,000
PERCEIVED RISK OBSTACLES
Pearson Correlation -0,159 -,143*
Sig. (2-tailed) 0,023 0,039
PERCEIVED TRUST Pearson Correlation ,418** ,414**
Sig. (2-tailed) ,000 ,000
ATTITUDE TOWARDS BRAND
Pearson Correlation ,788** ,439**
Sig. (2-tailed) ,000 ,000
** Correlation is significant at the 0.01 level (2tailed). * Correlation is significant at the 0.05 level (2-tailed).
Figure 6: Pearson correlations between variables for experimental and control group
4.2.5 MULTIPLE LINEAR REGRESSION
To finalize the two models and compare them to each other, a multiple linear regression (MLR) was performed. In order to perform this analysis, the control and experimental group were assumed to be similar. This statistical technique aims at predicting a dependent variable (also called criterion) from other dependent variables (or predictors). MLR is an extension of a simple linear regression, as it includes several criterions to a single predictor. The equation representing a Multiple Linear Regression is the following:
27 In order to perform this analysis, the control and experimental group were assumed to be similar. In the model, Y corresponds to the dependent variable, x1 through xp are the
independent variables, b1 through bp their coefficients and b0 the value of the criterion if all the
predictors are equal to zero.
Before executing the regression, it is necessary to make several assumptions:
- There must be a linear relationship between the variables. In order to test it, the
scatterplots of these relationships were analysed (Appendix F): they all show a linear
relationship between the variables, in both groups.
- After, the multivariate normality of the variables involved in the model need to be tested, because multiple linear regression assumes that the errors between observed and predicted values are normally distributed. In order to do this, QQ plots were analysed (Appendix G) and normality was checked.
- Then, the absence of multicollinearity has to be tested. To do this the Variance Inflation
Factor (VIF) of the linear regressions needs to be calculated (1/1-R2). In both groups,
no multicollinearity was found, with a VIF < 10. In particular, the VIF of the experimental group was 2.55 and the one of the control group 3.246.
- Finally, the last assumption is the presence of homoscedasticity, meaning that the variances of error terms are similar across the values of the independent variables. To test this, the scatterplots between the dependent variable and the residuals were tested (Appendix H). In both groups homoscedasticity was found as all the residuals are equally distributed.
As the table below shows, in both models (experimental and control) three variables had been identified as predictors: Perceived Value, Perceived Trust and Attitude Toward the Brand. Indeed, they all have a significance level (α) below 0.05. The variable Perceived Risk Obstacles was excluded from both the models as it was not statistically significant with an α equal to 0,214. The null hypothesis was rejected and bp is different from zero. To determine the
goodness-of-fit of the two models the R Square needs to be analysed, which is the percentage of variation explained by the model. This value is very relative as it depends by many factors and especially by the field of study. The R Square found are respectively of 0,608 (experimental group) and of 0,692 (control group) and they are both considered good indicators of the goodness-of-fit of the two models. After, the Standard Error of the Estimate needs to be
28 considered as it shows how precise the model predictors are. More specifically, it represents the average distance observed from the regression line. The closest to zero this value is, the better for the model. In both the models the Standard Errors are discretely low, showing a good precision of the model: 0,5623 for the experimental group and 0,5424 for the control group. After having done a preliminary examination of the results of the MLR, it is possible to analyse the regression coefficients to understand and compare the relationships between the different predictors and the dependent variables. In order to compare the coefficients of the two models (control and experimental group) and to draw conclusions from them, it is necessary to calculate a p-value for the differences in the coefficients.
In order to do this, firstly a dummy variable was created, where “0” represented the exposure to Sephora Virtual Artist and “1” the exposure to the traditional 2D website. After an interaction
term between the dummy variable and each predictor of the model. In this case, 3 interaction
terms were created (for 3 predictors). The interaction term between the dummy variable and each predictor represents the difference in the coefficient. Indeed, the p-value for each interaction gives a significant test for the differences in those coefficients. The p-value of the interaction term for the variable “Perceived Value” is 0.016, showing how these coefficients are statistically different in the two models. Moreover, the p-value of the interaction term of “Attitude Toward the Brand” is significant (0,000) demonstrating again that this variable’s coefficients are statistically different between the two groups. Finally, the last p-value of the interaction term of the variable “Perceived Trust” is not significant (0,899) showing that the coefficients of these variable are not statistically different between the two groups (APPENDIX H).
30 From these results, it is possible to state that the traditional 2D version of the platform can be considered as a baseline where the “Online Purchase Intention” is consistently based on the “Attitude Toward the Brand”. In Sephora Virtual Artist, the AR feature becomes more relevant than the consideration of the brand itself and the technology becomes the main driver to sales. Indeed, the “Attitude Toward the Brand” becomes the foundation on top of which AR builds to drive “Perceived Value” and therefore “Online Purchase Intention”.
The previous analysis aimed at explaining the possible increase on online purchase intention when experiencing Sephora Virtual Artist. Indeed, three main drivers were found: Perceived
Trust, Perceived Value and Attitude Toward the Brand. Through the comparison of the two
groups, it is possible to state that the Attitude Toward the Brand is the main factor to drive sales in the 2D version, but in the Sephora Virtual Artist version the Perceived Value becomes a more important variable as the AR features becomes more relevant than the pure consideration of the brand itself. According to this, different digital and advertising strategies may be developed.
In order to answer to the third research questions RQ3 (“What types of consumers best respond to AR website features?”) several correlations were conducted, and a cluster analysis was performed.
4.2.6 CORRELATIONS:
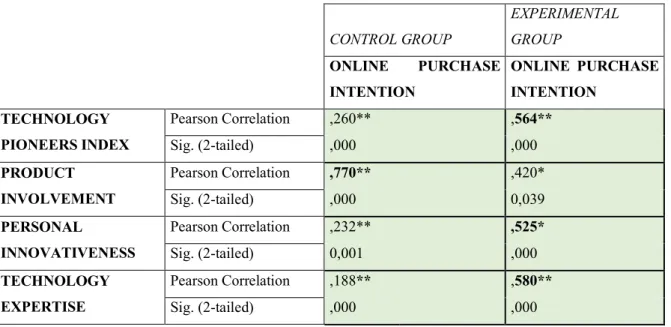
To examine if Augmented Reality affects Online Purchase Intention differently in individuals with different traits, several Pearson Correlations within the psychographic variables and the dependent variable were analysed. All the variables identified were found to be significant with the Online Purchase Intention, but some differences between the two groups were found. The table below synthetise the difference between these coefficients. The variables Technology
Pioneers Index, Personal Innovativeness and Technology Expertise have a consistently higher
correlation coefficient with the Online Purchase Intention of the experimental group. The Pearson correlations are respectively 0,564, 0,525 and 0,580. On the contrary, the control group shows higher coefficient on Product Involvement (0,770), meaning that people that are involved in this product category will be more inclined in shopping from the 2D website. Given the nature of these results, a cluster analysis will be performed to better analyse the segments to target in each platform.
31 CONTROL GROUP EXPERIMENTAL GROUP ONLINE PURCHASE INTENTION ONLINE PURCHASE INTENTION TECHNOLOGY PIONEERS INDEX Pearson Correlation ,260** ,564** Sig. (2-tailed) ,000 ,000 PRODUCT INVOLVEMENT Pearson Correlation ,770** ,420* Sig. (2-tailed) ,000 0,039 PERSONAL INNOVATIVENESS Pearson Correlation ,232** ,525* Sig. (2-tailed) 0,001 ,000 TECHNOLOGY EXPERTISE Pearson Correlation ,188** ,580** Sig. (2-tailed) ,000 ,000
** Correlation is significant at the 0.01 level (2tailed). * Correlation is significant at the 0.05 level (2-tailed).
Figure 8: Pearson correlations between variables for experimental and control group
4.2.7 CLUSTER ANALYSIS
As the results of the correlation analysis show a difference in the response of people with different attitudes towards technology and innovation, a more precise analysis could come from a behavioural segmentation analysis. Therefore, some elements of the target population are gathered with regards to a similar set of variables. In order to do this a cluster analysis was performed, which is an automatic classification technique that classifies statistical units into clusters. Firstly, I performed a hierarchical method, to define the number of clusters. After, a k-means method was performed to execute the cluster analysis.
During the first part consisting into the hierarchical clustering, the Ward’s method was used to perform the clusters and the interval measure chosen was the Square Euclidean Distance. In order to identify the ideal number of clusters to perform the analysis, a dendogram was created (APPENDIX L). The possible number of clusters to be chosen could be either two or three. Since, analysing only two clusters would limit the richness of the study, it was decided to use three clusters. After having decided the number of clusters, a k-means analysis was performed. The variables used to perform this analysis were the 4 behavioural variables identified in the previous factor analysis: Technology pioneers index, product involvement, personal
innovativeness and technology expertise. Furthermore, the maximum number of iteration was
33 with 122 and cluster 3 with 70. Even if the third one is smaller than the others, it is possible to conclude that the three clusters represent homogenously the sample population.
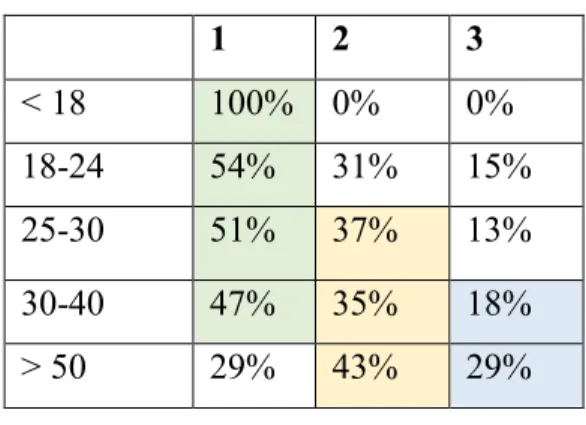
After having conducted Cross-Tabs analysis with the demographics, it is possible to have a more precise understanding of the groups. Indeed, there is a statistical significance between these clusters with age and occupation. Indeed, as shown in the graphs below, cluster one includes the younger people of the sample. For example, considering the section of the sample younger than 18 years old, the 100% of it is part of cluster one. Indeed, looking at the percentages of the sample being part of the clusters, the higher the age groups the lower the percentage being part of cluster one.
There is a significance even with the occupation and the memberships of clusters. There are three groups that have half of their respondents in cluster one which are students, employees and managers. On the contrary, Freelancer, housewives and unemployed people have a lower percentage. Again, a very high percentage (63%) of students are part of cluster 1.
Figure 11: Cross-tabs analysis of clusters with demographics.
4.2.7.1 Description of the clusters
The first cluster represents a group of people extremely involved and interested in the category of beauty products. Consequently, they are more informed than the average person about cosmetics products’ features and characteristics. The other main characteristic of the cluster is the presence of technology pioneers, people who are usually the first ones trying new high-tech products. They have a moderate technology expertise as well, in the sense that they are used to technologies in their daily life. Finally, the nature of this cluster is to be innovative in everything they do and to “think outside the box”. There is a majority of young people in this group.
1 2 3 Student 63% 20% 18% Employed 50% 36% 14% Manager 56% 29% 15% Freelancer 41% 21% 38% Housewife 29% 61% 11% Unemployed 16% 42% 42% 1 2 3 < 18 100% 0% 0% 18-24 54% 31% 15% 25-30 51% 37% 13% 30-40 47% 35% 18% > 50 29% 43% 29%
34 The second cluster completely differ from the first one and it is distinguished by extremely low values of “personal innovativeness” and of “technology expertese”. Indeed, this group of people tend to prefer their old habits and to not change their routines. Moreover, they are not much capable of using high-tech products, as they are seen as “obstacles”. Moreover, this cluster is not particularly interested into trying new high-tech products. Finally, the group have a moderately low interest in this product category. The people in this group are more mature in age than the ones in cluster one.
The third cluster is characterized by people who dislike beauty products and consequently do not have interest in them. At the same time though, they can be considered technology expert as they are capable of using any kind of high-products and they enjoy figuring out how they work.
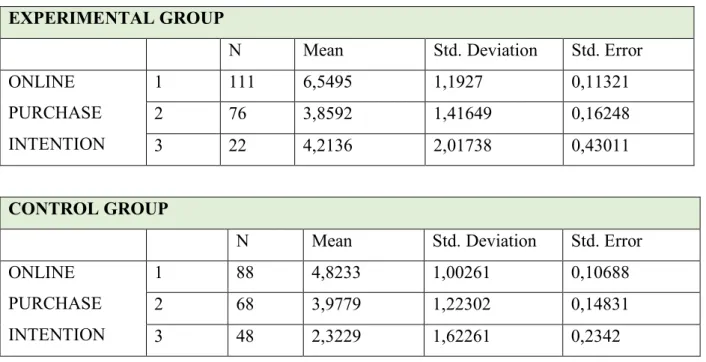
4.2.7.2 ANOVA OF CLUSTERS WITH ONLINE PURCHASE INTENTION
After, an Anova analysis was conducted to identify the presence of any differences in the 3 clusters in terms of Online Purchase Intention. In both groups (experimental and control) the significance level is equal 0,000 and therefor the null hypothesis is rejected for both models. Furthermore, the tables below show how the Online Purchase Intention mean differs in the three clusters of the two groups.
EXPERIMENTAL GROUP
N Mean Std. Deviation Std. Error
ONLINE PURCHASE INTENTION 1 111 6,5495 1,1927 0,11321 2 76 3,8592 1,41649 0,16248 3 22 4,2136 2,01738 0,43011 CONTROL GROUP
N Mean Std. Deviation Std. Error
ONLINE PURCHASE INTENTION 1 88 4,8233 1,00261 0,10688 2 68 3,9779 1,22302 0,14831 3 48 2,3229 1,62261 0,2342