Faculdade de Ciências
Departamento de Informática
Video Browsing and Soundtrack Labelling based on
Human Computation
Jorge Miguel Correia Antunes Gomes
DISSERTAÇÃO
MESTRADO EM ENGENHARIA INFORMÁTICA
Especialização em Engenharia de Software
Faculdade de Ciências
Departamento de Informática
Video Browsing and Soundtrack Labelling based on
Human Computation
Jorge Miguel Correia Antunes Gomes
DISSERTAÇÃO
Supervised by Prof. Dr. Maria Teresa Caeiro Chambel
MESTRADO EM ENGENHARIA INFORMÁTICA
Especialização em Engenharia de Software
I would love to express my sincere gratitude to everyone who supported me in the last months, especially to my supervisor Prof. Dr. Teresa Chambel, and Prof. Dr. Thibault Langlois, the leader of the VIRUS project, for being available and the continuous support, the long discussions filled with the constructive criticism, the interesting ideas and all the help and collaboration provided, which made this work feasible and enjoyable.
Likewise, to my close family members - Beatriz Gomes, Fernando Gomes, Amália Moura, Daniela Gomes, Pedro Gomes, Inês Gomes - for the support and caring during all these years in good and bad moments, without them I would not have this opportunity.
I would like to deeply thank all my friends: To Fernando Fernandes for his amazing friendship, great advices, the shared adventures and initiating (with) me in geocaching. To Alexander Fernandes for being such an amazing friend, the shared moments, projects and games, and staying with me through difficult moments. To Tiago Senhorinho for his great company, the shared moments, conversations and adventures, the honesty, being an amusing person, and especially for being the oldest friend I ever had. To Camila Novais for her good pieces of advice, the motivation and engaging conversations. To Edite Fer-nandes for her support, friendship, cheerful company and shared adventures, for pushing me to new places and opening my world to new experiences. To Tamzyn Do Couto (and Zara) for her friendship, inspiration and positivism, for being supportive and lovely to of-fer me (extreme) body conditioning for the next time I visit a McDonald’s, for her honesty, her extensive philosophical conversations and arguments, and by helping me improving my English. To Oleksandr Malichevskyy for the shared friendship and adventures, for the LaTEX tips and proving that coffee is still better than energy drinks, including his recent discovery of Rodeo. To all people at Rota Jovem for the warm welcome and supporting my ideas, the developed activities, and for the opportunities provided, especially to Hugo Matos for the natural zeal and passion he puts in his work, and by withstanding me in the train. To Tiago Inocêncio, Paulo Ribeiro and João Oliveira for sharing good moments and epic lunch conversations. To César Santos and Ana Narciso for sharing good music and moments. To Silvana Silva for all the amusing cat images and videos we shared. To Bruno Neves for the many coffees talks and the mutual support. To João Gonçalves, André Pires, Rui Rodrigues, Telma Martins, Patrícia Silva, João Rico, Claudia, André Pantaleão and Bruno Russo for the company, the amusing nights out and conversations at
about Alexandra Pinto, André Rosa, Custodia Carvalho, Eduardo Pais, Gabriel Carvalho, Inês Vasques, Jason Heron, João Tavares, José Pedrosa, Kleomar Almeida, Meryeli Ma-cedo, Miguel Melo, Nuno Cardoso, Raul Pinto and Ricardo Wilhelm. I would detail this list even more but no words would be enough to express how much everyone contributed to my personal growth and, directly or indirectly, affected my work done throughout this year. My best wishes to everybody I mentioned before!
My humble gratitude to all my colleagues, especially to Eduardo Duarte for teaching the basics of his audio similarity tool, to Nuno Gil by sharing his work and reports, to Ana Jorge for sharing ideas and the opportunity to participate in her project. My thanks to all volunteers who participated in SoundsLike evaluations, especially, Vinicius Cogo for the time spent giving tons of feedback, suggestions and cool ideas for my work.
I am graceful for the support provided by FCT: Fundação para Ciência e Tecnolo-gia through a research grant in the VIRUS project (PTDC/EIA-EIA/101012/2008). My acknowledgements to the Department of Informatics, Faculty of Sciences, University of Lisbon, and the HCIM group at LaSIGE, for providing all the necessary conditions for the development and writing of this thesis.
To finish, my regards to everyone who contributed to the open-source libraries and software I used to develop my work and produce this document, to the Facebook for the constant procrastination temptation, to the NSA1for spying on me and everyone else, and
to you, yes you!, the reader, one of the reasons which I have created this magnificent document.
1Nacional Security Agency
A rápida expansão dos meios de comunicação permitiu a criação de enormes e com-plexas colecções multimédia acessíveis através da Internet e media sociais. Essas co-lecções exigem novos mecanismos de busca, que irão beneficiar de novas técnicas de classificação e análise automática de conteúdo de áudio e vídeo, e de relações entre os documentos multimédia e os seus conteúdos.
O vídeo é um meio muito rico, combinando imagem e som e proporcionando assim uma enorme quantidade de informação e uma excelente plataforma para a criatividade ser expressa e explorada. A riqueza do vídeo e multimédia permite a extracção de proprieda-des interessantes que podem ser úteis em sistemas de pesquisa exploratória.
No entanto, toda esta riqueza que torna tão interessantes os espaços de informação de áudio e vídeo, traz consigo uma complexidade com que é difícil lidar. Eventos sonoros, emoções expressas e sentidas, estados de espírito, cores e ritmo sonoro são exemplos de propriedades multimédia interessantes a serem exploradas.
Alguns investigadores apontaram a importância para o desenvolvimento de métodos para extrair características interessantes e significativas em vídeos para efectivamente resumi-los e indexá-los ao nível das legendas, imagem e áudio.
As tarefas de análise de áudio e vídeo são consideradas como árduas e complexas. As abordagens mais comuns baseiam-se em modelos estatísticos, que exigem a construção de conjuntos de dados classificados compostos por amostras de vídeo e áudio. A cons-trução de um conjunto de dados exigiria horas incontáveis, de escuta e de classificação manual - isto é muitas vezes formulado como o problema de “arranque a frio” (“cold-start problem”) na aquisição de dados.
A colecta de informações detalhadas sobre o conteúdo multimédia poderá melhorar os sistemas automáticos de extracção de informação e facilitar a prospecção de dados, para extrair relações úteis para as indústrias de multimédia, melhorar sistemas de recomenda-ção baseados em conteúdos, publicidade contextual e “personalized retargeting”. Para tal, é necessária a exploração de novos métodos para a classificação de grandes quantidades de vídeos e áudio, com vista a solucionar o problema de “arranque a frio” da aquisição de dados, e providenciar um modo para a partilha de resultados e conjunto de dados com a comunidade científica.
incluindo a representação temporal quer dentro dos filmes, que contém muita informação ao longo do tempo da sua duração, quer ao nível do tempo de lançamento ou visionamento de séries e filmes.
Hoje em dia, a importância da visualização de dados está a aumentar cada vez mais. Técnicas de visualização podem ser a opção mais forte para transmitir e expressar ideias a outras pessoas recorrendo a gráficos, diagramas e animações. No entanto, isto exigirá conhecimentos sobre a linguagem da comunicação visual, que envolvem semânticas e sintaxes semelhantes à linguagem verbal. Estas técnicas podem ajudar a lidar com a com-plexidade de dados e explorar modos avançados e eficazes para transmitir informações provenientes de espaços de informação.
Este projecto pretende contribuir na área de visualização e recuperação de informa-ções de áudio e vídeo ao permitir aos utilizadores aperceberem-se e procurarem por cer-tas propriedades multimédia e abordar o problema de “arranque a frio” (“cold-start pro-blem”). A solução passa pela criação de novas abordagens que dependem de mecanismos interactivos de crowdsourcing e computação baseada em humanos que irão recorrer a ele-mentos de jogos para motivar os utilizadores a contribuir para resolução do problema de “arranque a frio” na classificação de conteúdos.
Crowdsourcing aqui significa confiar nas contribuições provenientes de um enorme grupo de pessoas, especialmente de uma comunidade on-line ou redes sociais, onde ta-refas possam ser concluídas por diversas pessoas. Neste contexto, pretende-se classificar documentos multimédia e procurar um consenso geral para obter informações relevantes que descrevam com precisão estes mesmos documentos em meta-dados sugeridos pelos utilizadores.
Isto irá criar bases de dados que poderão ser compartilhados e reutilizados pela co-munidade científica, com vista a serem utilizados em modelos estatísticos que suportam a extracção automática de informação e prospecção de dados referidas anteriormente.
Este trabalho está relacionado com outros projectos, onde as características de vídeo são extraídos por meio de processamento do áudio (tiro, gritos, risos, humor música, etc), análise de legendas (usando a interpretação semântica e análise de sentimento relativa a emoções expressas) e monitorização das emoções dos espectadores através de dados biométricos (frequência cardíaca, a respiração, a resposta galvânica da pele, etc), ou re-conhecimento visual de expressões faciais.
O trabalho relatado por esta dissertação foca-se nas dimensões interactivas para visu-alização, acesso e classificação de conteúdos em filmes, visualizações interactivas para espaços de filmes e para a representação de segmentos de áudio semelhantes, com base no teu conteúdo, e permitir uma navegação contextualizada de filmes e a classificação interactiva de conteúdos no SoundsLike. Adoptando uma abordagem de Computação
o utilizador na navegação e classificação de vídeos e filmes; e 2) utilizar esta interacção para recolher informação e melhorar técnicas de análise de áudio baseado em conteúdo, recorrendo a paradigmas de crowdsourcing para obter consensos sobre a relevância de dados recolhidos e pontuar correctamente cada contribuição. SoundsLike está integrado no MovieClouds, uma aplicação Web interactiva desenhada para aceder, explorar e visua-lizar filmes baseada na informação fornecida em diferentes perspectivas do seu conteúdo. Esta abordagem de classificação poderá posteriormente ser estendida para outros tipos de conteúdos, não se limitando somente à componente de áudio.
Palavras-chave: Navegação Interactiva, Áudio, Música, Banda Sonora, Vídeo, Filmes, Etiquetagem, Computação Baseada em Humanos, Jogo Com Um Propósito,
Gamificação, Entretenimento, Motivação, MovieClouds, SoundsLike.
Video and audio are becoming dominant media in our lives. In a time when we wit-ness the convergence of media, it is pertinent the creation of new and richer ways for content-based access and visualization of videos. Collections of video require new search mechanisms which will benefit from new classification techniques and automatic analysis of video and audio content and relationships among them.
Video is a very rich medium combining image and sound, thus providing huge amounts of information. However, this richness that makes video and audio based information spaces so interesting comes with a challenging complexity to handle.
The exploration of new visualization methods related to video and movies at the movie space level down to the each movie itself, including representations along time of the videos’ content or the time of their releases or viewing, allow pattern and trend analysis and movie browsing.
The exploration of new visualization methods may enhance video and movies percep-tion and navigapercep-tion at the movie space and the individual movie levels. Representapercep-tions along time of the videos’ content in their different perspectives (sound, subtitles, image, etc.) or the time of their releases or viewing, allow identifying and analysing use and content patterns and relations, for a richer understanding and access in movie browsing.
Game elements, in turn, can help in this often challenging process, e.g. in the audio, to obtain user feedback to improve the efficacy of classification, while maintaining or improving the entertaining quality of the user experience.
This dissertation’s project aims to improve the area of visualization and information retrieval of audio and video, by adopting a Human Computation approach through a Game With A Purpose to entertain and engage users in movies soundtrack browsing and la-belling to collect data that also improve our content-based sound classification techniques. SoundsLike is integrated in MovieClouds, an interactive web application designed to ac-cess, explore and visualize movies based on the information conveyed in the different tracks or perspectives of its content.
Keywords: Interactive Browsing, Audio, Music, Sountrack, Video, Movies, Labelling, Tagging, Human Computation, Game With A Purpose, Gamification, Entertainment, Engagement, User Experience, MovieClouds, SoundsLike.
List of Figures xviii
List of Tables xix
Abbreviations xxii 1 Introduction 1 1.1 Motivation . . . 1 1.2 Objectives . . . 2 1.3 Context . . . 3 1.4 Contributions . . . 4
1.5 Planning and Schedule . . . 5
1.6 Document Structure . . . 8
2 Related Work 9 2.1 Emotion and Representation Models . . . 9
2.1.1 Circumplex Model . . . 10
2.1.2 Ekman Basic Emotions . . . 11
2.1.3 Plutchik’s Model of Emotions . . . 11
2.1.4 Colours and Emotions . . . 12
2.1.5 Emotionally Vague . . . 14
2.1.6 ColorsInMotion . . . 15
2.2 Visualization And Classification of Audio and Video Information . . . 17
2.2.1 Twitter Lyrics . . . 17
2.2.2 Last.fm . . . 19
2.2.3 The Structure Of The World-wide Music with Last.fm . . . 23
2.2.4 Audio Flowers: Visualising The Sound Of Music . . . 25
2.2.5 Netflix Prize Similarity Visualization . . . 26
2.3 Content-based Audio Retrieval With Relevance Feedback . . . 27
2.4 Human Computation in Content Classification . . . 29
2.4.1 Maslow’s Hierarchy of Needs . . . 29
2.4.2 Skinner Box . . . 31 xiii
2.4.5 ESP Game . . . 36
2.4.6 Peekaboom . . . 37
2.4.7 TagaTune . . . 38
2.4.8 MoodSwings . . . 39
2.4.9 Other Related Work . . . 40
2.5 Web Technologies and Libraries . . . 40
2.5.1 HTML and HTML 5 . . . 41 2.5.2 CSS . . . 41 2.5.3 Javascript . . . 42 2.5.4 PHP . . . 44 2.5.5 REST . . . 44 2.6 Previous Work . . . 45 2.6.1 iFelt . . . 45 2.6.2 Movie Clouds . . . 47 3 Movie Visualizations 51 3.1 Sound Similarity . . . 51 3.1.1 Motivation . . . 51 3.1.2 Requirements . . . 52 3.1.3 Design . . . 53 3.1.4 The Implementation . . . 54
3.2 Temporal Video Visualizations . . . 58
3.2.1 Motivation . . . 59
3.2.2 Design . . . 59
3.2.3 Implementation . . . 61
3.2.4 Discussion . . . 62
4 Movies Soundstrack Browsing and Labeling in SoundsLike 65 4.1 SoundsLike . . . 65
4.1.1 SoundsLike Requirements and Approach . . . 66
4.2 Designing SoundsLike . . . 67
4.2.1 Playing Soundslike . . . 68
4.2.2 Movie Soundtrack Timelines . . . 69
4.2.3 Audio Similarity Graph . . . 70
4.2.4 Listening to Contextualized Audio in Synchronized Views . . . . 71
4.2.5 Labelling Scoring and Moving On . . . 71
4.2.6 Gaming Elements . . . 72
4.3 VIRUS System Architecture and Implementation . . . 75 xiv
4.3.3 Presentation Tier: SoundsLike Front-end . . . 80
4.3.4 Implementation’s Software Metrics . . . 81
4.4 Discussion . . . 82
5 Assessing SoundsLike 83 5.1 Method and Participants . . . 83
5.2 Tasks and Results . . . 84
5.3 Overall Evaluation . . . 87
5.4 Perspectives . . . 88
6 Conclusions and Future Work 89 6.1 Conclusion . . . 89
6.2 Future Work . . . 90
References 100 Appendix A Final Gantt Map 103 Appendix B SoundsLike Installation Manual 105 B.1 Install Apache+Mysql+PHP (for Linux Debian based distros) . . . 105
B.2 XAMPP Command Parameters . . . 106
B.3 Important Files And Directories (XAMPP) . . . 107
B.4 First Steps for SoundsLike Instalation . . . 107
B.5 Installing VIRUS Database . . . 107
B.6 Installing VIRUS Web-service . . . 108
B.7 Installing SoundsLike Front-end . . . 109
Appendix C VIRUS Webservice Documentation - API Version 1 111 C.1 Base URI . . . 111
C.2 Resource Collections . . . 113
C.3 Errors . . . 113
Appendix D User Evaluation Script 115
1.1 Schedule and Gantt map for the initial planning. . . 5
1.2 Final schedule and Gantt map. . . 7
2.1 Russell’s Circumplex Model of Affect or Emotions. . . 10
2.2 Plutchik emotional model. . . 12
2.3 Emotionally Vague Results . . . 14
2.4 ColorsInMotion Views. . . 16
2.5 Twitter Lyrics Demo Version Screenshots . . . 18
2.6 Twitter Lyrics Visualizations . . . 18
2.7 Last.fm tag cloud for the artist “The Black Keys”. . . 20
2.8 Last.fm Discover Main View . . . 21
2.9 Last.fm Discover Album View . . . 22
2.10 An example of a Mood Report from an active Last.fm user . . . 23
2.11 Artist’s Map Graph of Last.fm . . . 24
2.12 Audio Flower Representation . . . 25
2.13 Audio Flower Samples . . . 26
2.14 Visualization of the 17.000 movies in the Netflix Prize dataset . . . 27
2.15 The GUI of the audio retrieval system. . . 28
2.16 An interpretation of Maslow’s hierarchy of needs. . . 30
2.17 Dans Pink’s intrinsic motivators. . . 30
2.18 Skinner box. . . 32
2.19 Representation of Csikszentmihalyi’s flow model . . . 33
2.20 Confort Zone Model and Flow Model Applied to Games . . . 34
2.21 The ESP Game. . . 36
2.22 The Peekaboom Game interface . . . 38
2.23 Preliminary interface for the TagaTune prototype. . . 39
2.24 Moodswings gameplay. Red and yellow orbs represent each player. . . . 39
2.25 iFelt . . . 46
2.26 MovieClouds Movies Space view navigation . . . 48
2.27 MovieClouds Movie view navigation . . . 48 xvii
3.2 Mockups for the visualization of Similar Audio Events Prototype. . . 54
3.3 Prototype for an interactive Sound Similarity Graph visualization. . . 56
3.4 The same Sound Similarity Graph visualization using a custom dataset obtained from a Last.fm user profile. . . 57
3.5 Visualizing contents in a movie. . . 60
3.6 Comparing movies by content tracks. . . 61
3.7 Movie visualization along time. . . 62
3.8 Movie visualization along time with multiple movies (track in a cluster). . 63
4.1 SoundsLike interaction (4 images). . . 68
4.2 SoundsLike Timeline (3 images). . . 69
4.3 SoundsLike Audio Similarity Graph (3 images). . . 70
4.4 Labelling the audio excerpt (3 images). . . 72
4.5 VIRUS system tier architecture. . . 76
4.6 UML Entity–relationship model for the similar audio segments database and tagging system. . . 78
4.7 Proposal for second version of the UML Entity–relationship model for the similar audio segments database and tagging system. . . 79
3.1 Normalization function for audio similarity values. . . 55 3.2 SLOC count for the Sound Similarity Representation prototypes. . . 58 4.1 SLOC count for the VIRUS webservice. . . 81 4.2 SLOC count for the Sound Similarity Representation prototype and library 81 5.1 USE Evaluation of SoundsLike . . . 85 5.2 Quality terms to describe SoundsLike. . . 88 C.1 An example of a XML error response from the web-service . . . 114
ACID Atomicity Consistency Isolation Durability AJAX Asynchronous Javascript And XML
API Application Programming Interface CSS Cascade Style Sheet
D3 Data-Driven Documents
FCUL Faculdade de Ciências da Universidade de Lisboa GUI Graphical User Interface
GWAP Game With A Purpose
HCIM Human-Computer Interaction and Multimedia Research Team HTML HyperText Markup Language
HTTP Hypertext Transfer Protocol
LaSIGE Large-Scale Informatics System Laboratory LOC Lines Of Code
MVC Model-View-Controller PDO PHP Data Object
PEI Projecto de Engenharia Informática (Computer Science Engineering Project) RDMS Relational Database Management System
PHP PHP: Hypertext Preprocessor REST Representational State Transfer RPC Remote Procedure Call
SQL Structured Query Language SLOC Software Lines Of Code SVG Scalable Vector Graphics UML Unified Modelling Language URI Uniform Resource Identifier
USE Usefulness, Satisfaction and Ease of Use VIRUS Video Information Retrieval Using Subtitles VML Vector Markup Language
W3C World Wide Web Consortium WWW World Wide Web
Introduction
1.1 Motivation
Video and audio have a strong presence in human life, being a massive source of in-formation. The fast expansion of media has enabled the creation of huge and complex multimedia collections accessible over the internet and social media. These collections require new search mechanisms which will benefit from new classification techniques and automatic analysis of video and audio content and relationships among them.
Video is a very rich medium combining image and sound, thus providing huge amounts of information and excellent platform for creativity to be expressed and explored [42]. The richness of video and multimedia enables the extraction of interesting properties that may be useful in exploratory search systems.
However, all the richness that makes video and audio based information spaces so interesting, inside each video or audio and outside in the way they relate to each other, comes with a challenging complexity to handle. Sound events, felt and expressed emo-tions, moods in audio, and colours are examples of interesting multimedia properties to be explored, due their usefulness to describe video contents in different perspectives. To extract such meaningful information from videos, mechanisms are required for the ex-traction of information from huge collections of videos.
Some researchers [10, 23] pointed out the importance of the development of methods to extract interesting and meaningful features in video to effectively summarize and index them at the level of subtitles, audio and video image.
But, video and audio analysis are considered complex and arduous tasks, and most formulated approaches are based on statistical models which require the construction of classified datasets composed by video and audio samples. The building of our own dataset would require many hours of listening and manual classification - this is often formulated as the “cold start” problem in data acquisition.
Gathering detailed information about multimedia content may improve automatic in-formation retrieval systems and facilitate data mining over the extracted data, to extract
relationships useful for multimedia industries to improve content-driven recommendation systems, contextual advertisement and personalized retargeting. Therefore, the explo-ration for new ways to classify large amounts of videos and audio is necessary, to help towards the resolution of the cold start problem in data acquisition, and provide a way for sharing the results and dataset with the scientific community.
Meanwhile, it is also important the exploration of ways of visualizing the information related to video and movies, at the level of each movie and at the movies space level, including representation of time for release of shows and movies or the time when viewers watched the movies in different seasons, allowing trend analysis and pattern prediction.
Nowadays, the importance of data visualization in many areas is increasing. Visual-ization techniques can be the strongest option for expressing ideas to other people with graphs, diagrams and animation.These techniques can help to deal with the data complex-ity and explore enhanced and effective ways to transmit information from information spaces [16].
1.2 Objectives
This project aspires to contribute to the area of visualization and information retrieval of audio and video, and to enable users to search for certain properties and solve the cold start problem. The solution involves creating new approaches that rely on interactive crowd-sourcing mechanisms and human computation through game elements to compel users to contribute to solve the cold start problem and helping in the content classification. Here, crowdsourcing means relying on contributions from a huge group of people, es-pecially an online community or social networks, in a way that tasks could be completed by multiple persons. In this environment, it is intended to classify multimedia documents and resort to general consensus to obtain relevant information that describes with preci-sion the same documents. This consensus boils down to metadata matching suggested by users. A larger number of people wrapped around the classification of a multimedia element may have higher chance to unveil a good consensus about a metadata group, thus achieving a higher significance for the same metadata.
This will create databases that could be shared and reused by the scientific community, to be used in statistical models supporting the automatic information retrieval and data mining aiming to extract relationships useful for the cinematographic and discography industries (i.e. to improve content-driven recommendation systems, contextual advertise-ment and personalized retargeting).
Further exploration of others aspects includes usual representation of time inside the movies and along the different perspectives of their content.
The work reported in this dissertation focuses on interactive dimensions for visualiza-tion, access and content classification for movies, the representation of similarity of audio
excerpts, based on content, and enabling the contextualized browsing of movies and TV series, act as a base for interactive content classification and browsing in SoundsLike. Adopting an approach based on human computation, SoundsLike is a Game With A Pur-pose (GWAP) that pursues two goals: 1) use game elements to engage the user in movie browsing and audio content classification, and 2) use this interaction to collect data and improve our content-based sound analysis techniques, using crowd-sourcing paradigms to achieve consensus on the relevance of collected data and reward users properly for the “significance” of their contribution. SoundsLike is integrated in MovieClouds [20], an interactive web application designed to access, explore and visualize movies based on the information conveyed in the different tracks or perspectives of their content.
1.3 Context
This master dissertation is elaborated as a PEI1 integrated in the Computer Science
Engi-neering Master course of FCUL2and was developed around the VIRUS “Video
Informa-tion Retrieval Using Subtitles” (Langlois et al., 2010) research project, in the context of the HCIM group at LaSIGE, FCUL.
The dissertation focused on the development and testing of interfaces for new fea-tures that includes access and classification of audio segments according with its content to be integrated in MovieClouds - an interactive web application designed to access, ex-plore and visualize movies based o the information conveyed in the different tracks or perspectives of their content -, motivating user contributions through the use of game ele-ments together with crowdsourcing paradigms. It also explored new ways for interactive visualization of information and films along time.
It is linked with other master and PhD thesis where MovieClouds (N. Gil, N. Silva et al.) [20], iFelt (E. Oliveira, P. Martins, T. Chambel) [51] and ColoursInMotion (J. Martilho, T. Chambel) [42] where first designed and created, related to the retrieval of video characteristics through audio processing (shooting, screams, laughs, music mood, etc.), subtitles analysis (using semantics interpretation, including expressed emotions and feelings) and monitoring of viewer emotions through biometric data (heart rate, reactions, respiration, galvanic skin response, etc.) or recognition of facial expressions.
1Projecto de Engenharia Informática(Computer Science Engineering Project) 2Faculdade de Ciências da Universidade de Lisboa
1.4 Contributions
The main contributions of this project are the following: • Characterization of the state of art;
• Representation and access to similar audio track excerpts obtained from movies; • Classification of audio tracks using an application developed from a previous
dis-sertation under the same project;
• Design and development of SoundsLike, an interactive Web Application for movie soundtrack audio classification integrated and deployed as a part of the MovieClouds prototype (the front-end and back-end composed by a middleware Web-Service and data storage).
• Design and Implementation of interactive and animated 2D visualizations to overviews and allows the browsing and watching of the movies’ content through a wheel vi-sualization with diverse range of tracks that represent different perspectives of the movies contents.
• Evaluation of the SoundsLike prototype through usability tests with users.
It is also important to note the contribution through three scientific papers for interna-tional conferences:
• Gomes, J.M.A., Chambel, T. and Langlois, T., 2013. SoundsLike: Movies Sound-track Browsing and Labeling Based on Relevance Feedback and Gamification. In Proceedings of the 11th European conference on Interactive TV and video. Como, Italy, June 24-26: ACM, pp. 59–62.
• Gomes, J.M.A., Chambel, T. and Langlois, T., 2013. Engaging Users in Audio Labelling as a Movie Browsing Game With a Purpose. In 10th International Con-ference On Advances In Computer Entertainment Technology. Bad Boekelo, En-schede, Netherlands, November 12-15: Springer, Netherlands, 12 pages.
• Gomes, J.M.A., Chambel, T. and Langlois, T., 2014. A Video Browsing Interface for Collecting Sound Labels using Human Computation in SoundsLike. In 9th International Conference on Computer Graphics Theory and Applications. Lisbon, Portugal, January 5-8: SCITEPRESS Digital Library, 8 pages.
I also participated in the Faculty Open Day3 on April 11, 2013 as student
volun-teer, presenting the to groups of high school students the developed work on interactive movie classification in SoundsLike and MovieClouds (Interactive Movie Classification: MovieClouds and SoundsLike4, Jorge M. A. Gomes, Teresa Chambel, Thibault Langois).
The open day was organized by the Faculty of Sciences, University of Lisbon to present the available courses, work developed inside and promote contact between university and high school students.
3Dia Aberto da Faculdade de Ciências, participação através do Departamento de Informática. 4Translation of the original title: “Classificação Interactiva de Filmes: MovieClouds e SoundsLike”.
1.5 Planning and Schedule
The initial planning proposed for this project is presented bellow, with a total duration of nine months:
• Month 1 - 2: Gathering of requirements and characterization of state of art: Study of the subject’s problems and related technologies or technologies currently being used, familiarity with previous work in the VIRUS project.
• Month 1 - 2: Writing of a preliminary report.
• Month 3 - 7: Proposal and development of interactive tools and mechanisms for movie access.
• Month 4 - 7: Development and testing of contents for the purpose of demonstration, evaluation and refinement of the elaborated work.
• Month 8: Evaluation and final refinements.
• Month 8- 9: Writing of the final report. Possibly writing of a scientific paper.
Figure 1.1: Schedule and Gantt map for the initial planning.
Due to the short duration of the project and the fairly well defined planning, the de-velopment process used in this project was the waterfall as a basis, with some iterations
and increments due to results of evaluation and the inherent research nature of the project. In this model, some phases are commonly defined such as Requirements, Design, Im-plementation, Verification and Validation, Documentation and Maintenance, where the Requirementsphase corresponds to the first two months (until the delivery of the prelimi-nary report), the Design and Implementation corresponds to the months 4-7, the validation to the month 8 and the Documentation and Maintenance to the last 2 months.
Figure 1.1 presents the original schedule and Gantt map for the project, involving the following tasks and milestones:
1. PEI start - A milestone marking the official start of the project;
2. Gathering of requirement and characterization of the state of art - the first part of the project, which is subdivided into the next four points;
3. Study of the Problem - Requirements gathering;
4. Survey and research of related work - Search and annotations about existing related work;
5. Survey about technology currently under use; 6. Familiarization with previous work;
7. Writing of preliminary report;
8. Delivery of preliminary report - milestone;
9. Proposal and development of interactive tools and mechanisms for movie access; 10. Evaluation and final refinements;
11. Writing of the final thesis;
12. Delivery of the final thesis - milestone;
13. Middleware Technologies (TM) Course - University course carried out in parallel; 14. Writing of 6 Reports (one per week) for the course - Reports for the TM course; 15. Course’s project - A group project for the TM course;
It is worthy to mention that the work in the project, from September to December (four months) was carried out in parallel with the course of Middleware Technologies (Tecnolo-gias de Middleware), which included lectures, weekly reports and a group project. This was already expected and accounted for in the initial planning.
I also participated in a workshop on Statistics Applied to Human Computer Interac-tion5, that took place at DI/FCUL, on October 9 and 12 2012, with the further goal of
applying the obtained knowledge in the analysis of data from usability tests.
Initially, the project was proposed with the usual duration of nine months. However the project took twelve months due to the time employed in the writing of more scientific articles than initially planned and the time required by the parallel course. Along time, the workflow was divided towards the tasks with more priority. In the case of scientific articles.
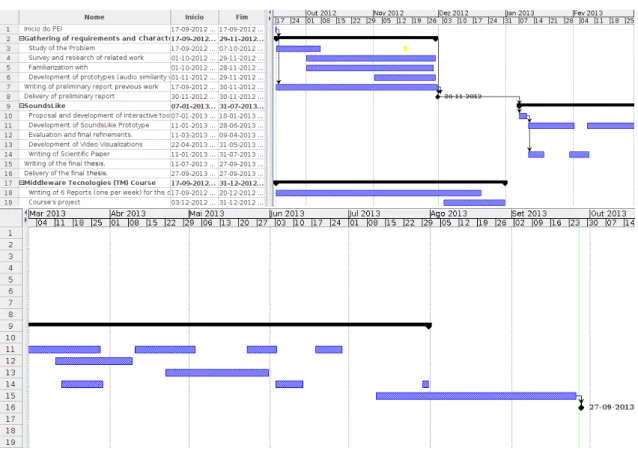
In figure 1.2, the final schedule is presented in a Gantt map for the following tasks and milestones. For a detailed and clearer map, please refer to appendix A:
Figure 1.2: Final schedule and Gantt map. 1. PEI start - A milestone marking the official start of the project;
2. Gathering of requirement and realization of state of art - the first part of the project, which is subdivided into the next four points;
3. Study of the Problem - Requirements gathering;
4. Survey and research of related work - Search and annotations about existing related work;
5. Familiarization with work already done;
6. Development of prototypes (audio similarity visualizations); 7. Writing of preliminary report;
8. Delivery of preliminary report - milestone;
9. SoundsLike - The second part of the project, which is subdivided into the next five points;
10. Proposal and development of interactive tools and mechanisms for movie access; 11. Development of SoundsLike Prototype;
12. Evaluation and final refinements; 13. Development of Video Visualizations; 14. Writing of Scientific Articles;
15. Writing of the final report;
16. Delivery of the final report - milestone;
17. Middleware Technologies (TM) Course - University course carried out in parallel; 18. Writing of 6 Reports (one per week) for the course - Reports for the TM course; 19. Course’s project - A group project for the TM course;
1.6 Document Structure
This document is organized in the following order:
Chapter 1 - Introduction: The first chapter aims to be an introduction for the reader about this project, presenting the motivation, objectives and contextualization of the work; Chapter 2 - Related Work: This chapter presents some of the related work public available in the academic world and on the web, and presents a summary of previous work done in the context of this project;
Chapter 3 - Movie Visualizations: In this chapter, we analyse the work done for the development of movie visualizations, including representation of movies along time and similarity between audio excerpts;
Chapter 4 - Movies Soundstrack Browsing and Labeling in SoundsLike: Here it is presented the main work towards the building of a prototype for the purpose of collecting data from movies soundtracks, including its purpose, requirements, design options and implementation details.
Chapter 5 - Assessing SoundsLike: This chapter presents a user study with the purpose of assessing and refining the prototype developed in chapter 4.
Chapter 6 - Conclusions and Future Work: This chapter summarizes the work pre-sented across the entire dissertation, presents conclusions and directions for future work.
Related Work
In this chapter, some studies, projects and ideas related to this dissertation are presented. The first section presents some work and concepts related to MovieClouds (which is presented in section 2.6.2) surveyed during the first months on the project, that could be relevant in the design and implementation of SoundsLike (chapter 4) in future iterations. The other sections are more directly related to SoundsLike, by including references to and summaries of projects and studies related with the visualization of movies, information retrieval of audio and web applications for audio and video labelling.
2.1 Emotion and Representation Models
In psychology and philosophy, emotion is described as a generic term for subjective, conscious experience that is characterized primarily by psycho-physiological expressions, biological reactions and mental states [19]. It is linked to the arousal of the nervous system due to a reaction to external events, and cognition takes an important role in emotions, particularly in the interpretation of such events [15, 19].
A certain music or film can induce the experience of a diverse range of emotions in the audience. A sudden moment of danger or tension can trigger an involuntary muscular motion in most of the observers sitting in a cinema, due to a natural response of the human brain to a possible threat, and may cause the experience of fear. A sad moment in a film could trigger emotions of sadness or despair in the audience, but depending on the life experiences and personality of each individual, not everyone reacts in the same way -some may cry, others may not - since an interpretation of the event is taking place inside the brain that accounts for all the past experiences.
Emotions are hard to describe, not only due to their abstract and complex nature but also due to the ambiguity introduced by language itself. Plutchik refers to people not knowing the difference between emotions, such as fear an anxiety, guilt and shame or envy and jealousy, and often using metaphors for describing such perceived emotions.
Scientists proposed more than 90 definitions of “emotion” during the 20th century [52], 9
but there are two aspects about which most of them agree in psychology studies: emotions are the result of reactions to relevant events for each individual’s needs or objectives, and emotions are related with psychological, emotional, behavioural and cognitive compo-nents [5]. A direct comparison between humans and animals is made in Darwin’s Theory of Evolution, where he states that expressive emotional behaviours are used to transmit information from an animal to another and therefore play an important role in the survival of each individual [25].
A quick summary of relevant emotional models and studies about the relation between colours and emotions is presented in the next sub-sections.
2.1.1 Circumplex Model
For years, scientists formulated diverse ways of organizing the different emotion names available in logic representations. Some attempted to create simple representations that would organize these emotions under dimensions of pleasure-displeasure, arousal-sleep (degree of arousal), dominance-submissiveness (related to potency).
Russell formulated a model using a Cognitive Structure of Affect where eight emo-tional variables fall into a two dimensional space. Four of these variables are related to the axis: the horizontal axis represents the pleasure-displeasure dimension (valence) and the vertical one relates to the arousal-sleep dimension (arousal). The remaining four variables do not form independent dimensions but are used to name the quadrants of space where an affect is defined by combinations of the axis dimensions [55].
In figure 2.1, the left diagram shows these eight affect concepts in circular order, the right diagram displays a direct circular scaling coordinates for 28 affect words.
2.1.2 Ekman Basic Emotions
Paul Ekman is an American psychologist who has been a pioneer in the study of emotions and their relation to facial expressions. In [13], he proposed two appraisal mechanisms for stimulus and emotional responses: An “automatic” mechanism that reacts quickly and selectively to external or internal stimulus resulting in a emotional response, some-times without the subject’s awareness. Ekman postulates that this mechanism must act automatically (involuntarily). A “extended” mechanism that requires cognition, where an evaluation of the environment and surroundings is needed, where such evaluation can be slow, deliberated and conscious.
From the results obtained by his studies of facial expressions, Ekman proposed 6 emotions as basic: “Anger”, “disgust”, “fear”, “happiness”, “sadness” and “surprise”. Basic emotions are claimed to be biologically fixed, innate and as a result universal to all humans and many animals as well [14].
Later, Paul Ekman expanded the idea of basic emotions to a “basic emotions frame-work” composed by 16 emotions that shares characteristics that “distinguish basic emo-tions one from another and other affective phenomena” [15]. These emoemo-tions are “amuse-ment”, “anger”, “contempt”, “content“amuse-ment”, “disgust”, “embarrass“amuse-ment”, “excite“amuse-ment”, “fear”, “guilt”, “pride in achievement”, “relief”, “sadness/distress”, “satisfaction”, “sen-sory”, “pleasure” and “shame”, where each word can be used to represent a family of emotions allowing the expansion of the list. Ekman denotes about omitting “some affec-tive phenomena which others have considered to be emotions”.
2.1.3 Plutchik’s Model of Emotions
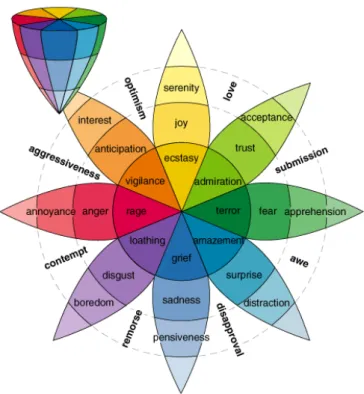
Plutchik analysed hundreds of emotion words available in the English language and con-cluded that they fall in diverse families based on similarity to primary emotions. These primary emotions were organized in a colour wheel (circumplex model), where similar emotions were placed close together and opposites 180◦apart. The remaining emotions
have been considered a mixture of the primary emotions.
He reused the notion of a circumplex model from previous work of Willian McDougall (1921) and Harold Scholosberg (1941), and expanded it like a structured model, by adding a third dimension related to the intensity of the expressed emotions, in a cone format shape, as can be seen in Figure 2.2.
The following primary emotions were chosen by Plutchik as basic biological emotions for his model: surprise, fear, trust, joy, anticipation, anger, disgust and sadness.
In Plutchik’s model, it is also proposed a relationship between emotions and colours by association of brighter and warm colors with positive emotions such as happiness and excitement (yellow), and dark and cold colours with negative emotions such as sadness , boredom and anxiety (blue) [52].
Figure 2.2: Plutchik emotional model.
2.1.4 Colours and Emotions
“Colours, like features, follow the changes of emotions.” - Pablo Picasso
Parallel to psychology and philosophic studies of emotions, the relation between colours and emotions have been a subject of interest between investigators and artists. Always in-terested in improving their work, artists look out for new ways of expressing and inducing emotions in the viewers, and the colour combination has a strong influence in all artistic work and the expressed message.
Colours can be used in diverse contexts: a paint of a cosy place may use warm and bright colours to express safety and comfort; a sad set in a drama or music show would include lighting with pale and cold colours to express melancholy; prohibition and danger signs use bright red tones for grabbing a person attention; etc.
believe in the effect of colours on human mood and emotions. There are diverse formulations and theories about the impact of colours on people and their emotional states. In most of these studies there is a common agreement about the meaning and impact of each colour.
Each colour is not only associated with one specific emotion, it is able to induce dis-tinct emotions and moods depending on the context. Most of the time these triggered emotions can be similar or related, but sometimes they are totally opposite. For instance, red is associated with energy, desire and passion, three similar and related emotions, how-ever it is also associated with love an hate, interestingly two totally opposite emotions.
“There’s a thin line between love and hate
Wider divide that you can see between good and bad There’s a grey place between black and white
But everyone does have the right to choose the path that he takes”
- Iron Maiden Lets quickly enumerate meanings and emotions evoked by some colours:
• Red: Colour of the human blood and fire, provides a sensation of energy and warmth. People often associate red with danger, strength, power, determination, desire, passion, love and hate. A very emotionally intense colour used to stimulate the body and mind, and to increase circulation. A colour used to grab the person’s attention in danger signs and traffic lights, in the "click here" or "buy now" buttons and advertises of websites, in advertisement to evoke erotic feelings or to promote energy drinks, games, cars and items related to sports.
• Pink and Purple: A colour associated with tranquillity, femininity, sweetness, warmth and love. Light pink evokes positive, romantic and nostalgic feelings while dark purple evokes gloom, sad or frustrating feelings.
• Yellow: The colour of sunshine, and associated with joy, happiness, intellect and friendship. Causes a warming effect and is associated with the stimulation of mental activity and purification of the body. Used to highlight objects, attract attention in warning signs and to symbolize honour and loyalty in heraldry, but it can have a disturbing effect when overly used and can sometimes be connoted to cowardice. • Green: Colour of nature and associated with growth, prosperity, fertility, health,
tranquillity and jealousy. It is considered one of the most restful colours to the hu-man eye and has a calming effect in the mind. Used frequently in the advertisement of drugs and medical products, and commonly associated with ambition, greed and money. Can also be used to denote the lack of experience, and together with yellow can mean sickness, discomfort and cowardice. In heraldry, green indicates growth and hope.
• Blue: Colour of the sky and sea, associated with depth, stability and with the intel-lect, but provides a cooling effect that relates it with tranquillity, melancholy, grief, sadness and sometimes anxiety (depression). Commonly used in products and ser-vices related with liquids, cleaning, air and sky (water, drinks, cleaning products, voyages), to suggest precision in promotion of high-tech products, and it is consid-ered a masculine colour.
• Black: Colour of the night and the absence of colour, associated with power, ele-gance, seriousness, death, mystery and fear. It denotes strength, elegance and au-thority, but usually has a negative connotation being related to the unknown and the unexpected, also correlated to fear, loss, mourning, grief and death. Used to make
others colours stand out and to create a contrast with brighter colours. Symbolizes grief in heraldry.
• White: Considered the colour of light and snow, associated with goodness, inno-cence, purity, virginity and perfection. This colour stimulates a sensation of clean-liness, simplicity and safety and is commonly used in high-technology products, low weight/fat food and in medicine, including medical products advertisement to suggest safety.
2.1.5 Emotionally Vague
Emotionally Vague1 is a study about emotions and how people react and feel when they
experience them. The study also focus on the relation between the body and the emo-tion, including descriptions of feelings using words and colours. The method involved the formulation of 5 objective questions, related to 5 pre-chosen emotions (Anger, Joy, Fear, Sadness and Love): one for describing the reason for feeling each emotion using words, three questions about the location of the feeling in the body, the exact spot and the direction of it, and another question about the colours that we associate to the emotions (the subjects had to use a fixed colour palette for referencing colours). A sample of 250 individuals has used [49].
Figure 2.3: Emotionally Vague: 1) Overlaid of the answers about how individuals feel the Anger emotion. 2) Most chosen colours associated to each emotion. 3) Overlaid of the answers about the perceived direction for Love emotion in individuals’ bodies. 4) The highest frequency of words extracted from the answers where individuals described feelings generated by the joy emotion.
One of the interesting results about this study are those about the colours and their relation with emotions.
In Figure 2.3, it is observable a specific pattern of colours for each emotion: In the first image, the subjects had to draw everything they wanted about here and what they feel when experiencing the emotion Anger, from their memory, resulting in a image where people perceive experiencing the emotion with more emphasis on the head, followed by the chest and hands. The second image represents association of colours, obtained from all subjects, related to the five emotions Anger, Joy, Fear, Sadness and Love. In the third image, subjects were asked to draw on paper the direction of felt emotions in their bodies, being this image the representation of all results for Love emotion, where most individuals represented as leaving the chest area, and directed the outside. The last image shows the combination of all words that subjects associated to the Joy emotion.
Anger was mostly associated with tones of red and other dark colour tones, joy with yellow and miscellaneous softer tones, fear was related to black and gray tones, sadness had one of the most associated number of colours (no specific dominant colour) and re-lates to multiple gray and blue colour tones, and love was associated with red, pink tones and other soft colour tones. It is observable that Anger and Love relate mostly to warm colours, while Fear and Sadness relate to neutral and cold colour tones, and Joy also re-lates mostly to warm colours and to some soft and bright cold colours (blues and greens). Notice how red is the dominant colour in two opposite emotions - love and hate. This study may be interesting to help developers to choose colours for interface elements re-lated to specific emotion, e.g. relate an action with a specific emotion to alert the user (irreversible delete action represented by a red icon).
2.1.6 ColorsInMotion
ColorsInMotion is an application that supports interactive and creative visualization strongly based on colour and motion properties, offering new ways to visualize and explore video in 2D. The main introduced innovation is enabling users to visualize the video space through different views, allowing them to search, compare and interact with a selection of videos in a cultural context, featuring areas such as music and dance from different authors and countries.
It features six main views for visualization. In the movie spaces, videos are presented as a physical particle system where a collection of video icons move and group together on the screen according to their colour similarity and user interaction. These coloured clus-ters display zones from the video space composed by sets of video with similar colours, and distant from videos with different colours.
In figure 2.4 the available views are observable: the first view (a) displays the video loops which includes frames taken at constant time intervals, working as content overview or summary. The second view (a) represents videos through coloured circles composed by the dominant or average colour from each one. The third view (c) represents movies not only by their colours, but through a set of rectangles with coloured stripes featuring
the proportion in which they dominate inside the video.
Figure 2.4: Different Views in ColorsInMotions.
The fourth view (d) emphasis the motion aspects of video by representing them with image loops, where each image captures the movement through the average of pixel colours occurring in each scene from the video.
The last view (e) displays static slit scan images that represents the movement from the movie that have been taken off. A slit scan is a technique to capture the action happening in the video centre, along time, and represent the result sequentially on a static image. This generates a movement effect visible in figure 2.4:e.
Any view allows direct access to any video present in the movie space. By accessing a video, we leave the global space to enter in the video level. At the video level (2.4:f), it is possible to view the entire video, the details and different views. Here, the video is playing the centre. In the top row, the colour aspects are highlighted through the average colour loop and circle (top-row-left), followed by the dominant colours rectangle and the dominant colour circle (top-row-right). To the left of the video, the traditional loop, to the right we have the average scene loop stressing movements aspects and complemented with a scrollable slit scan in the bottom.
It is also possible to search and select videos based on cultural contexts, through av-erage or dominant colour. This search can be achieved by selecting one or more colours from a palette or from the real world through a web-cam. The search can be issued from any of the video spaces views. Results are presented in the same view where the search was issued.
includes emotions, sound events and other video dimensions. Searches and navigation are constrained to the colours and movement properties extracted from videos.
2.2 Visualization And Classification of Audio and Video
Information
“Visualization is defined as the use of computer supported, interactive visual representa-tions of data to amplify cognition, helping people to understand and analyse data”, turning “empirical observations into explanations and evidence” [7, 59].
There are different ways for representing data to the user. In [32], some important con-cepts guidelines are presented that should be followed during the design and creation of data visualizations. These include the importance of balancing the quantity of displayed information vs complexity, the use of overviews for giving the user a sense of context and help finding information, the possibly of choosing and getting more details about chosen subsets of information (e.g. zoom) and different levels of information in order to provide higher detail and maintain coherence, the importance of data comparison by displaying relationships between items, the use colour techniques to address multidimensionality and the importance of sorting information by time and space allowing the representation of movement and info flow, besides being considered hard to handle. It also presented a structured criteria for dealing with representation of temporal dimension.
This section presents some concepts, projects, studies and applications about visual-ization and classification of audio and video.
2.2.1 Twitter Lyrics
Twitter Lyrics [3] is a project aimed for alternative visualization and popularity analysis of songs based on user preferences instead of resorting to the music industry rating system.
It uses Twitter, a worldwide social network built around the concept of short status messages nicknamed as Tweets, as a source for obtaining data about the popularity of music worldwide. Twitter Lyrics expects to gather a dataset of trends and sales for future comparison with the ratings provided by the top music industry charts. These trends can be obtained by exploring the number of times a song lyrics were quoted in status messages, obtaining an “accurate insight into the perceived value of the song”.
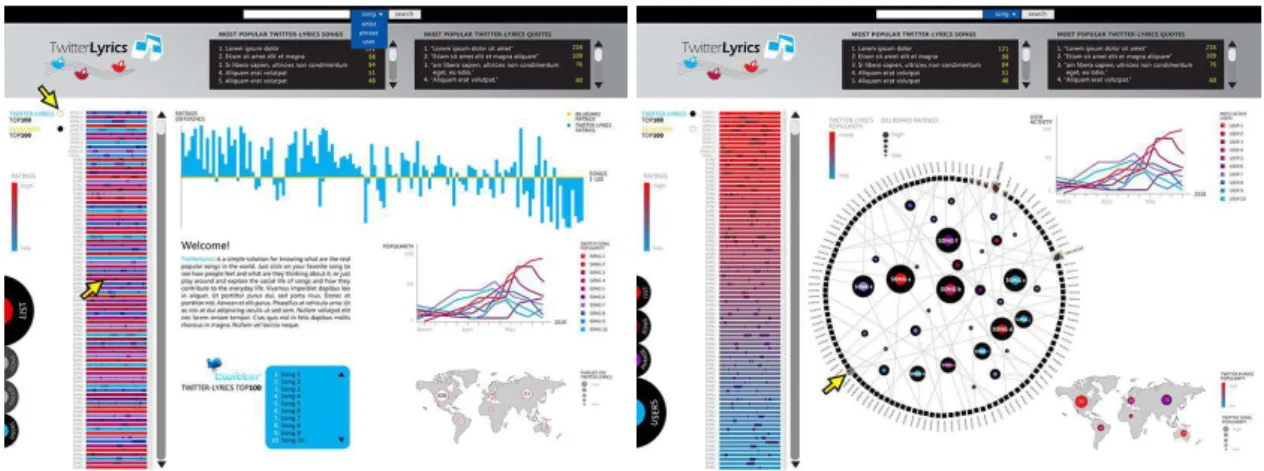
Figure 2.5 displays two of the public images disclosed of the project’s analytics tool, showing some trend graphs and visualizations obtained from Twitter data.
What makes the project even more interesting is the capability of perceiving the real emotion that these musics evoke and associations created in the people’s minds by analysing comments posted in a real social network, by users, quoting lyrics from songs, features not present in music industry ratings and charts, where they currently use the
al-Figure 2.5: Twitter Lyrics Demo Version Screenshots
bums sales and commercial success of artists as the source of information. Twitter Lyrics information could be used to facilitate the bounding of people through these associated and evoked feelings and might provide an alternative perspective of the music industry [3].
Figure 2.6: Twitter Lyrics Visualizations
In figure 2.6 it is possible to observe different kinds of visualizations, including bar graphs to display differences between selected charts (b) or about a song or a phrase (a),
line charts for observing changes in popularity of a set of songs or phrases (c), trend graphs displaying the geo-localization of users (d), and a bar visualization with timeline for displaying popularity of phrases within a song (e).
2.2.2 Last.fm
Last.fm2is a music recommendation service where users can receive personalized
recom-mendations based on their current listening habits. Being also a social network, Last.fm users can also comment on other users profile (shouts), mark the songs that they love the most or ban them from their library, comment on an artists/album/track page and comment on user groups, and add textual tags to the artists, albums and tracks.
2.2.2.1 Recommendations and Scrobbling
Some of the features previously mentioned are publicly accessible. However, without a user account the only possible recommendations are based on artist similarity. An account is required to submit new comments and tags, mark songs, and to use the recommendation system.
The recommendation system requires user information to provide good recommen-dations. A user can use the system by adding artists to the profile library and obtain recommendations based on artist similarity and artists tags.
To improve the results obtained from the recommendation service, the user should configure a utility program available on the site3, titled The Scrobbler, which reports to
Last.fm every music listened, providing the listened track name, album and artist. Each entry is denominated as Scrobble.
Scrobbling4 enables the tracking of the users listening habits and provides a unique and highly personalized recommendation results for every user. Users can also obtain statistical data from their habits and easily compare them with other users.
2.2.2.2 Last.fm Tagging System
In Last.fm, users can label artists, albums and tracks with textual tags. In each artist/al-bum/track page, the most common tags are displayed and sorted by number of users. Tags are usually used to describe the music by its genre, but you can find tags about expressed emotions, music tempo or melody, lyrics idiom, artist group country, and other miscella-neous subjects.
Tags act as a categorical classification for the whole artist/album/artist, reflecting the interpretation of users about the listened music. Tags also take an important role in
2http://www.last.fm/
3As alternative to the official Scrobbler application, many music players and platforms provides integra-tion with Last.fm natively or through plug-ins.
Figure 2.7: Last.fm tag cloud for the artist “The Black Keys”. On the top, the old last.fm design using a classic weighted tag cloud paradigm, on the bottom the most recent design using the same paradigm but displaying weight through colour intensity.
the last.fm recommendation system and other Last.fm services [36]. In 2007, Last.fm database contained more than 1 million unique free-text labels used to annotate millions of songs [61].
With the rising community of Last.fm users, the number of tags is also increasing at an exponential rate, allowing the extraction of information about instrumental characteristics and common emotional reactions from these tags. Last.fm provides a REST webservice API to access all stored information, including tags.
All tags are assigned freely by the users with valid user account. To create an account, users must provide a username, password and an existing email address (which is verified later). There are no specific guidelines for music or artist classification and not everyone is a musical expert, thus, it is expectable to have users incorrectly classifying artists because their musical expertise is not high enough or due to others factors like the user’s current motivational state or disposition.
Users can also provide incorrect tags on purpose, a single user cannot have a negative effect in an artist classification, because their tags have no practical weight or importance by counting only as one vote, becoming outliers, unless the music or artist do not have a significant number of tags.
With a significant number of tags given by dozens, hundreds and even more different users, common tags will stand out of the remaining tags, and those common tags can
be used as information for music classification, since they are the product of common agreement between the Last.fm users community.
2.2.2.3 Last.fm Discover
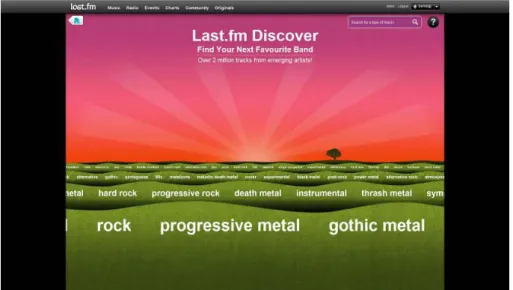
Last.fm Discover5 uses the recommendation system and tagging systems to allow the
users to explore new music using a tag wave visualisation (Figure 2.5). The main view shows a landscape composed by four layers of small green hills and a sunrise in the horizon. Each layer of hills displays a group of music tags from the database, whereas the nearest layer displays the most significant tags and the farthest layer displays related tags to the ones in the previous layer.
Figure 2.8: Last.fm Discover Main View
The initial shown tags are chosen based on the user’s recent listening habits and the user must pick a tag. When the user selects a tag, the layer’s content refreshes and the new tags are related to the current selected tag. The user is now allowed to play music tracks directly related to the selected tag.
When the user clicks “Play”, the layers refresh again and instead of tags, they display music tracks names, album image and artist in each layer, and a music player for playback of the music in the first layer (Figure 2.9). The user has the option to skip ahead into another similar artist’s track, select a track in one of the layers, update the layers with tracks similar to the current playing song, or skip and update the tags with different music style within the initial selected tag.
Figure 2.9: Last.fm Discover Album View 2.2.2.4 Mood Report For Last.fm
With the huge musical dataset obtained from the users, the Last.fm team has been actively working on many projects to extract useful information from the artists information, artists and music tags, and users listening habits to improve the recommendation system and the radio service.
One of these emerging and promising projects is the Mood Report6, a stream graph
based visualization that displays the music mood from the listening history (submitted Scrobbles) of a Last.fm user. Examples of mood tags include ’Aggressive’, ’High En-ergy’, ’Punchy Dynamics’, ’Fast’, ’Slow’, ’Strong Dance beat, ’Smooth’, ’Happy’, ’Sad’, ’Relaxing’, ’Ambient’, etc.
It is not clearly stated how and why these specific tags where chosen but it is closely related to a study from the same author in [37], where he concludes that social “tags de-fine a low-dimensional semantic space that is extremely well-behaved at the track level in particular being highly organised by artist and musical genre”, and introduces Correspon-dence Analysis for the visualization of such semantic space and how it can be applied to display musical emotion. In the same article, the author refers to some emotional representation studies. The tags weights are obtained automatically from extracted infor-mation from a music analysis system, built by Last.fm, which uses user feedback from three different demonstrations7 8 9for confirmation of the results and optimization of the
automatic analysis [36]. This visualization, observable in Figure 2.10, lets users observe mood changes in their musical life over the past 120 days. The graph height represent all
6http://playground.last.fm/demo/moody
7http://playground.last.fm/demo/speedo/
8http://playground.last.fm/demo/complexity/
Figure 2.10: An example of a Mood Report from an active Last.fm user the user’s listened music normalized to a fixed height grouped by weeks.
Besides being far from perfectly accurate, due to the difficulties of automatic tag-ging [36], in the future, users will have a potential benefit from a highly adaptive music recommendation, radio streams and automatic music playlist systems. They will adapt not only to their current musical taste, but will take into account the expressed mood in all audio tracks, improving the user listening experience by making possible a matching of the music mood and other characteristics with the current user mood. For instance, users in a bad mood or experiencing tense or depressing moments will be able to request sug-gestions of happy and calm music tracks to influence their current mood in a positive way (e.g. a writer working on a sad novel may try to find and listen to sad and depressing mu-sic to get in the correct mood to obtain inspiration). Such system could be implemented in any audio player, being only necessary to have a local or remote mood database where the track mood could be obtained, and Last.fm is a candidate for this job.
2.2.3 The Structure Of The World-wide Music with Last.fm
A example of what can be done with Last.fm data is the representation of all artists in a map highlighted their similarity relationship as it can be shown in figure 2.11 [47].
The project’s author crawled the Last.fm database using the Audioscrobbler API and obtained a list of artists, artist relationships and tags found. The crawl was conducted by starting from an arbitrary artist (in this case, Nightwish10) and by expanding the search to
its similar artists. Some measures have been taken to prevent erroneous data, for example including artists without a MusicBrainz11 ID. But the author notes these measures also
10http://last.fm/music/Nightwish
11MusicBrainz is an open music encyclopedia that collects music metadata and makes it available to the public. http://musicbrainz.org/
could prevent the inclusion of legitimate musicians who are not popular enough or do not possess a MusicBrainz ID, and artists who are not reachable through similarity path from the starting artist.
Figure 2.11: Artist’s Map Graph of Last.fm
Each vertex (node) in the graph represents an artists and each edge (line) represents a similarity relation between two artists. The nodes size are proportional to the number of listeners of the top track of that specific artist. The nodes colours represent information about the artist main musical genre inferred from the top tags (most common tags) that have been attributed to the artist: Red is related to generic rock music types including classic, punk, hard and alternative rock; Green is related to pop, soul and funk; Black is related to heavy metal music and all sub-genres; Orange is related to electronic music and all sub-genres; Dark Blue is related to hip-hop and rap music, Yellow relates to jazz, brown relates to country, folk and world music, Light Blue is related to classical music; and Pink relates to reggae and ska music.
The edges colours are chosen according to their betweenness centrality12scores in the
entire node network. [58]
12Betweenness centrality is a measure of a node’s centrality in a network. It is equal to the number of shortest paths from all vertices to all others that pass through that node.
2.2.4 Audio Flowers: Visualising The Sound Of Music
What makes an arbitrary music track so different from another even if composed from the same musical instruments? In Music Theory, there are diverse characteristics, elements, parameters or facets that composers can manipulate to create a huge set of unique music pieces, and that most of them can be distinguished by the common listener (Boretz, 1995). The fundamental elements of music include pitch, rhythm, melody, harmony, texture, timbre, structure, tempo, etc.
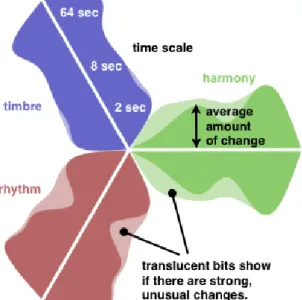
Figure 2.12: Audio Flower Representation Changes to each of these elements will
be noticed by the listener. For instance, different versions of the same song can have differences in certain musical ele-ments such a richer rhythm or pitch [44]. Pitch, which is based primarily on the fre-quency of vibration, changes depending on the source of the sound, thus each musical instrument has a particular pitch, and such difference allows for the listener to iden-tify the source of a specific sound even in the middle of many others (e.g. a bass gui-tar sound in a music track).
Another project from Last.fm team is a compact visualization of music structural
changes of Rhythm, Harmony and Timbre in a flower like graph: Audio Flowers [44]. The visualization is composed by 3 petals. Each petal represents a fundamental el-ement: red for rhythm, blue for timbre and green for harmony. and created from two overlaid graphs (an opaque and a translucent graph) obtained from a plot of the calcula-tion of a 100-point smoothed interpolacalcula-tion of values obtained from an audio source (e.g. a music file) analysis, where the closest value to the centre of the representation is the start of the sound track (short time scale) and the tip of the petal the end of the track. The wider the petal is the greater the difference in the specific musical element represented by its colour, being the opaque graph the normalised median values and the translucent graph the normalised mean values. Figure 2.12 illustrates the proposed Audio Flower representation13, exemplified in Figure 2.13 with four different music tracks [44].