INFORMATION MANAGEMENT
Specialization in Geographical Information Systems
A REMOTE SENSING APPROACH TO THE
QUANTIFICATION OF LOCAL TO GLOBAL SCALE
SOCIAL-ECOLOGICAL IMPACTS OF
ANTHROPOGENIC LANDSCAPE CHANGES
Rajchandar Padmanaban
A thesis submitted in partial fulfillment of the requirements for the
of Doctor in Information Management
February, 2019
NOVA Information Management School
Instituto Superior de Estatística e Gestão de Informação
Universidade Nova de Lisboa
A Remote Sensing Approach to the Quantification of
Local to Global Scale Social-Ecological Impacts of
Anthropogenic Landscape Changes
This thesis is approved by:
Professor Dr. Pedro Cabral, Supervisor
NOVA Information Management School (NOVA IMS), Universidade Nova de,
Lisboa, Campus de Campolide, 1070-312 Lisboa, Portugal.
Dr. Avit K. Bhowmik, Co-Supervisor
Assistant Professor, Department of Risk and Environmental Studies,
Karlstad University,
Universitetsgatan 2, 651 88 Karlstad, Sweden.
.
A REMOTE SENSING APPROACH TO THE
QUANTIFICATION OF LOCAL TO GLOBAL SCALE
SOCIAL-ECOLOGICAL IMPACTS OF
ANTHROPOGENIC LANDSCAPE CHANGES
DISSERTATION
to attain
the degree of doctor at the Universidade Nova de Lisboa (NOVAIMS), Portugal,
on the authority of the Dean, Prof. Dr. Pedro Saraiva and the Coordinator of
the Ph.D. in Information Management, Prof. Dr. Tiago Oliveira
on account of the assessment of the graduation committee, to be submitted
on 20
th, February 2019
by
RAJCHANDAR PADMANABAN
from
I herewith declare that I have independently drawn up my Ph.D. dissertation entitled
“A remote sensing approach to the quantification of local to global scale
social-ecological impacts of anthropogenic landscape changes”. All aids and sources have
been clearly specified, and the contribution of other scientists or authors have been
clearly documented. I further certify that proper citations to the previously reported
work have been given and no data has been quoted verbatim from other publications
without giving due acknowledgement and without the permission of the author(s). I
have never received any paid assistance by any sort of Ph.D. service agencies. The
dissertation has neither identically nor in a similar form been submitted for any
scientific examination in Portugal, Europe or in another country. Moreover, the
dissertation has neither earlier nor simultaneously been submitted at any other
university or faculty. I am fully aware that the Ph.D. title can be revoked as a result of
failure to regard any of the aforementioned points and legal consequences are also
possible.
RAJCHANDAR PADMANABAN
NOVA Information Management School (NOVA IMS), Universidade Nova de Lisboa,
Campus de Campolide, 1070-312 Lisboa, Portugal.
Copyright © by
RAJCHANDAR PADMANABAN
Landuse and Landcover (LULC) is the common aspect that influences several ecological issues, environmental degradations, changes in Land Surface Temperature (LST), hydrological changes and ecosystem function at regional to global level. Research on the drivers and progressions of LULC change has been key to developing models that can project and predict future LULC extent, level and patterns under different assumptions of socioeconomic, ecological and environmental situations. Rapid and extensive urbanization and Urban Sprawl (US), propelled by rapid population growth leads to the shrinkage of productive agricultural lands, boosting mining, decrease in surface permeability and the emergence of Urban Heat Islands (UHI), and in turn, adversely affects the provision of ecosystem services. Mining for resources extraction may lead to geological and associated environmental changes due to ground movements, collision with mining cavities, and deformation of aquifers. Geological changes may continue in a reclaimed mine area, and the deformed aquifers may entail a breakdown of substrates and an increase in ground water tables, which may cause surface area inundation. Consequently, a reclaimed mine area may experience surface area collapse, i.e., subsidence, and degradation of vegetation productivity.
The greater changes in LULC, US, LST and vegetation dynamics due to increasing human population not only affects inland forest and wetland, it also directly influences coastal forest lands such as mangroves, peat swamps and riparian forest and threats to ecosystem services. Mangroves provide valuable provisioning (e.g. aquaculture, fisheries, fuel, medicine, textiles), regulation (e.g. shoreline protection, erosion control, climate regulation), supporting (nutrient cycling, nursery habitat), and cultural (recreation and tourism) ecosystem services with an important impact on human well-being. However, the mangrove forest is highly threatened due to climate changes, and human activities which ignore the ecological and economic value of these habitats, contributing to its degradation. There is an increasing number of studies about mangrove distribution, changes and re-establishment activities, denoting a growing attentiveness on the value of these coastal wetland ecosystems. Most of these studies address mangrove degradation drivers at regional or local levels.
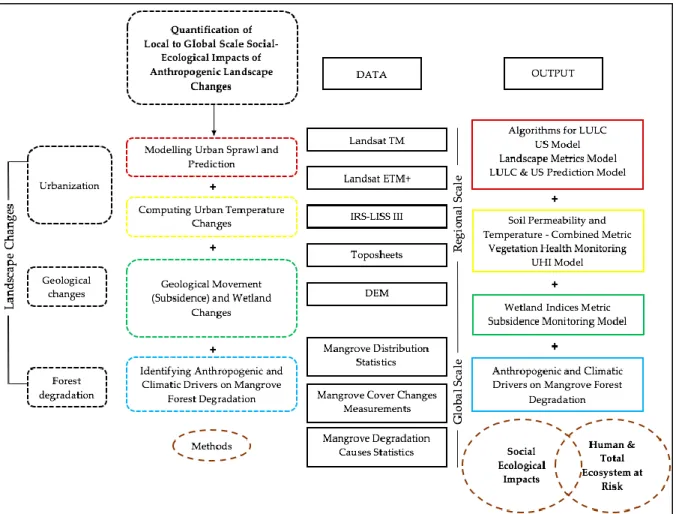
addressed using multidisciplinary methodology and conditions. Therefore, this dissertation aimed to assess the impact of LULC associated with vegetation, temperature and wetland changes. To understand the relation among three different types of landscape changes associated with anthropogenic activities: Urbanization, Geological changes and Forest degradation at local to global level, we have selected thirty-three global regions.
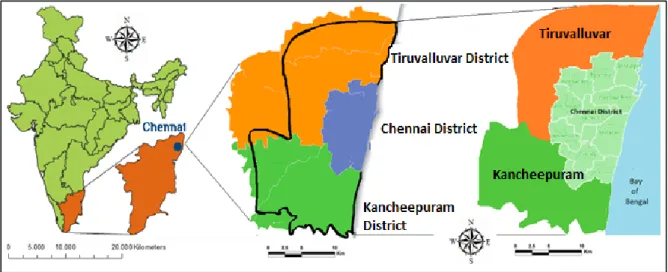
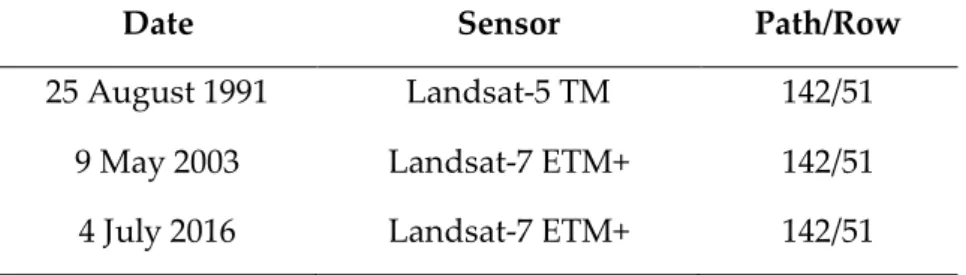
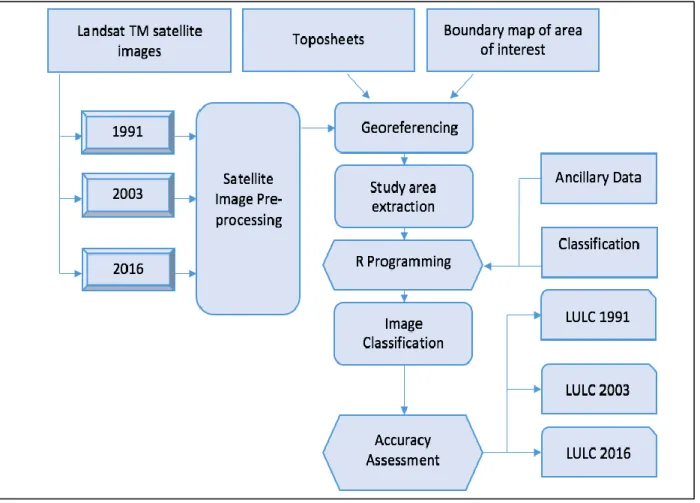
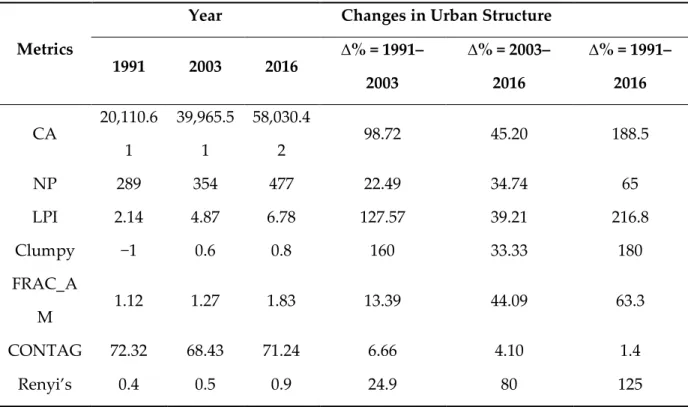
In chapter 2, We employed the Random Forest (RF) classification on Landsat imageries from 1991, 2003, and 2016, and computed six landscape metrics to delineate the extent of urban areas within a 10km suburban buffer of Chennai city, Tamilnadu, India. The level of US was then quantified using Renyi’s entropy. A land change model was subsequently used to project land cover for 2027. A 70.35% expansion in urban areas was observed mainly towards the suburban periphery of Chennai between 1991 and 2016. The Renyi’s entropy value for year 2016 was 0.9, exhibiting a two-fold level of US when compared to 1991. The spatial metrics values indicate that the existing urban areas became denser and the suburban agricultural, forests and particularly barren lands were transformed into fragmented urban settlements. The forecasted land cover for 2027 indicates a conversion of 13,670.33 ha (16.57% of the total landscape) of existing forests and agricultural lands into urban areas with an associated increase in the entropy value to 1.7, indicating a tremendous level of US. Our study provides useful metrics for urban planning authorities to address the social-ecological consequences of US and to protect ecosystem services.
In chapter 3, We studied landscape dynamics in Kirchheller Heide, Germany, which experienced extensive soil movement due to longwall mining without stowing, using Landsat imageries between 2013 and 2016. A Random Forest image classification technique was applied to analyse landuse and landcover dynamics, and the growth of wetland areas was assessed using a Spectral Mixture Analysis (SMA). We also analyzed the changes in vegetation productivity using a Normalized Difference Vegetation Index (NDVI). We observed a 19.9% growth of wetland area within four years, with 87.2% growth in the coverage of two major waterbodies in the reclaimed mine area. NDVI values indicate that the productivity of 66.5% of vegetation of the Kirchheller Heide was degraded due to
mitigation areas from land surface and vegetation degradation in Kirchheller Heide.
In chapter 4, We demonstrated the advantage of fusing imageries from multiple sensors for LULC change assessments as well as for assessing surface permeability and temperature and UHI emergence in a fast-growing city, i.e. Tirunelveli, Tamilnadu, India. IRS-LISSIII and Landsat-7 ETM+ imageries were fused for 2007 and 2017, and classified using a Rotation Forest (RF) algorithm. Surface permeability and temperature were then quantified using Soil-Adjusted Vegetation Index (SAVI) and Land Surface Temperature (LST) index, respectively. Finally, we assessed the relationship between SAVI and LST for entire Tirunelveli as well as for each LULC zone, and also detected UHI emergence hot spots using a SAVI-LST combined metric. Our fused images exhibited higher classification accuracies, i.e. overall kappa coefficient values, than non-fused images. We observed an overall increase in the coverage of urban (dry, real estate plots and built-up) areas, while a decrease for vegetated (cropland and forest) areas in Tirunelveli between 2007 and 2017. The SAVI values indicated an extensive decrease in surface permeability for Tirunelveli overall and also for almost all LULC zones. The LST values showed an overall increase of surface temperature in Tirunelveli with the highest increase for urban built-up areas between 2007 and 2017. LST also exhibited a strong negative association with SAVI. South-eastern built-up areas in Tirunelveli were depicted as a potential UHI hotspot, with a caution for the Western riparian zone for UHI emergence in 2017. Our results provide important metrics for surface permeability, temperature and UHI monitoring, and inform urban and zonal planning authorities about the advantages of satellite image fusion.
In chapter 5, We identified mangrove degradation drivers at regional and global levels resulted from decades of research data (from 1981 to present) of climate variations (seal-level rising, storms, precipitation, extremely high water events and temperature), and human activities (pollution, wood extraction, aquaculture, agriculture and urban expansion). This information can be useful for future research on mangroves, and to help delineating global planning strategies which consider the correct ecological and economic value of mangroves protecting them from further loss.
O uso e a cobertura da Terra (UCT) são o aspeto comum que influencia várias questões ecológicas, degradações ambientais, mudanças na temperatura da superfície terrestre, mudanças hidrológicas, e de funções dos ecossistemas a nível regional e global. A investigação sobre os determinantes e progressão da mudança de UCT tem sido fundamental para o desenvolvimento de modelos que podem projetar e prever a extensão, o nível e os padrões futuros de UCT sob diferentes hipóteses de situações socioeconómicas, ecológicas e ambientais. A rápida e extensa urbanização e expansão urbana impulsionada pelo rápido crescimento populacional, levou ao encolhimento de terras agrícolas produtivas, impulsionando a mineração, a diminuição da permeabilidade da superfície e o surgimento de ilhas urbanas. Por outro lado, tem afetado negativamente a produção de serviços de ecossistemas. A mineração para extração de recursos pode levar a mudanças geológicas e ambientais devido a movimentos do solo, colisão com cavidades de mineração e deformação de aquíferos. As mudanças geológicas podem continuar numa área de mina recuperada, e os aquíferos deformados podem acarretar uma quebra de substratos e um aumento nos lençóis freáticos, causando a inundação na superfície. Consequentemente, uma área de mina recuperada pode sofrer um colapso à superfície, provocando o afundamento e a degradação da produtividade da vegetação.
As mudanças na UCT, no crescimento urbano rápido, na temperatura da superfície terrestre e na dinâmica da vegetação devido ao aumento da população humana não afetam apenas a floresta interior e as zonas húmidas. Estas também influenciam diretamente as terras florestais costeiras, tais como mangais, pântanos e florestas ribeirinhas, ameaçando os serviços de ecossistemas. Os mangais proporcionam um aprovisionamento valioso (por exemplo, aquacultura, pesca, combustível, medicamentos, têxteis), a regulação (por exemplo, proteção da linha de costa, controlo da erosão, regulação do clima), os serviços de ecossistema de apoio (ciclo de nutrientes, habitats) e culturais (recreação e turismo) com um impacto importante no bem-estar humano. No entanto, a floresta de mangal é altamente ameaçada devido às mudanças climáticas e às atividades humanas que ignoram o valor ecológico e económico desses habitats, contribuindo para a sua degradação. Há um número
zonas húmidas. A maioria desses estudos aborda os fatores de degradação dos mangais a nível regional ou local. No entanto, ainda não há avaliação suficiente sobre os determinantes da degradação dos mangais a nível global. Assim, a complexidade da degradação da paisagem interior e costeira deve ser abordada usando uma metodologia multidisciplinar. Portanto, esta dissertação teve, também, como objetivo avaliar o impacto do UCT associado à vegetação, temperatura e mudanças de zonas húmidas. Para compreender a relação entre a dinâmica da paisagem associada às atividades antrópicas a nível local e global, selecionámos quatro áreas de estudo, duas da Ásia, uma da Europa e outro estudo a nível global.
No capítulo 2, empregamos a classificação Random Forest (RF) nas imagens Landsat de 1991, 2003 e 2016, e computamos seis métricas de paisagem para delinear a extensão das áreas urbanas numa área de influência suburbana de 10 km da cidade de Chennai, Tamil Nadu, Índia. O nível de crescimento urbano rápido foi quantificado usando a entropia de Renyi. Um modelo de UCT foi posteriormente usado para projetar a cobertura de terra para 2027. Uma expansão de 70,35% nas áreas urbanas foi observada principalmente para a periferia suburbana de Chennai entre 1991 e 2016. O valor de entropia do Renyi para 2016 foi de 0,9, exibindo uma duplicação do nível de crescimento urbano rápido quando comparado com 1991. Os valores das métricas espaciais indicam que as áreas urbanas existentes se tornaram mais densas e as terras agrícolas, florestas e terras particularmente áridas foram transformadas em assentamentos urbanos fragmentados. A previsão de cobertura da Terra para 2027 indica uma conversão de 13.670,33 ha (16,57% da paisagem total) de florestas e terras agrícolas existentes em áreas urbanas, com um aumento associado no valor de entropia para 1,7, indicando um tremendo nível de crescimento urbano rápido. O nosso estudo fornece métricas úteis para as autoridades de planeamento urbano para lidarem com as consequências socio-ecológicas do crescimento urbano rápido e para proteger os serviços de ecossistemas.
Landsat entre 2013 e 2016. Uma técnica de classificação de imagem Random Forest foi aplicada para analisar dinâmicas de UCT e o crescimento das áreas de zonas húmidas foi avaliado usando uma Análise de Mistura Espectral. Também analisámos as mudanças na produtividade da vegetação usando um Índice de Vegetação por Diferença Normalizada (NDVI). Observámos um crescimento de 19,9% da área húmida em quatro anos, com um crescimento de 87,2% de dois principais corpos de água na área de mina recuperada. Valores de NDVI indicam que a produtividade de 66,5% da vegetação de Kirchheller Heide foi degradada devido a mudanças nos lençóis freáticos e inundações superficiais. Os resultados informam as autoridades de gestão ambiental e recuperação de mineração sobre os pontos de subsidência e áreas de mitigação prioritárias da degradação da superfície e da vegetação da terra em Kirchheller Heide.
No capítulo 4, demonstramos a vantagem de fusionar imagens de múltiplos sensores para avaliações de mudanças de UCT, bem como para avaliar a permeabilidade, temperatura da superfície e a emergência do ilhas de calor numa cidade em rápido crescimento, Tirunelveli, Tamilnadu, Índia. As imagens IRS-LISSIII e Landsat-7 ETM + foram fusionadas para 2007 e 2017, e classificadas usando um algoritmo de Random Forest (RF). A permeabilidade de superfície e a temperatura foram então quantificadas usando-se o Índice de Vegetação Ajustada pelo Solo (SAVI) e o Índice de Temperatura da Superfície Terrestre (LST), respectivamente. Finalmente, avaliamos a relação entre SAVI e LST para Tirunelveli, bem como para cada zona de UCT, e também detetamos a emergência de pontos quentes de emergência usando uma métrica combinada de SAVI-LST. As nossas imagens fusionadas exibiram precisões de classificação mais altas, ou seja, valores globais do coeficiente kappa, do que as imagens não fusionadas. Observámos um aumento geral na cobertura de áreas urbanas (áreas de terrenos secos e construídas), e uma diminuição de áreas com vegetação (plantações e florestas) em Tirunelveli entre 2007 e 2017. Os valores de SAVI indicaram uma extensa diminuição na superfície de permeabilidade para Tirunelveli e também para quase todas as classes de UCT. Os valores de LST mostraram um aumento global da temperatura da superfície em Tirunelveli, sendo o maior aumento para as áreas urbanas entre 2007 e 2017.
chamada de atenção para a zona ribeirinha ocidental onde foi verificada a emergência de uma ilha de calor em 2017. Os nossos resultados fornecem métricas importantes sobre a permeabilidade da superfície, temperatura e monitoramento de ilhas de calor e informam as autoridades de planeamento sobre as vantagens da fusão de imagens de satélite.
No capítulo 5, identificamos os fatores de degradação dos mangais a nível regional e global resultantes de décadas de dados de investigação (de 1981 até o presente) de variações climáticas (aumento do nível das águas do mar, tempestades, precipitação, eventos extremos de água e temperatura) e atividades humanas (poluição, extração de madeira, aquacultura, agricultura e expansão urbana). Estas informações podem ser úteis para investigações futuras sobre mangais e para ajudar a delinear estratégias de planeamento global que considerem o valor ecológico e económico dos mangais, protegendo-os de novas perdas.
L
ist of Publications:
(1) Padmanaban, Rajchandar, Avit K. Bhowmik, Pedro Cabral, Alexander Zamyatin, Oraib
Almegdadi, and Shuangao Wang. "Modelling urban sprawl using remotely sensed data: A case study of Chennai city, Tamilnadu." Entropy 19, no. 4 (2017): 163. Source:
https://www.mdpi.com/1099-4300/19/4/163/htm
(2) Padmanaban, Rajchandar, Avit K. Bhowmik, and Pedro Cabral. "A remote sensing
approach to subsidence and vegetation degradation in a reclaimed mine area." ISPRS Int.J.
Geo-Inf 6, no. 6 (2017): 401. Source: https://www.mdpi.com/2220-9964/6/12/401
(3) Padmanaban, Rajchandar, Avit K. Bhowmik, and Pedro Cabral. "Satellite image fusion to
detect changing surface permeability and emerging urban heat islands in a fast-growing city." PloS one 14.1 (2019): e0208949.
Source: https://journals.plos.org/plosone/article?id=10.1371/journal.pone.0208949
(4) Padmanaban, Rajchandar, Avit K. Bhowmik, and Pedro Cabral. “What drives global
mangrove degradation? (In preparation)
C
onferences:
(1) Padmanaban, Rajchandar, “Mangrove degradation”, National conference on Recent
Innovations in Engineering, Science and Management (RJEM) 2018 sponsored by Indian Space Research Organization and organized by Department of Civil Engineering, Dr. N.G.P Institute of Technology, Coimbatore on September 28, 2018.
(1) Padmanaban, Rajchandar and Avit K. Bhowmik, “Swallowing valuable land - Rapid
urban expansion leaves India mega city Chennai without essential ecosystem services”, Stockholm Resilience Centre Newsletter (2017), Source:
https://www.stockholmresilience.org/research/research-news/2017-05-10-swallowing-valuable-land.html.
(2) Padmanaban, Rajchandar and Avit K. Bhowmik, “Urbanization of Tirunelveli city might
warm it up” The Hindu Newspaper (2019), Source:
https://www.thehindu.com/sci-tech/science/urbanisation-of-tirunelveli-city-might-warm-it-up/article26037548.ece.
(3) Padmanaban, Rajchandar and Avit K. Bhowmik, “Hot in the city”, Stockholm Resilience
Centre Newsletter (2019), Source:
https://www.stockholmresilience.org/research/research-news/2019-02-01-hot-in-the-city.html
P
apers related to the thesis (Not included in the dissertation):
(1) Fakhruddin, Bapon, Rubini Mahalingam, and Rajchandar Padmanaban. "Sustainable
development goals for reducing the impact of sea level rise on mangrove forests." Indian
Journal of Geo-Marine Sciences 47, no. 10 (2018): 1947-1958.
Source: https://run.unl.pt/handle/10362/50862.
(2) Padmanaban, Rajchandar, S. Karuppasamy, and Rubini Narayanan. "Assessment of
pollutant level and forecasting water pollution of Chennai Coastal, Tamilnadu using R." Indian Journal of Geo-Marine Sciences 47, no. 7 (2018): 1420-1429.
To my Mother, Muthulakshmi Padmanabhan
To my Father, Padmanabhan Durai Raj
“காலத்தினாற்செய்த நன்றி ெிறிசதனினும்
ஞாலத்தின் மாணப் செரிது” - திருக்குறள்
“Although an action of help done timely, might be little in nature, it is truly larger than the world itself”- Thiruvalluvar (A Tamil Poet), Kural (Couplet).
First and Foremost, I am very grateful to my mother, my father, my mother tongue “Tamil” and the almighty nature for the blessings to complete this project. My heartfelt gratitude goes to NOVAIMS Dean, Prof. Dr. Pedro Saraiva and the Coordinator of the PhD in Information Management, Prof. Dr. Tiago Oliveira for the acceptance of my PhD dissertation. I wish my special thanks to the former PhD Coordinator Dr. Fernando Bacao for the kind support from the beginning of my PhD application at NOVAIMS.
I wish to express my honest appreciation and thanks to my promoter and supervisor
Prof. Dr. Pedro Cabral,NOVA Information Management School (NOVA IMS), Universidade
Nova de Lisboa, Campus de Campolide, 1070-312 Lisboa, Portugal, for esteemed daily supervision, assistance, and encouragement. I am thankful that you provided me the opportunity to work on this research project. You believed in me from the beginning and lend your hand when I faced difficulties in research. Your direction, advice, coordination, support, technical guidance, and openness for innovative ideas has moulded this dissertation with science contribution in the field of Geographic Information System and Remote Sensing. I wish to describe my full-hearted thankfulness to Dr. Avit.K. Bhowmik, Assistant Professor, Department of Risk and Environmental Studies, Karlstad university, Universitetsgatan 2, 651 88 Karlstad, Sweden, my co-supervisor. Your energetic discussion and critical commenting on research work have helped me to be proficient to emphasise my research finding and succeeded the publication resulting from this dissertation to the top journals. You and Dr. Pedro Cabral have sharpened my technical, writing and reasoning skills and helped me to reach that far in my research. Once again thank you for your excellent supervision.
from NOVAIMS for their valuable support and direction to complete all the credit courses. I am also thankful to all members and colleagues of the NOVA Information Management School. Mr. Yuri Vidal Santiago de Mendonça (Brazil) thanks a lot for helping me with learning a little bit Portuguese and it was great to share the same office and home with you.
Mr. Dahmane Sheikh (Belgium), Mr. Sohaib Zafar Ansari (Portugal) and Mr. Ziad El Abbass (Morocco), I am grateful and happy that you guys spent lot of time with me in Lisbon
when I was stressed and lonely. All my friends and PhD colleagues in NOVAIMS, Meer
Qaisar Javed, Luis Jose Pinto da Fonseca, Iolanda Marcia de Almeida Fernandes Castro Barbeitos, Andre Ferraz Saraiva, Ricardo Galante Coimbra, and Frank Bivar Franque, thank
you guys for the great time and lively discussions during course hours and free time. My
special thanks to my well-wisher and my master program Assistant Professor
Dr. Karuppasamy Sudalaimuthu, SRM University Chennai for great support and advice
during the past eight years.
My grateful thanks to my colleagues in University V.O.C. College of Engineering, Anna university, Tuticorin, Dr. Jeyanthi (Dean), Dr. Aadish Kumar (Head of the Department, Civil Engineering), Dr. Collins Johny, Dr. Mathumathi, Mr. S.Muthupackiaraj, Mrs. A.L. Swarna,
Mr. Ashok Subramanian, Mrs. Snowfy Nivetha, Mrs. Mariammal, Mrs. Nisha
Gunasekaran, Ms. Revathy, Mr. Siva Mahendra Krishnan, Mr. M. Albert Pradeep, Ms. M. Uma and Ms. Gayathri Devi for your great support and pleasant working stay during
my Tamilnadu visit. My hearty cheers and thanks to my students in 2nd, 3rd and 4th year,
Bachelor of Engineering, Geoinformatics from University V.O.C. College of Engineering, Anna University, Thoothukudi, Tamilnadu.
I am grateful to my elder brother Raj Sundar Padmanaban for great support and advice. I am heartly thankful to my sister Praveena Pramananthan, you helped me in lots of situations especially when I was down with sickness and when I faced financial crisis during my stay in Germany, yes your part of money also included in my thesis work. Thank you very much my dear sister. Karthikesan Pramananthan, you lend me a hand in many circumstances when I encountered financial crisis, you helped me to find a part time job, yes that earning aided me
Lakshmi (Tamilnadu), Mr. Essaki Raja (Tamilnadu), Mr. Mijail Naranjo (Ecuador) Mrs. Rubini Narayanan (United Kingdom) and Mrs. Yoga (Germany), you guys helped me in
many ways even I am not in Germany, you guys have taken very good care on my career. Your advice, financial aid and help are more precious and timely accountable.
My special great hearty cheers and thanks to my dearest brother Mohammed Shamsudeen, the days with you are unforgettable, even though you are younger than me you gave me comfort and happiness when I felt sad and faced many problems during PhD thesis. And your small surprises and tons of cares could never be replaced. My heartly thanks to my cousin
Dharani and sister Barathi @ Kamatchi in Tamilnadu. You both have always been there via
Facebook, WhatsApp and Instagram making me feel at home. Both your love and care are priceless.
I wish to extend my genuine thanks and gratefulness to all my friends and relatives for their valuable support, care, and love. Without their support, knowledge and encouragement, this effort would never have been accomplished.
Declaration v
Abstract vii
Resumo (Abstract in Portuguese) x
Original Contribution xiv
Dedication xvii
Acknowledgments xviii
List of Tables xxvii
List of Figures xxx
Acronyms xxxiv
1 Introduction 39
1.1 Global Anthropogenic Landscape Changes………. 39 1.2 Landscape Change and the Urbanization Process………. 40 1.3 Geological Changes Induced by Mining………. 44 1.4 Forest Landscape Degradation………. 47 1.5 Motivation………... 49 1.6 Research Hypotheses………. 55 1.7 Research Objectives……… 56 1.8 Outline of the Dissertation……….... 58 1.9 Research Methodology……….. 60 1.10 Path of Research………. 62
2 Modelling Urban Sprawl using Remotely Sensed Data 67
2.1 Introduction………. 67 2.2 Study Area……….... 68 2.3 Materials and Methods……… 70 2.3.1 Data and Pre-Processing……….... 70 2.3.2 Landuse and Landcover (LULC) Mapping, and Accuracy Assessment……… 70 2.3.3 Quantification of Extent and Level of Urban Sprawl (US)………... 73 2.3.3.1 Extent of US……….... 73 2.3.3.2 Level of US……….. 75
2.4.1 The Extent and Patterns of US between 1991 and 2016………. 78 2.4.2 Change in US Level………... 81 2.4.3 US Extent and Level Prediction for 2027………. 82 2.5 Concluding Remarks………... 84
3 A Remote Sensing Approach to Environmental Monitoring in a Reclaimed Mine Area
88
3.1 Introduction……….. 88 3.2 Study Area………... 90 3.3 Materials and Methods……… 92 3.3.1 Satellite Data……… 92 3.3.2 Image Processing……….... 93 3.3.3 Land-Use and Landcover Classification and Accuracy Assessment………….. 93 3.3.4 Wetland Coverage and Surface Flooding……….... 95 3.3.5 Vegetation Productivity and Coverage……… 96 3.4. Results and Discussion……… 97 3.4.1 Landscape Dynamics During 2013–2016………. 97 3.4.2 Emergence and Growth of Waterbodies……….. 99 3.4.3 Vegetation Productivity………... 100 3.5 Outlook……….. 103
4 Satellite Image Fusion to Detect Changing Surface Permeability and Emerging Urban Heat Islands in a Fast-growing City
107
4.1 Introduction……….. 107 4.2 Study area……….. 110 4.3 Materials and Methods……… 112 4.3.1 Data………... 112 4.3.2 Image Pre-processing………. 112 4.3.3 Image Fusion………... 113 4.3.4 Image Classification……… 115 4.3.5 Accuracy Assessment………... 117
4.3.8 Emergence Potential for Urban Heat Islands……….. 119 4.4 Results and Discussion……….... 120 4.4.1 Landuse and Landcover Changes……….... 120 4.4.2 Changes in Soil Permeability and Surface Temperature………... 124 4.4.3 Urban Heat Islands Emergence……….... 132 4.5 Concluding Remarks………... 135
5 What Drives Mangrove Degradation? 138
5.1 Introduction……….. 138 5.2 Methods………... 140 5.2.1 Document search and Categorization……….. 140 5.2.2 Data Interpretation and Analysis……….. 142 5.3 Results……….... 142 5.3.1 Global Distribution of Mangrove Forest………. 142 5.3.2 Drivers in Mangrove Forest Degradation……… 147 5.3.2.1 Environmental Drivers on Mangrove degradation and Impacts……... 150 5.3.2.1.1 Global Sea Level Rise and Extreme High Water Occurrences.. 150 5.3.2.1.2 Extreme Events in a Warming Environment……….. 151 5.3.2.1.3 Changes in Temperature and Precipitation Patterns…………. 153 5.3.2.2 Anthropogenic Drivers and Impacts……… 155 5.3.2.2.1 Population Growth and Urbanization………. 155 5.3.2.2.2 Aquaculture and Agriculture……… 156 5.3.2.2.3 Coastal Protection Structures and Flood Control Walls……... 158
6 Major Results and Discussion 162
6.1 Modelling Urban Sprawl using Remotely Sensed Data……….. 162 6.2 A Remote Sensing Approach to Environmental Monitoring in a Reclaimed Mine
area………...
162
6.3 Satellite Image Fusion to Detect Changing Surface Permeability and Emerging Urban Heat Islands……….
163
Table No
Title
Page No
2.1 A technical description of the Landsat TM and ETM+ imageries used
in this study………... 70
2.2 Landuse and landcover (LULC) nomenclature………. 71 2.3 Description and formulae for spatial metrics computation………... 73
2.4 Landscape indices, entropy values and their changes in percent…… 80 2.5 Comparison of the LULC areas of three study periods, i.e., 1991,
2003 and 2016, with the predicted LULC areas of Chennai for 2027. 83
3.1 Description of Land-Use and Landcover (LULC) classes………. 95
3.2 Summary of the confusion matrix for the classified images of 2013–
2016 (PA – Producer Accuracy; UA – User Accuracy). ………... 97 3.3 Comparison of the land-use and land cover (LULC) types during
2013–2016……….
99
3.4 Vegetation productivity changes between 2013–2014, 2014–2015, and 2015–2016. Value ranges 0.42–1, 0.08–0.42, and −1–0.08 indicated highly, medium, and lowly productive vegetation, respectively, and the overall changes in their coverage are reported in bold………..
102
4.1 Landuse and landcover (LULC) classes definition……… 117 4.2 Change in the area coverage of the landuse and landcover (LULC)
classes between 2007 and 2017……….
123
4.3 Accuracy assessment results for the landuse and landcover
classification using fused images of 2007 and 2017………... 124
4.4 Changes in the coverage of soil permeability (indicated by soil-adjusted vegetation index (SAVI)) classes in Tirunelveli between 2007 and 2017………..
129
changes in LST……… 4.7 Average land surface temperature (LST) in degrees Celsius by
landuse and landcover cover (LULC) zones……….. 132
4.8 Spearman correlation between soil-adjusted vegetation index (SAVI) and land surface temperature (LST) by landuse and landcover (LULC) zones. All correlation coefficients are statistically significant at p ≤ 0.01………..
134
5.1 List of the combination of mangrove relevant keywords and number of studies considered……….
141
5.2 23 Most mangrove-rich countries and their covered area changes
from 2000 to 2012……… 146 5.3 Ramsar site mangrove loss during 2000 and 2012 147 5.4 Listed several drivers on mangrove studies covered in this paper
N/A – Not available………
Figure No
Title
Page No
1.1 Interaction amongst humans, climate and environmental system in
urban landscape………... 41
1.2 Interaction amongst geological changes and environmental system
in mining landscape………. 46 1.3 Interaction amongst forest changes and environmental systems in
coastal landscape………..
49
1.4 The relationship between increasing human population and
different landscape changes and its consequences……….. 54 1.5 Regional to global scale social-ecological impacts of anthropogenic
landscape associated with different aspects, which threats to ecosystem and biodiversity……….
55
1.6 Thirty-Three global regions covered by the studies in this thesis to understand the impact of different types of landscape changes: Urbanization, Geological changes and Forest degradation…………
57
1.7 Different topics covered in this dissertation………. 59
1.8 Schematic diagram of the work-flow of this dissertation………….. 61 2.1 The study area covering Chennai city and 10 km sub-urban
buffer………...
69
2.2 Flow-chart for image processing, classification and accuracy
assessment………. 72
2.3 Methodology applied for the prediction of urban sprawl extent and
level for 2027………. 76
2.4 Landuse and landcover (LULC) maps for 1991, 2003, and 2016 in
Chennai………. 79
2.5 Simulated LULC map for the year 2027……… 83 2.6 Urban sprawl, i.e., changes in urban extents between 1991–2027... 84
mining-affected area. The changes observed in the surface level using remote sensing (RS) may indicate the geological changes at the subsurface level. The figure is created according to the description of subsidence in Brunn et al. (2002)………..
3.2 Location of Kirchheller Heide and mining area. The maps were
created using Google Maps………. 91
3.3 Methodology for the analysis of landscape dynamics and vegetation health (productivity) (NDVI: Normalized Difference Vegetation Index; ETM: Enhanced Thematic Mapper; SMA: Spectral Mixture Analysis; LULC: Land-use and Land cover)……..
93
3.4 Classified land-use and landcover (LULC) maps of Kirchheller
Heide in July 2013, 2014, 2015, and 2016……… 98
3.5 Changes in the extent and coverage of waterbodies in Kirchheller Heide during 2013–2016. (a) The location of waterbodies (A and B) in the red circle indicate the waterbodies with the highest (87.2%) growth and potential subsidence spots; (b) the dynamics of the extent of waterbodies A and B during the years 2013–2016; and (c) the changes in the area coverage of waterbodies A and B during 2013–2016………..
100
3.6 (a) NDVI map of the Kirchheller Heide mining area in July 2013, 2014, 2015, and 2016. Value ranges 0.42–1, 0.08–0.42, and −1–0.08 indicated highly, medium, and lowly productive vegetation, respectively (see b and Table 6 for details). The location of the waterbodies, which experienced abrupt growth, are in the black circles; (b) Area coverage in km2 by vegetation productivity classes
in 2013, 2014, 2015, and 2016………..
101
4.1 Geographic location and area of Tirunelveli city. The maps were
generated using Google Maps……….... 111
4.2 Methodological flow for landuse and landcover classification, surface permeability, surface temperature and urban heat islands emergence assessment. Fig. legends- DEM: Digital Elevation Model; LULC: Landuse and Landcover; ETM: Enhanced Thematic Mapper; SAVI: Soil-Adjusted Vegetation Index; LST: Land Surface Temperature; UHI: Urban Heat Island……….
114
4.3 (a) Classified landuse and landcover (LULC) maps of Tirunelveli city
4.3 (b) Classified landuse and landcover (LULC) maps of Tirunelveli city
in 2017……….... 122
4.4 (a) Soil-Adjusted Vegetation Index (SAVI) (surface permeability)
maps of the Tirunelveli city in 2007………... 127 4.4 (b) Soil-Adjusted Vegetation Index (SAVI) (surface permeability)
maps of the Tirunelveli city in 2017………...
128
4.5 (a) Land Surface Temperature (LST) maps of the Tirunelveli city for 2007……….
130
4.5 (b) Land Surface Temperature (LST) maps of the Tirunelveli city for
2017………. 131
4.6 UHI emergence potential map of Tirunelveli city for 2017…………. 134 5.1 Studies covered in this review chapter in region wise……… 144 5.2 Mangroves covers assessment from different sources……… 145 5.3 Environmental Drivers in mangrove forest and its consequence….. 149
CART classification and regression tree
CARDS Centre for Agriculture and Rural development studies
CA Class Area
CLUMPY Clumpiness Index
Cu Copper
DT Decision Tree
DEM Digital Elevation Model
DN Digital Number
ETM Enhanced Thematic Mapper
ENVI ENvironment for Visualizing Images
EU European Union
FRAC_AM Fractal Index Distribution
Fe Iron
GEE Google Earth Engine
GPS Global Positioning System
GIS Geographic Information System
Hg Mercury
IHS Intensity-Hue-Saturation
InSAR Interferometric Synthetic Aperture Radar
IRS LISS Indian Remote Sensing Satellite Resourcesat-1 - Linear Imaging Self-Scanning
ISRO Indian Space Research Organization
KC kappa coefficient
LST Land Surface Temperature
LPI Largest patch Index
LASER Light Amplification by Stimulated Emission of Radiation
LIDAR Light Detection and Ranging
LULC Landuse and Landcover
LULCC land use landcover changes
LPS Leica Photogrammetry Suite
Mg Magnesium
Mn Manganese
NRSC National Remote Sensing Centre
NP Number of Patches
NDVI Normalized Difference Vegetation Index
PCA Principal Component Analysis
PIF Pseudo-invariant features
Pb Lead
RQ Research Question
RMS root mean square
Rts Raster Time Series Analysis
Rgdal Raster Geospatial Data Abstraction Library
ROF Rotation Forest
RS Remote Sensing
PIF Pseudo-invariant features
PA Producer Accuracy
Rgdal Raster Geospatial Data Abstraction Library
SMA Spectral Mixture Analysis
UHI Urban Heat Islands
SAVI Soil-Adjusted Vegetation Index
SLC Scan Line Corrector
SAVI Soil-Adjusted Vegetation Index
Sn Tin
TOA Top-of-Atmosphere
TM Thematic Mapper
US Urban Sprawl
UNESCO United Nations Educational, Scientific and Cultural Organization
UEPM urban extent prediction model
USGS United States Geological Survey
UTM Universal Transverse Mercator
UHI Urban Heat Islands
UA User Accuracy
WGS World Geodetic System
“We won’t have a society if we destroy the environment”.
Margaret Mead
C
HAPTER
1
I
ntroduction
1.1 Global Anthropogenic Landscape Changes
Everything that has developed modern human society is delivered by nature and, progressively, research determines the natural world’s incalculable significance to our health, wealth, food and security [1]. The worldwide economic movement eventually depends on different services provided by the environment and nature, assessed to be valued around US$125 trillion a year [1]. Mounting human population and exploding human consumption has substantially degraded 75% of Earth’s land areas [2]. These lands that have either become wastelands, are contaminated, or have been deforested and transformed to agricultural land are also the main driving force behind the unparalleled environmental transformation we are witnessing today, through the augmented demand for water, land, and energy [2]. If this unsustainable growth continues, 95% of Earth’s productive land areas might become degraded by 2050, which will force millions of people to migrate, as food production will break down in many places [3].
Productive land degradation, loss of biodiversity, and climate alteration are diverse aspects of the same principal challenge: the increasingly hazardous influence of our choices on the
health of our natural environment and ecosystem [2]. There are three different types of
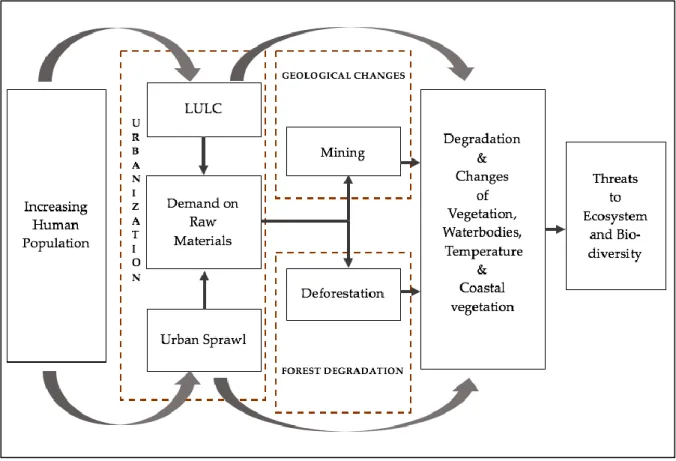
landscape changes that have extensive impacts on the global climate and are interconnected with ecological and biophysical processes: Urbanization, geological changes, and forest degradation [4–7]. The growing threat of climate change rapidly increases due to the decline
of biodiversity by overexploitation of species, deforestation, agriculture, and land
transformation [8]. Climate change is distressing in all parts of the world: disrupting economies, affecting lives, altering the dynamics of entire species on the earth [9]. The Paris agreement in 2015 disclosed the importance of the global participation to reduce the rise in global temperature by 2 degrees Celsius [10]. Greenhouse gases are found to be one of the major reasons for the rising temperature and climate change [11]. Research evidenced that the forests including wetland forests help to reduce the emission of greenhouse gases [12].
Researchers are developing sophisticated new tracking and systematic tools to match commodities and their supply chains to certain influences on the ecosystem. Improving the transparency around these complex relationships may help to stop global climate change and biodiversity loss [1,8,13,14]. By 2020, ensure the conservation, restoration and sustainable use of terrestrial and inland freshwater ecosystems and their services, in particular forests, wetlands, mountains, and drylands, in line with obligations under international Paris agreements [15]. In order to achieve these targets, it is important to find the existing techniques and understand the gaps in analyzing urbanization process, geological changes, and forest degradation, which can help in landscape and climate change related planning.
1.2 Landscape Change and the Urbanization Process
Urbanization is a dynamic and complex progression playing out over various scales of space and time. Globally, in 2008 the urban human population outstripped the non-rural (villages and towns) population for the first time in history and it is projected that 70% of the global population will live in an urban region by 2050, with more than 50% of them intense in Asia [16]. The United Nations (UN) also predicts that the urban population will broaden upsurge from 3.3 billion to 4.9 billion worldwide by 2030 [17]. Almost all future population growth will take place in cities of the developing countries like India, in which the proportion of urbanization and peri-urbanization is faster than in developed countries [18]. Apparently, the area of urban landscape around the world is increasing on average twofold as fast as their populaces, principally in India and China [18]. Almost one-quarter of the global population resides within 100km of the coast and dwells less than 10m above mean sea level [19]. Even though urban landscape cover is comparatively small in the ratio of the total Earth surface, urban landscape modifications drive global environmental change [20]. Increasing physical changes in urban landscape is predominantly categorized by peri-urbanization, the development whereby outskirts both distant or near from the center of cities are converted into cosmopolitan regions [21]. This drives the conversion of productive land, wetland, forest and pastures to urban land includes industrialization and encroachments [22].
An understanding of the development of urbanization and peri-urbanization could support us in coping with evolving environmental problems associated with mounting urban living
[23]. Urban landscape changes have been investigated and examined from several social, cultural, economic and environmental perspective, extending from population density, to urban-rural disparities, to the loss of ecosystem and natural habitats, to bio-diversity, and accumulating emission of greenhouse gas [24–26]. The landscape changes in urban areas have extensive impacts on the global climate which are interconnected with ecological and biophysical processes [4]. The changes in climate induced desertification, deforestation, drought, and loss in biodiversity [27].
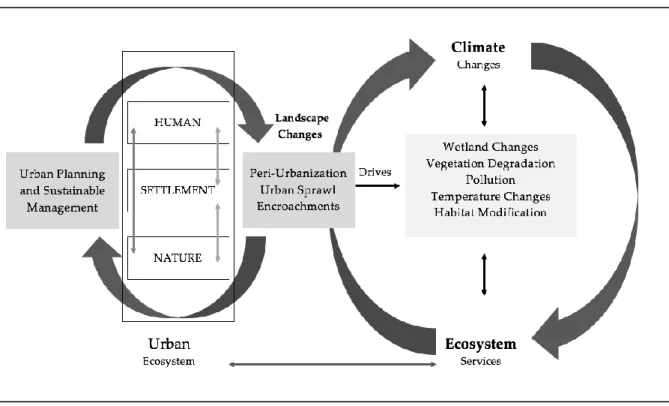
Urbanization in developing countries like India is predominantly taking place in an unplanned way, driving low-density growth and improvident use of environmental resources [28,29]. Thus, time series analysis on urban landscape changes has been considerably recognized as data needed in order to comprehend the interaction amongst humans, climate and environmental systems (Figure 1.1).
Figure 1.1. Interaction amongst humans, climate and environmental systems in urban
landscape
In the last four decades, the development on Remote Sensing (RS)1 technologies has evolved
intensely to comprise a suite of sensors at a broad range and high-resolution imaging scales with probable interest and significance to urban planners and land administrators [30]. RS
data has been extensively used to measure urban growth, Urban Sprawl (US)2, geological
movement and vegetation degradation with majority research using one or more geospatial images to deliver single portraits of landscape changes between different epochs [31]. Easy accessible RS data, the lessening in the price of data and increased 1spectral, 2spatial, 3radiometric and 4temporal resolution from 5spaceborne-satellites and 6airborne-platforms,
have increased the impact of RS technology on urban management [31].
1. Remote Sensing (RS) — Remote sensing is the process of recording and monitoring earth
objects or occurrence at far-away places. The sensors deployed in RS are not in physical contact with features on the earth while measuring its emitted and reflected radiation [32]. The RS process involves: i) Energy source of illumination, ii) Radiation energy interact with the atmosphere, iii) Radiation energy interact with the earth features/target, iv) Recording of energy by the sensor, v) Digital communication, reception, and processing, vi) Interpretation and investigation, vii) Applications. In RS, electromagnetic radiation acts as information carrier between a sensor at satellite or aircraft to the target, that collects information about features shape, size, and characteristics [32]. The two main categories of sensors that can be distinguished are active and passive sensors. The active sensor uses its own source of light energy, i.e., sensors emit radiation that is directed towards earth features to be researched. But in the case of a passive sensor relay, there are other sources of energy, e.g. sunlight [32]. RS facilitates to attain a wide-ranging area at a time, detect the area for a long dwelling time, receive time series information and enables to discover invisible information. This advantages support several applications, including vegetation monitoring, soil mapping, land cover change detection, disaster management, urban modelling, transport network analysis, ecosystem monitoring, and water resource management [32].
Current RS delivers combination and investigation of spatial data from ground-based, aerial and space-borne platforms, with an association to Geographic Information System (GIS)3 data
layers and functions, and evolving urban modeling competencies [33]. This has made RS a valuable data source of urban landscape information.
1Spectral resolution – Spectral resolution explains the ability of a sensor to define fine wavelength intervals [34]. 2Spatial resolution – Spatial resolution defines how much detail in a photographic image is visible to the human eye [34]. 3Radiometric resolution – Radiometric resolution of image defines the ability of the sensor to distinguish different
grey-scale values [35].
4Temporal resolution – Temporal resolution of image defines the exact same area at the same viewing angle a second time is
2. Urban Sprawl (US) — The term Urban Sprawl describes the growth of urban population
away from central city area into low-density sub-urban. It also refers to the movement of a human population from highly dense and occupied metropolises and towns to low dense housing development over further and further rural land [33]. This state triggers distribution of a city and its suburbs over the nearest and surrounding rural and undeveloped land. This process is also called sub-urbanization and relates to the environmental and social significances associated with this expansion [33]. In the European continent, the term “peri-urbanization” is frequently used to explain similar dynamics and occurrences. Urban areas and their suburbs are now reaching overcrowding associated with increasing human population, which makes it urgent to research the causes and the consequences on the environment. Some of the foremost environmental glitches related to sprawl are the loss of productive land, deforestation, habitat loss, and reduction in ecosystem services [33].
The available 7Landsat satellite imagery from more than three decades and advanced
modeling technologies open up new opportunities to map the spatial-temporal information about urban landscape [36]. New computational methods are also developed to attain urban landscape features and its characteristics from RS data such as urban growth, US, informal settlements, Urban Heat Island (UHI)4, surface permeability and other urban geographic
features [36].
3. Geographic Information System (GIS) — A geographic information system is a
computer-based system designed to digitally capture, collect, store, process, analyze, retrieve and manage large datasets that have location information on the earth surface elements [32]. The key word to this computer-system is Geography i.e., some part of the data used in this system is spatial. These advantages allow to map the spatial location and characteristics of real earth features and visualize the spatial connections among them, including political, topographic, physical, climatic, resource and network elements. And another part of GIS data is generally tabular known as attribute data that provides supplementary information about each of the earth spatial features [32]. These two combinations of data types enable to map the world features exact location, mapping quantities, mapping densities e.g. population densities, finding what is nearby, short route distance, mapping change (past, present and future condition of an area) [32].
5Spaceborne satellite – The satellite which are operating or travelling in space to obtain images of the earth's surface and
atmosphere are called space borne satellite [37].
6Airborne platforms – Airborne platforms, downward or sideward looking sensors are mounted on an aircraft to obtain
images of the earth's surface [38].
7Landsat
–
The Landsat program is the longest-running enterprise for acquisition of satellite imagery of Earth. There areWhile existing research and models are focused on the targeted urban landscape changes in the developed part of the world, developing nations under severe landscape changes in urban regions associated with US, UHI, and vegetation degradation are still lacking due to economic constraints, comprising of large areas and scarce availability of spatial data on urban landscape degradation [33,39,40]. The dangers to whole ecosystems are still unidentified [31,41,42]. Thus, the implementation of urban management frameworks in rapid urban growth countries naturally depends on the large-scale evaluation of human and environmental stress of landscapes by filling data gaps. A novel method in monitoring urban landscape changes accounting for data scarcity is thus required that can also find new methods or platforms to handle large scale data and use them to analyze urban landscape changes and prediction of urban landscape degradation.
4. Urban Heat Island (UHI) — An Urban Heat Island is an urban area or town that is
significantly warmer than its adjacent rural land due to anthropogenic activities. The main reason for the UHI consequence is from the changes in land surfaces for various human purposes [43]. The heat energy is produced from all the places that have heaps of human activity and lots of people. There are many reasons were identified for UHIs, e.g. when homes, factories, industries, shops, and other buildings are constructed close together [43]. The fabrication materials used for building construction are typically good at shielding or holding in heat [43]. These materials make the areas around settlements warmer, and these changes in heat waves decrease air quality by swelling the production of pollutants such as ozone, and reduces water quality as warmer waters run into watercourses and stimulate pressure on their local species that have adapted to sustain only in the cooler aquatic ecosystem [43].
1.3 Geological Changes Induced by Mining
Urbanization and Industrialization, together with demographic development, are driving mining activities. Mining products play a vital role in the global economy and are a considerable source of the prospering economy of the country by providing the raw materials including metals and coal for a wide spectrum of industrial and domestic purposes [44]. However, mining is essential to the development of industry and prompting energetic economy, also responsible for variety of environmental impacts such as landscape damage, vegetation degradation, land desertification, soil erosion, surface subsidence, surface and
groundwater pollution, futile water-body existence, sinkholes formation, and ecosystem
degradation [45–47]. These landscape changes may directly or indirectly cause vegetation failure in the mining area. This can lead to unhealthy vegetation extensively discharging carbon to the atmosphere, which deteriorates the overall carbon sink effect of the vegetation, including coastal and inland forest [48].
Regular studies and examining of geological changes in mining areas including subsidence is always needed to prevent related disasters and to support sustainable development [49]. Several studies on mining activities only focus on the consequences resulting from the removal of minerals from the ground, which means they only observed the transformation and ground movement present and post mining activity [49,50].
The extraction process and machines used to access the galleries produce irreversible variations of cohesion and compressing of the substrate above and kilometers around the mining surface even during and after the reclamation process [51,52]. These surface modifications result in changes in groundwater table dynamics, slow sinking of a ground surface and unexpected collapse of the ground [53]. The changes in ground water reach surfaces and form new waterbodies, these wetland changes directly affect the vegetation health, hydrological conditions, and ecological situation [54]. So, an extensive range of mining studies associated with landscape changes is always needed. The several subsidence surveying techniques such as electronic surveying and ground leveling is limited on high risk and vast area [49]. These types of field surveys are time consuming, expensive and labor-intensive.
It is significant to evaluate the health of vegetation and monitor the improvement of rehabilitation until the underground mines are refilled and reclaimed [55,56]. In addition to conventional field and laboratory measurements, which include sampling sites for analysis of soil surface condition, wetland changes, landscape integrity, vegetation health; RS and GIS have been widely used to understand and analyze the landcover changes relevant to hydrological dynamics and vegetation health and cover [57–59]. Particularly, these studies are useful for detecting transformation of forestland (deforestation), vegetation cover changes in
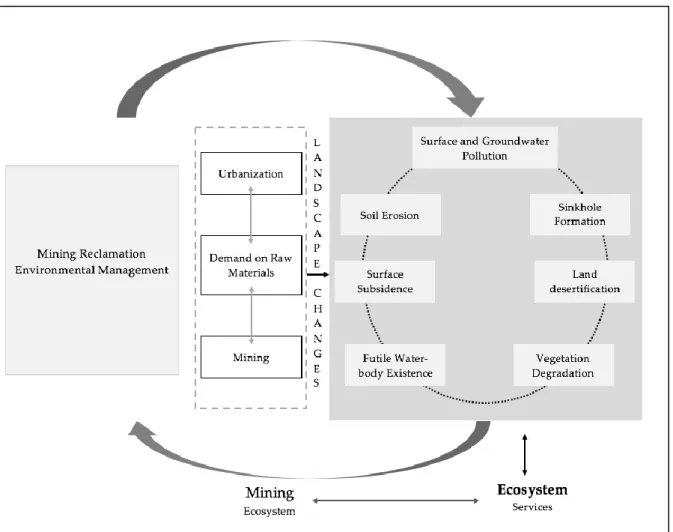
agriculture and farmland using several parameters. Similar to that, there are urban studies on nature and changes of hydrological dynamics and variations in flood dynamics derived from the landuse and landcover, maps of urbanization and watersheds models [60]. RS technology has intensive attention on monitoring the planted species and wetland during and after reclamation of mining areas [49]. Classifying and monitoring the condition of vegetation health on land surfaces in remote-sensing images is achieved by tonal signatures of vegetation on multispectral images [61]. Thus, time series analysis on mining landscape changes has been considerably recognized as data needed in order to comprehend the interaction amongst geological changes and environmental systems (Figure 1.2).
Figure 1.2. Interaction amongst geological changes and environmental systems in mining
landscape
Comparatively, very few studies have systematically examined the implementation of RS and GIS to map and analyze the extent of post-mining surface through the different periods
[46,51,62]. The most successful studies on mining surface changes were obtained from LASER, SAR interferometry and LIDAR mapping [62–64]. But regional assessment of mining landscape degradation is inaccessible and dangers to whole ecosystems are still unidentified. Thus, the implementation of novel methods in monitoring mining landscape changes accounting for LIDAR, SAR and LASER data scarcity is thus required that can also find new methods to handle large scale data and use them to analyze geological changes in areas influenced by mining.
1.4 Forest Landscape Degradation
Forest degradation is a complex process in which the biological and natural prosperity of forests is permanently or temporarily weakened by some factor including climate and anthropogenic activities [65]. It has been estimated that globally some 2-billion-hectare area of forests are degraded with about half occurring in tropical countries [66]. While some 350 million ha of former tropical forests have been converted to other land uses, the remaining forests, owing to poor logging practices, have become severely degraded and are not in a good condition to deliver timber and other ecological services anytime in the foreseeable future [65].
Indeed, planted forests now make up 7 percent of the world’s forest area and contribute over 40 percent of the global industrial wood and fiber supply [67]. To cut the forest degradation on a large scale, mangrove forests are the highly valued solutions for threatening climate changes [68]. They have valued at least 1,6 billion dollars in ecosystems services and sustain communities in many regions of the world by providing food, fire wood, shelter and sustainable tourism opportunities to local people [65]. Mangrove forests act as natural protection in case of storms and decrease erosion on coastal areas [69]. The huge volume of mangrove biomass disperses the energy of incoming waves and may greatly decrease the impact of hurricanes and tsunamis in coastal areas [70]. But global mangrove forest is undergoing an extensive deterioration of ecosystem health and loss of canopy cover has indicated that the degradation may be driven by:
(i) anthropogenic activities, e.g. in situ encroachment, coastal LULC changes, US, exploitation of forest resources, water withdrawal and pollution in upstreams [71], (ii) climatic and associated geological changes, e.g. increased salinity driven by
increasing temperatures [72] and
(iii) natural disasters, e.g. tropical cyclones. Among them, tropical cyclones entail disruptive damages, whereas climatic changes and anthropogenic activities cause incremental degradation of the global mangrove forest [73].
The mangrove species in tropical environments are facing a major habitat degradation at an alarming rate, possibly even more rapidly than non-coastal tropical forests [74,75]. About 35% of the mangrove forest area has vanished during the past 20 years, and much of the leftovers is in a degraded state [76,77]. This is mainly due to climatic changes and human activities, which cause major alterations over the coastal ecosystem, mostly through deforestation, agriculture, aquaculture, and urban development [78–83]. Globally, there are many mangrove species identified at risk of extinction, which leads to a tremendous loss of several ecosystem functions, especially in Asia where over-exploitation of mangrove is reported [84,85].
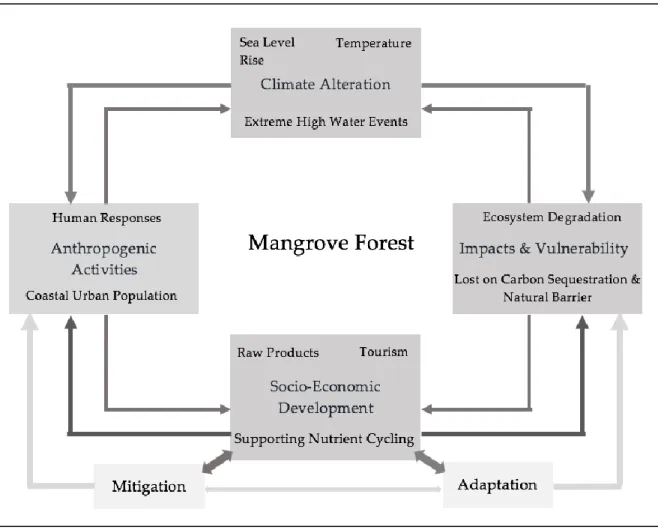
The monitoring of the distribution and changes in mangrove populations at global and regional scales has been carried out with Remote Sensing (RS) methods [86–90] using different types of data, varying from airborne data to space borne images. These studies enabled the investigation of the human interference on mangroves through the analysis of landuse landcover changes (LULCC), at regional and global scales [91]. Additionally, research has been employed to identify several drivers on a regional level, which is geographically limited to small case studies [92–98]. However, such LULCC studies do not allow to detect the drivers of mangrove degradation at the global scale [99]. Identifying the global drivers of mangrove habitat loss is still challenging [100]. Thus, time series analysis on coastal landscape changes has been considerably recognized as data needed in order to comprehend the interaction amongst forest changes and environmental systems (Figure 1.3).
Figure 1.3. Interaction amongst forest changes and environmental systems in coastal
landscape
1.5 Motivation
The pace, magnitude and spatial spread of human modifications of the Earth’s land surface and its features are unprecedented. The modification of wetlands and vegetation are among the most important [101]. The key aspect of Earth system functioning and Ecosystem Services (ES)5 are directly influenced by the alteration of biophysical attributes of the earth’s surface
(Landcover) and human purpose (Landuse) [102]. This influences the worldwide bio-diversity, local and regional climate and ecosystem transformation, as well as to global climate warming [41]. The fluctuations in climate drives degradation of wetlands, inland and coastal vegetation and sea-level rise [103].
5. Ecosystem Services (ES) — Humans and other living beings have benefitted from the
nature and environment in different ways for several millennia. But the modern science theory developed in the 1970s as ‘Environmental services’ was only further researched and renamed ‘Ecosystem Services’ in the mid-1980s [104]. Ecosystem services (ES) are benefits that living being generously gain from the biological nature and its environment without disturbing properly functioning ecology [104]. These ecosystems incorporate forest, aquatic, grassland and agroecosystems. The ecosystem provides valuable provisioning (e.g. aquaculture, food, fisheries, fuel, clean water, medicine, and textiles), regulation (e.g. shoreline protection, erosion control, and climate regulation), supporting (nutrient cycling, oxygen production, and nursery habitat), and cultural (recreation and tourism) ecosystem services with an important impact on human well-being [104]. Nowadays the policy makers and environmental scientist focused on assessing ecosystem services to study how the loss on ES drives degradation of human health, climate, carbon sequestration, atmosphere and environment [104].
Landuse and Landcover (LULC)6 change is a locally pervasive and globally important
biological trend. In the last three centuries, worldwide nearly 5.6 million km2 of pasture,
savanna and 1.2 million km2 of timberland and forest have been converted to other land-uses
[105]. Concurrently agriculture and fertile land has swelled by 1.2 million km2 to uphold the
food security of the world population [106]. The growth of human population as a driving force of biodiversity and environmental transformation because of the natural resources necessitated to endure the demand of 7.6 billion [107]. Much relative research offer statistical and spatial evidence which supports the claim that growth in population pushes to inland and coastal forest, and productive vegetation land clearance [31,101,108]. The destruction of 90% of the productive land aims to alleviate the scarcity of urban land to accommodate city population [109].
6. Landuse and Landcover (LULC) — The term Landuse and Landcover are frequently
being used interchangeably but their real meanings are reasonably distinct. Landuse signifies how the land serves, i.e., how humans exploit the land, and of socio-economic action [102]. The most general classes in landuse are settlement and agriculture. The application of landuse include both baseline mapping and succeeding monitoring, subsequently periodic information is a prerequisite to estimate and measure the present and past amount of land utilization [102]. The year to year study understanding will aid in developing policies to balance land allocation, inconsistent uses, and urban progressive pressures. Problems driving Landuse research involve urban encroachment, removal of productive land, deforestation and pollution [102].