QUANTIFICATION OF CONDENSED TANNINS IN RED
WINES BY FOURIER TRANSFORM MID-INFRARED
SPECTROSCOPY (FTIR)
ALESSANDRO CORAZZOLA
Dissertação para obtenção do Grau de Mestre em
Vinifera EuroMaster – European Master of Sciences of Viticulture
and Oenology
Orientador: Investigador Olga Laureano
Júri:
Presidente: Jorge Ricardo da Silva, Professor UTL/ISA Vogais: - Emilio Cellotti, Professor, Universidade de Udine
- Olga Laureano, Investigador Coordenador, UTL/ISA - José Carlos Rodrigues, Investigador, IICT
ii
Acknowledgements
I acknowledge Professors Olga Laureano, Jorge M.Ricardo da Silva, José Carlos Rodrigues and all the technical staff from ISA, for their important help in this thesis.
iii
Abstract
Grape-derived condensed tannins, also known as proanthocyanidins, are critical quality components for red wines. They have been subject of numerous studies in order to find a fast and reliable methodology for their quantification. In this work it has been tested the method using Fourier transform mid-infrared (FTIR) and chemometrics to quantify the amount of condensed tannins present in 88 different red wines, with the reference method of precipitation with methylcellulose. As well it has been provided a single laboratory validation of the method of fractionation of condensed tannins by reverse phase and quantification by reaction with vanillin. The models developed for the FTIR spectroscopy were not enough robust for the estimation of total condensed tannins, with low values of coefficient of determination and low RPD values (R2 cross-validation: 0,76 and RPD cross-validation: 1,86). Validation of the fractionation method showed good performance in precision, with values of coefficient of variance for the three fractions FIII, FII and FI respectively of 5,2%; 11,4% and 11,6% and values of reproducibility of 168,1; 32,9 and 3,4 mg/L of epicatechin equivalents, but it was not possible to perform effective recovery studies.
iv
THESIS INDEX
Acknowledgements……….ii
Abstract……….iii
List of tables and figures………..vi
1. Introduction………..1
1.1 Tannins: role and importance in enology………1
1.2 Condensed tannins……….2
1.2.1 Extraction during wine production………3
1.2.2 Reactions in wine……….4
1.2.3 Potential effects on health of procyanidins………..5
1.2.4 Astringency and sensorial aspects related to condensed tannins………..6
1.3 Methodology of detection………..…………7
1.3.1 Colorimetric methods……….………….7
1.3.2 Gravimetric methods……….10
1.3.3 Chromatographic analysis………..…..11
1.3.4 Polymeric precipitation of tannins………12
1.4 Fractionation and isolation………..14
1.5 Infrared spectroscopy……….…..…16
1.5.1 FTIR spectroscopy……….18
1.5.2 Application of FTIR spectroscopy in enology………....20
1.6 Chemometrics………..….24
1.6.1 Multivariate analysis……….……….25
1.6.2 Data Pre-treatment………25
1.6.3 Principal chemometrics techniques………28
1.6.4 Explorative analysis………...…………28
1.6.5 Multivariate regression………..………29
2. Aim of the thesis………...31
3. Materials and methods………...….32
v
3.2 Chemical methods………...33
3.2.1 Quantification of total condensed tannins by methylcellulose precipitation………33
3.2.2 Fractionation of proanthocyanidins by solid phase extraction……….34
3.2.3 Quantification of FI, FII and FIII fractions by vanillin reaction………..…….36
3.2.4 Validation of analytical method……….……….36
3.3 Fourier Transform Infra-Red methodology……….………….38
3.3.1 Spectral acquisition of the samples……….…..38
3.3.2 Development of calibration models………38
4. Results and discussion………..42
4.1 Quantification of total condensed tannins by Fourier Transform Infrared Spectroscopy……….42
4.1.2 Models for prediction of total condensed tannins……….………43
4.2 Single laboratory validation of the fractionation method developed by Sun et al…..…….49
5. Conclusion………..51
6. References………..52
vi
List of tables and figures
Table 1: Applications of FTIR spectrometry in the region of MIR in the viticulture-enology…21 Table 2: Statistics of the prediction model without and with the two extreme values………..43
Table 3: Descriptive statistics of the red wine samples used for calibration and validation…45
Table 4: statistics of the model for the prediction of condensed tannins using FT-MIR and Methylcellulose precipitation assay………..47
Table 5: Concentration of the three fraction of tannins for the reproducibility (mg/L Epic.E)..49 Table 6: statistical analysis of the reproducibility test………49
Figure 1: Different types of molecular vibrations………17 Figure 2: Schematic diagram of a Michelson interferometer, configured for FTIR…...………19 Figure 3: Data processing in FTIR………..……….19
Figure 4: Effect of normalization on near-IR spectra of five synthetic gluten and starch mixtures. Original spectra and spectra after normalization………..27 Figure 5: Fractionation procedure of proanthocyanidins by solid phase extraction……….…35 Figure 6-7: Red wines spectra in FTIR (3100-900 cm-1) in overlay (6) and superimposed mode (7)………42
Figure 8: PCA of the samples dataset………...………..44
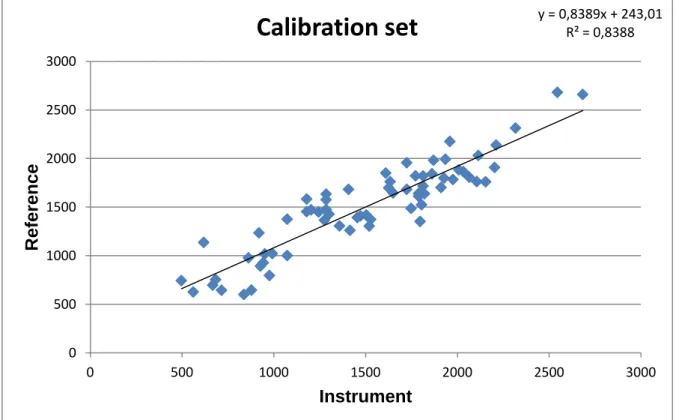
Figure 9: concentration of total condensed tannins estimated by FTIR spectroscopy instrument versus reference values from Methylcellulose method……….45
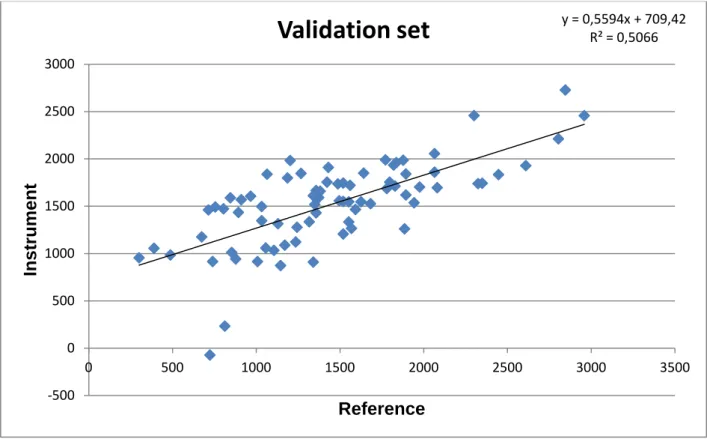
Figure 10:concentration of total condensed tannins values predicted by the calibration model on the dataset versus the values from the method of reference on the validation dataset….46
1
1. INTRODUCTION
1.1 Tannins: role and importance in enology
In the last decades the world of enology has shown a growing interest in tannins, in order to increase the comprehension of their chemistry, analysis and biosynthesis. This interest is due by the fact that tannin content and composition are critical quality components of wines (Fernandez and Agosin, 2007). In the wine literature, the term „tannin‟ is used to identify a class of compounds that are formed in the grape berry. These tannins are extracted from the berry during winemaking and may be chemically modified as part of the winemaking/wine development process.
By definition tannins are substances able to originate stable combinations with proteins and other vegetal polymers (Handbook of Enology, 2006). In chemical terms, tannins are relatively bulky phenol molecules, produced by the polymerization of elementary molecules with phenolic functions. Their configuration affects their reactivity. They play an important role in different aspects related with the wine final quality: long-term color stability, haze formation and interaction with proteins, oxidation and browning, aging behavior, sensorial aspects like astringency, bitterness and color, anti oxidant and healthy properties.
Tannins can be divided in two class of molecules: hydrolysable tannins and condensed tannins. Condensed tannins are abundant in the different parts of the grape (seeds, skins and stems) and are extracted to wine during winemaking. Hydrolysable tannins are absent in grapes, and it is generally accepted that they pass to wine from oak during aging in barrels or added as oenotannins during winemaking (Clifford and Scalbert, 2000).
2
1.2 Condensed tannins
All grape-derived tannins having enological importance are condensed tannins (Herderich and Smith, 2005). They are referred also as proanthocyanidins, this term is due from the acid catalyzed oxidation reaction that produces red anthocyanidins upon heating PAs in acidic alcohol solutions. From the structural point of view condensed tannins are polymers formed through linkages, mainly C-C bindings, between flavan-3-ol molecules. In the specific: the most common covalent linkage occurs between the C4 of the pyran ring of an upper flavonoid with C8 of the A ring of a lower flavonoid. Also can occur bonding of flavonoids between C4 and C6 sites permitting branching of procyanidin polymer. Less common is the association combining C4 and C8 bonds as well as C2 and C5 or C7. Polymerization may also occur at other sites, depending on whether bonding occurs in association with oxidation, with acetaldehyde or glyoxylic acid. (Jackson, Wine Science 2008). The most important structural flavan-3-ol subunits forming these macromolecules are (+)-catechin, (-)-epicatechin, but several other flavan-3-ol compounds participate as building units of condensed tannins like: (-)-epigallocatechin, epicatechin-3-O-gallate, (+)-gallocatechin, (+)- gallocatechin-3-O-gallate and (-)-epigallocatechin-3-O-gallate. Basic catechin units may not be considered as tannins, as their molecular weight is too low and they have very restricted properties in relation to proteins. They have only enough high weight in the dimeric form (Handbook of enology). The size of the polymer is often described by the degree of polymerization (DP), that represents the number of flavan-3-ol molecules in the polymer. So following the increasing polymerization degree, we can find dimeric, trimeric, oligomeric and polymeric procyanidins. Frequently, fractionation steps produce fractions that contain polymers of several different lengths. In this case, the average or mean degree of polymerization (mDP) is used.
Condensed tannins are present in all the solid part of the grapes: skins, seeds and stems, but with structural differences among these parts. In some cases they have been detected also in the pulp, mainly in “teinturier” varieties. There is also a considerable variation in the types and concentration among cultivars (Kovac et al., 1990), and is well established that there is a variation due to the vintage, cultural practice and environment around the developing fruit (Kennedy J.A. 2008).
Grape tannins are synthesized during berry formation and are the results of the secondary metabolism of the vine plant. This reaction is essentially completed by veraison prior to the commencement of anthocyanin biosynthesis. Hence, the largest amounts of tannins per berry can be extracted at veraison, followed by a reduction in extractable tannin as grape
3 maturity progresses (Kennedy et al. 2000, Downey et al. 2004).This period is called “tannin maturation” in which there is an apparent decline in condensed tannin concentration. While this is in part due the increasing volume of the berry, with consequent dilution of tannins synthesized pre-véraison, there is also a marked decline in the total amount of tannin that can be extracted chemically from skins and seeds (Scollary, 2010).
The biosynthesis of the phenolic compounds that are important to wine quality share a common pathway. They are, in one way or another, formed via the shikimic acid pathway, also known as the phenylpropanoid pathway, but proanthocyanidin production in plants is still incompletely understood. While the genes and enzymes responsible for the biosynthesis of the monomeric subunits catechin and epicatechin have been identified (Tanner et al. 2003), details of the polymerization reactions that yield condensed tannins remain unknown. Clearly, the unresolved biosynthesis of tannins resembles one of the last frontiers in plant secondary metabolism (Herderich and Smith, 2005).
1.2.1 Extraction during wine production
Once grapes are harvested phenolic composition in the wine becomes dependent upon processing in the winery. So the condensed tannins composition in the wine depends not only on the grape composition, but also on their extraction and consequent reactions after wine-making and ageing process. Condensed tannins present in the skin and seeds make up the majority part, with stem derived making a minor component if included. Generally speaking there are different factors that affect maceration and so the extraction: time, temperature, sulphur dioxide, ethanol, enzymes, cup punching programs, solid/liquid proportion. In this way the wine composition is influenced by the duration of pre- and post-fermentation maceration phases and by treatments enhancing cell wall or berry degradation (Wine chemistry, 2009).
White wines content of these compounds are quiet low, but an increase can be obtained by procedures like skin contact maceration, sulphur dioxide addition and clarification degree. For red varieties the attention is focused not only to the total rate of extraction but also to the seed or skin origin of the condensed tannins. In the final wine, the skin and seed tannin proportions are generally different than those found in the berry, considering the different composition of the two types of tannins modifying the proportion of them in the wine means also modifying the final quality of the wine. Skin tannins are generally extracted early in fermentation and as the maceration time increases, the rate at which seed tannin are extracted increases (Peyrot des Gachons and Kennedy, 2003). Tannin extraction will
4 increase throughout fermentation (Ribéreau-Gayon et al., 1970) and therefore, at some point seed tannin dominates the tannins present in the wine.
1.2.2 Reactions in wine
Reactions in condensed tannins composition start as soon as the beginning of wine making and continue in fermentation and ageing process. These changes involve both enzymatic and chemical reactions. The first processes, due to grape, yeast or fungi and exogenous enzymes occur mostly in the early stages, while chemical reactions continue during ageing. (Wine science, 2008).
The procyanidin molecules from the grapes tend to polymerize, condense with anthocyanins and combine with plant polymers such as proteins and polysaccharides (Handbook of Enology, 2006).
The structure of procyanidin presents in an acid environment a great reactivity caused by the acid hydrolysis of a C-C bindings with the formation of a procyanidin with a low molecular weight and a carbocation with electrophilic character. This molecule presents a huge reactivity and can bind different nucleophilic compounds, like another procyanidin, and increase in this way its degree of polymerization.
Another characteristic of the procyanidins is the oxidizability. Light and temperature, as well as the presence of hydroperoxides and certain metals, promote the formation
of oxygenated radicals (Waters, 1964). Condensed tannins react more-or-less easily with free radicals, according to their configuration. These reactions lead to polymers and insoluble brown pigments.
In the development of the colour during the wine aging, condensed tannins reactions perform an important role. The reactions of tannins with anthocyanins are responsible for the formation of pigmented polymers and so they perform an intensification and stabilization of the red wine color. These condensations can come off different mechanisms and may produce compounds with various characteristics, according to the type of bonds.
A wide range of mechanisms have been proposed to explain the formation of stable pigments. These include anthocyanin-flavanol (A-F) direct condensation reactions, flavanol-anthocyanin (F-A) direct condensation reactions, acetaldehyde mediated flavanol- anthocyanin-flavanol and anthocyanin-anthocyanin condensation reactions, pyranoanthocyanin formation and flavanol-flavanol condensation reactions. A more detailed understanding of the mechanisms of the reactions that are associated with pigment evolution is required (Scollary, 2010).
5 - Direct condensation reactions Anthocyanins-tannins, in which the anthocyanins in
cationic form react with procyanidins;
- Condensation of tannins with anthocyanins in which the carbocation formed by procyanidin reacts with the nucleophilic sites of anthocyanins molecule as carbinol basis;
- -Indirect reaction: condensation with an ethyl cross-bond. Ethanal forms a carbocation that reacts with the negative nodes of the flavanols (procyanidins, catechins), and then with the anthocyanins in carbinol base form (Handbook of Enology, 2006).
Tannins have the property to associate and interact with proteins and polysaccharides, in order to have stable combinations. Especially the interactions between tannins and proteins have been extensively studied, owing to their role in haze formation, astringency perception and nutritional and anti-nutritional effects resulting from inhibition of various enzymes and reduction of dietary protein digestion (Wine science, 2008). Polysaccharides have the capacity to affect protein-tannins interaction and the astringency response in wine (Ozawa et
al., 1987; Luck et al., 1994).
1.2.3 Potential effects on health of procyanidins
At this time, the study of the proprieties of the procyanidins presents a great interest due to the pharmacological and nutritional implications. In fact the moderate consumption of wine, especially red, is associated with positive effects on human health. Numerous studies has been done on this field but we are still far from a complete understanding on the mechanisms and molecules closely involved in the phenomenon. In particular procyanidins may be one of the polyphenolic component that ensure positive benefits. Procyanidins have been identified as high performance, low toxicity and highly bio-available. A steady stream of animal and in vitro studies supplemented by epidemiological evidence and human studies reveal numerous health benefits associated with these compounds.
Chief among the benefits is antioxidant protection against heart disease and some cancers. Oxidative stress is involved in many diseases, such as atherosclerosis, Parkinson's disease, heart failure, myocardial infarction, Alzheimer's disease and chronic fatigue syndrome. Procyanidins have been found as really powerful antioxidants, they slow or prevent the oxidation of other molecules by capturing free radicals. These properties revealed itself even more powerful than other traditional molecules able to capture radicals (Da Silva R., 1995). Oxidized low-density lipoprotein cholesterol damages the cells that line blood vessel walls by provoking numerous responses including inflammation, smooth muscle cell proliferation and
6 clotting mechanisms, all of which lead to atherosclerosis. Procyanidins develop its potential benefic effect at the level of the main factors involved in this illness: protection from the degradation of structural proteins (collagem above all), depuration of cholesterol and protection from the excessive permeability of arteries.
Other studies demonstrated that procyanidin B dimers in red wine could be used as chemo preventive agents against breast cancer by inhibiting the conversion of androgens to estrogens in breast tissues (Shiuan Chen, Ph.D.). Moreover procyanidin can induce apoptosis (self-destruction of cancer cells) and necrosis (death of cells as a result of an outside agent) of prostate cancer PC-3 cells in a mitochondrion-dependent manner (X J. Shang et al., 2008) and has been reported that procyanidin has multiple anticancer effects on different cancer cells (it is identified as being toxic to cancer cells), such as cutaneous carcinoma, oral carcinoma, breast carcinoma, bronchogenic carcinoma, liver carcinoma, prostate carcinoma, pancreatic carcinoma, gastric carcinoma, and more, along with growth promoting effects on normal cells.
Procyanidins may also protect against viruses like Herpes, venous insufficiency and protect the body from toxins.
1.2.4 Astringency and sensorial aspects related to condensed tannins
One of the most studied effects of condensed tannins is their impact on sensory perception of the wine, not only for astringency but also for the mouthfeel and other tasting notes. A considerable amount of literature can be found about this topic, here we are just going to pass through the most important steps.
First sensation linked with tannin quantity and composition is astringency. It is a tactile sensation, which is described in sensory terms as drying, roughing or puckering (Lee and Lawless, 1991).It is generally considered that we observe this as a loss of lubrification due to the tannins binding and precipitating our salivary proteins.
Although it is widely accepted that astringency results from the interaction between condensed tannins and salivary proteins, Santos-Buelga and de Freitas, (2009) note that the detailed physiochemical mechanism needs further refinement. In fact there are several matrix components (like ethanol, acidity, viscosity, simple sugars, polysaccharides, anthocyanins, etc.) in the wine medium that influences this protein-tannin mechanism; sometimes they can oppose to the reactivity of tannins decreasing their aggressiveness, sometimes increasing it.
In addition condensed tannin structure/function activity must be deeper understood especially regarding these three cardinal points:
7 - Correlation between Degree of Polymerization of condensed tannins and sensorial
perception of astringency.
- Influence of tannin modification during wine ageing on sensory perception.
- Contributions of condensed tannins from skins and seeds, and degree of maturation to the perception of astringency.
Another important sensation linked with tannin presence is bitterness. It is a taste response linked to specific receptors on the tongue. The response is generally assumed to be restricted to small molecules; that is the molecules require the appropriate size and shape to interact with the receptor site (Cheynier et al., 2006).
Tannins are supposed to be connected with other sensation like body, structure, volume, thinness and harshness but still a lot of work must be done in this way.
Regarding these points not only an analytical development is researched in order to have precise and correct method of analysis and fractionation, but also a large effort must be done in connecting these laboratory data with the real perception in the mouth of the wine taster.In fact with the ability to measure tannins and their sensorial impact comes the potential to modulate the tannin profile of red wine to a particular style or market.
1.3 Methodology of detection
There are a wide range of measurement techniques applied to the determination of condensed tannins in grape homogenates, grape skins and seeds and as well in wines. The measurement capacity ranges from the simple UV spectral measurement at a single wavelength to high cost sophisticated instrumentation such as nuclear magnetic resonance (nmr), LC-mass spectrometry (LC-MS) and LC-MS-MS (tandem mass spectrometers) (Scollary, 2010).
In summary, the methods can be broadly categorized into measurements based on colorimetric derivatisation, gravimetric analysis, chromatographic analysis and polymeric precipitation of tannins. In the next paragraphs we are going to resume the various possibilities and their specificities, following the recent reviews papers by De Beer et al. (2004), Herderich and Smith (2005), Cheyner (2006), Seddon and Downey (2008) and Scollary (2010).
1.3.1 Colorimetric methods
Colorimetric methods are abundant in the published literature. The basic mechanism is a reaction of tannins with a chemical to yield a colored complex, which is measured spectrophotometrically. This method works well with purified samples, and yields method
8 specific results, but analysis of wine is hampered by interferences with other phenolic compounds (Herderich and Smith, 2005). Indeed it is generally time consuming, use chemicals that require special handling and, most important, lack selectivity for tannins. In the end we can say that now available there are several wet chemical methods that provide more accurate and precise information than can be obtained through colorimetric methods (Scollary, 2010).
One of these classic colorimetric methods is the buthanol-HCl assay. In hot solution of butanol and hydrocloridric acid, it provides the depolimerization of the condensed tannins to yield single subunits, which are then oxidized to red coloured anthocyanidins. Then the absorbance is measured at 550nm wavelength (Porter et al. 1986). This method is selective for proanthocyanidins and does not detect hydrolysable tannins.
On the other hand it presents several drawbacks: it is influenced by variations in the water and metal content of the assay mixture, the transformation of PA into anthocyanidins is not complete (Scalbert, 1992) and side reactions are common during the transformation and lead to the formation of red-brown polymers absorbing around 450 nm (Scalbert, 1992). These factors together provoke errors of estimation, so it must be taken with caution as a quantitative assay.
Other methods, such as the Prussian Blue or the Folin-Ciocalteu assays, are based on oxidation-reduction reactions in which the polyphenol is oxidized. As above, also these reactions are non-specific, numerous polyphenols can react in addition to tannins and several interferences with wine compounds has been found. Although these two methods are widely used the results are not enough robust in order to be completely trusted.
It has been published, by Stevanato et al. in 2004, also an enzymatic method based on the peroxidase-catalysed oxidation of phenols to phenoxyl radicals, which can react with aromatic substrates to form colored adducts. The final quantification is done measuring the absorbance at 500 nm wavelength. In comparison with the widely used Folin-Ciocalteu method, this method appears to be more specific and more rapid and as a whole is not affected by the common interfering substances such as ascorbate, citrate, and sulfite (Stevanato et al., 2004).
Thus, Vanillin assay and dimethylaminocinnamaldehyde (DMACA) assay are the two colorimetric methods mostly used for quantification of total proanthocyanidins because of their sensitivity, specificity and simplicity; though several factors can affect their precision and accuracy for which precaution should be paid (Sun et al., 1998b). Mainly they rely on the formation of colored products from the reaction between tannins and the aldehyde reagent. For these two types of assay the authors showed different position, some taking one side some the other side. The DMACA employs the absorbance at 635 nm of the adducts formed
9 between the aldehyde 4-dimethylammino-cinnamaldehyde and phenols such as tannins (Treutter, 1989). Some authors think it is more specific than vanillin but still monomeric polyphenols will react causing a risk of tannin content overestimation (McMurrough and McDowell, 1978). DMACA assay has been proposed to asses oxidative ageing potential of white wines (Schneider, 1995) and for post column derivatisation during HPLC analysis (Treutter et al.,1994; de Pascual-Teresa et al., 1998).
Vanillin was used for many years as standard colorimetric method but lack in reproducibility has been often reported. The vanillin reaction involves reaction of an aromatic aldehyde, vanillin with the metasubstituted ring of flavanols to yield a red colored extract with maximum absorbance at 500 nm (Price, van Scoyoc and Butler, 1978). In order to improve it Sun et al. in 1998 studied some factors mostly affecting the vanillin assay, to ensure its precision and accuracy. Since this method has been used in this thesis we are going to speak more deeply about every factors interested.
a) Influence of acid nature and concentration
The vanillin reaction is carried out with acid medium. Considering hydrochloric acid and sulfuric acid, for the same acid normality, the A500 obtained by using H2SO4 was much higher than that obtained by using HCl. So H2SO4 showed a better sensitivity. Regarding the concentration moreover for total analysis of catechins and PA, we should use H2SO4 with a concentration of nearly 10%; in this case, (+)-catechin could be taken as reference standard, and the measured value should be approximately true concentration in sample.
b) Influence of reaction time
It is recommended to fix the reaction time at 15 min for catechin estimation. However,
for proanthocyanidin estimation, the maximum A500 should be taken as the measured value, correspondent to the maximum value of the curve of absorbance during the reaction time.
c) Influence of temperature
Because increasing temperature increased the A500 value, 25-35 °C is recommended for catechin estimation, and it should be well controlled. Instead there is no problem for PA estimation when the temperature was not significantly changed, and this estimation could be performed at room temperature.
d) Influence of water content
Because the A500 also depends on the acid concentration or, more properly said, the pH, a change of water content modifies undoubtedly the A500. So absolute methanol and reaction model free of water seems the best solution for stabilizing the color and obtain the best sensitivity.
10 e) Influence of Vanillin concentration
The vanillin, as reagent, must be excessive so that the reaction is complete. Best ranges of vanillin concentration between 10 and 12 g/L are recommended, because higher concentrations can give the formation of colored self-aggregates.
f) Effect of diffused sunlight
Analysis of variance showed that, both for (+)-catechin and for oligomeric PA, there were no significant differences at the 5% level between vanillin reaction undergone in the dark and vanillin reaction undergone in diffuse sunlight. So experiments should be performed in diffuse sunlight.
g) Interference substances
Ascorbic acid or ascorbate interfered with the vanillin assay and should be preliminarily separated from catechins and Proanthocyanidins. Also Chlorophyll from grape stem extract can interfere and should be extracted by hexane .It has been also reported that in acidic conditions, anthocyanins absorb at 490-540 nm, which coincides with the colored product (500 nm) of the vanillin assay. This interference can be simply eliminated using a suitable blank that is the same as the reaction medium, but in the absence of vanillin (Broadhurst and Jones, 1978).
1.3.2 Gravimetric methods
Gravimetric methods are based on the capacity of metals, such as the trivalent cation of the rare earth metal ytterbium (Yb3+), to complex and precipitate tannins (Reed et al., 1985). The advantage of a gravimetric procedure is that standards are not needed. But still there are some problems linked to the fact that not all polyphenols are precipitated and low
repeatability in wines with low levels of tannins. (http://www.ansci.cornell.edu/plants/toxicagents/tannin.html)
A gravimetric adaptation of precipitation with polyvinylpyrrolidone (PVP) has also been reported (Makkar et al., 1993), in which the dried mass of tannin extract before and after precipitation is used for quantification (Sarneckis et al., 2008). The method represents an improvement over the gravimetric one of Reed et al. 1985, which lack specificity for tannins This method is not very sensitive and tends to underestimate tannins. However this assay can only be applied to extractable tannins.
11
1.3.3 Chromatographic analysis
A range of methods using expensive, high maintenance equipment (best suited to use in research facilities) has been developed for analysis of condensed tannins. These are primarily HPLC (High-performance liquid chromatography) based methods, including normal phase (Rigaud et al., 1993), reversed-phase (Cozzolino et al., 2004) and size exclusion chromatography columns (Yanagida et al., 2003) coupled with mass spectrometry, diode array or electrochemical detectors.
Normal phase HPLC uses a polar column material (stationary phase) so that non-polar compounds are eluted early followed by polar compounds. There has been some success with this technique, but is requires specific workup for each application to ensure the successful separation of target analytes (condensed tannins) from other UV absorbing compounds such as anthocyanins (Scollary, 2010). Resolution by normal-phase HPLC is much poorer than that by reverse-phase HPLC and overlapping becomes more important as molecular mass increases (Sun and Spranger, 2005).
Reverse phase chromatography uses a non-polar phase and has been highly successful in separating the products obtained after depolymerization in the presence of so-called nucleophilic agents. It permits to separate low molecular weight proanthocyanidins, because oligomeric and polymeric forms are co-eluted with a large peak without resolution (Rigaud et
al., 1993).
MS (Mass Spectrometry) and nmr (Nuclear magnetic resonance) are ideal „partner tools‟ for HPLC as they provide detail of the mass and arrangement of atoms (i.e.: the structure) in the molecule, often in combination with a DAD (Diode Array Detection) detector.
Mass spectrometry is an ideal method for determining the molecular mass of a compound that allows an empirical/molecular formula to be estimated. There are a range of ionization methods used in MS, all with advantages and limitations. For a compound to be detected by MS, it must be charged as the signal that is obtained is actually the mass/charge ratio. Electrospray ionization mass spectrometry (ESI-MS) has been proved to be a very powerful tool for characterization of proanthocyanidins, in particular for detection of individual oligomeric and polymeric proanthocyanidins in a mixture or in heterogeneous solutions, providing the molecular mass, number of constitutive moieties and substituents (Guyot et al., 1997; Le Roux et al., 1998; Hayasaka et al., 2003).
Nuclear magnetic resonance (nmr) is a potentially ideal technique for assessing structural characteristics of condensed tannin extracts (Cheynier and Fulcrand, 2003). For nmr to be successful however, the molecule must be pure, both chemically and isomerically. This requirement often limits the application of the methodology. One evolving technique for
12 general compound analysis can be HPLC with an nmr detector (Wolfender et al., 2003).The use of chemometrics for the analysis of instrumental data will probably also give some nmr developments.
Considering all these techniques, the major limitation is the absence of standard reference materials. This must be rectified as a matter of urgency (Scollary, 2010).
1.3.4
Polymeric precipitation of tannins
Tannin measures that are based on selective precipitation by polymers represent an interesting and viable option for routine applications which do not require access to HPLC systems. Indeed protein precipitation functionally defines tannins, so that by definition protein precipitation is the most appropriate analytical principle (Sarneckis et al., 2006). Starting from the use of blood from a freshly pricked thumb (haemoglobin) proposed by Bate-Smith in 1973, numerous protein were tested. A gelatin index has also been proposed by Glories in 1984, whereby tannins are ranked by their propensity for precipitation of gelatin, but the variability in composition of gelatin gave problems of reproducibility. One of the most widely used for rapid condensed assay is the Adams-Harbertson assay (2003), an expansion of the protein-based precipitation method that uses bovine serum albumin (BSA), where the precipitation step was complemented with the bleaching effect of sulphite. Far from a unified judgment upon the robustness of this method, it has its supporters and detractors. In fact while Mercurio and Smith (2008) reported acceptable precision (measured as repeatability) for the Adams-Harbertson assay, Brooks et al. (2008) have published a damning report of the Adams-Harbertson method’s precision. Brooks argued that significant underestimation of the tannin content of wine would occur if it is only used the Adams-Harbertson assay for monitoring the winemaking process.
In general, all protein precipitation assays are dependent on many variables, that are potential sources of analytical variation. Nevertheless, all protein precipitation assays are hindered by our inability to measure directly the removed tannin, as the ideal absorbance for spectral quantification of tannin, at 280 nm, suffers interference from the added protein precipitant (Herderich & Smith, 2005). Instead a positive aspect of the protein precipitation assays is that the interaction of proteins with tannins can be used to model astringency perception in humans (Bate-Smith, 1973).
13 In order to obtain a direct spectral measure of tannin, and to circumvent the non-specificity of most colorimetric derivatisation methods, we turned to precipitation by non-proteinaceous polymers. Three non-proteinaceous polymer precipitants that had been previously reported were considered as candidates, namely polyvinylpyrrolidone or polyvinylpolypyrrolidone (PVP or PVPP) (Makkar, 1993; Antoine et al., 2004), polyethylene glycol (PEG) (Jones, 1965; Jones and Mangan, 1977; Makkar et al., 1995; Silanikove et al., 1996) and methyl cellulose (MCP) (Montedoro and Fantozzi, 1974) (Sarneckis et al., 2006). PVP and PVPP showed problems of selectivity and detection due to the capacity to complex with polyphenols others than tannins. PEG is exploited for tannin analysis in plant forages, showing simplicity and accuracy (N. Silanikove et al., 2001) but it has not been applied to grape or wine matrices.
MCP method which provides the precipitation using the polysaccharide methylcellulose, was developed at AWRI (Sarneckis et al., 2006) and revised by Mercurio et al. in 2007. Precipitation of tannin by a polymer with minimal absorbance at 280 nm was selected as the analytical basis for the assay. This avoided the need for indirect quantification methods, such as radioactive tracers or non-specific colorimetric assays. Considering also the non-toxic, food-grade nature of methyl cellulose, it was selected as polymeric precipitant. The methyl cellulose precipitable (MCP) tannin assay is based on a measure of 280 nm absorbance of phenolics, before and after precipitation of tannin by methyl cellulose. This tannin assay enables the complete precipitation of tannin from red wine and from the grape homogenate extracts studied. It has proved to be selective for condensed tannins and did not suffer interference from other 280 nm-absorbing phenolics such as anthocyanins or catechins. We have also to consider that the results might reflect the analytical method as much as they reveal sample composition, and it is difficult to compare tannin data that have been obtained by different methods. In fact there has not been a ‘round-robin’ comparative study of the MCP assay, as an interwinery comparative study. Sarneckis, Dambergs, Jones, Mercurio, Herderich & Smith in 2006, focused a study for the optimization and validation of this method. Since we used the MCP method in this thesis we are going to see through the main points of this study:
a) Effect of pH, ethanol concentration and ammonium sulphate on assay performance pH value (3.2-4.5 and 7.4), ethanol (10%, 25% and 50%) and ammonium sulphate concentration increase, within the above ranges do not appear to affect the performance of the methyl cellulose assay.
14 b) Effect of methyl cellulose volume, concentration and composition
The general trend observed by increasing the methyl cellulose concentration from 0.04% to 0.4% (w/v) or by increasing the volume of methyl cellulose solution was an increase in the precipitation of tannin and subsequently an increase in A280 (tannin). Nevertheless it was found that 0.04% methyl cellulose solution removed no anthocyanins while 0.4% methyl cellulose solution removed up to 5% of the more hydrophobic anthocyanins (e.g. malvidin-3- glucoside-6’-coumarate). Thus 0.04% methyl cellulose solution was chosen.
c) Effect of standing time on assay results
The most consistent result were found when the assay was left at room temperature without centrifugation and after 10 minutes in this conditions.
d) Assay validation for red wine:
There was good correlation between tannin measured by reverse-phase HPLC and the MCP tannin assay for 121 Australian red wines (coefficient of correlation r = 0.74 and coefficient of variation CV= 3.0%).
1.4 Fractionation and isolation
For the characterization of tannins, they must be primarily extracted from samples of grape or wine, before they can be isolated and fractionated by extraction in solid phase mainly by reverse phase, but also by liquid-liquid extraction (Cheynier et Fulcrand, 2003). Separation and fractionation of condensed tannins and polyphenol-derived compounds into different sub-fractions are generally a first step for their further identification and characterization. In fact to conduct further research, it is necessary to have some methods that allow separation of tannins according to their size for analytical and preparative purposes (Cedric Saucier, 2001). Fractionation of red wine polyphenols have been always a challenging task for scientists due to the structural diversity and complexity of these molecules. One of the major problems actually encountered is the difficulty to separate oligomeric proanthocyanidins from anthocyanins and polymeric proanthocyanidins from pigmented polymers (Sun et Spranger, 2005). From the literature many methods have been proposed to separate PA according to their Polymerization Degree. Most of these methods are based on the separation by gel permeation chromatography (GPC), solidphase extraction (SPE) on C18 cartridges or more recent techniques such as countercurrent chromatography. Concerning the analytical aspect, convenient separation can be achieved by normalphase TLC or HPLC. For semi -preparative, preparative or qualitative purposes, gel chromatography with different gels has been used. Unfortunately, only oligomers up to five are easily separated with these methods,
15 and irreversible absorption often occurs which limits the life of these expensive gels. A number of liquid chromatographic methodologies have been described in the literature for fractionation of polyphenols using Sephadex G-25, Sephadex LH-20, Sepharose CL-4B, Fractogel (Toyopearl TSK-HW 40(s), Fractogel (Toyopearl) TSK 50(f), and inert glass microparticles (Ryszard Amarowicz, 2006). Considering the aim of this introduction we are not going through all the details and method of these several techniques, but we will underline their impact and principal drawbacks on the analysis. The main shortcomings of these techniques are that they are very delicate and time consuming, which makes difficult their use for routine analysis (Sun, 1998). Liquid-liquid extraction with ether to isolate monomeric flavanols and with ethyl acetate to isolate oligomeric proanthocyanidins still is used but the recovery is poor and ethyl acetate extracts also a small amount of anthocyanins.
Solid-phase extraction (SPE) is a rapid and easy method which permits quantitative separation of polyphenols into various classes (Jaworski and Lee, 1987; Oszmianski et al., 1988; Revilla et al., 1991; Sun et al., 1998a), with significant reduction of solvent used. It is an extraction technique based on the selective portioning of one or more components between two phases, one of which is a solid sorbent. The second phase typically is a liquid, but it may be also an emulsion, gas or supercritical fluid. Once equilibrium has been reached the two phases are separated by decanting, filtration, centrifugation or a similar process. If the desired analytes are absorbed on the solid phase, they can be selectively desorbed by washing with an appropriate solvent. If the components of interest remain in the liquid phase, they can be recovered via concentration, evaporation, chromatographic separation and recrystallization. The real benefits of SPE are gained when the sorbent is packed efficiently into a tube to form an uniform bed. By passing through this bed the solid-liquid extraction technique becomes a form of column chromatography (P.D. McDonald, 2001). This is a rapid, economical, and sensitive technique that uses several different types of cartridges and disks, with a variety of sorbents. Sample preparation and concentration can be achieved in a single step. Interfering sugars can be eluted with aqueous methanol on reversed-phase columns prior to elution of flavonoids with methanol (A. Marston et K. Hostettmann, 2006). This method was particularly analyzed by Sun in different studies. SPE on Sep-Pak C18 cartridges can used for quantitative fractionation of grape and wine proanthocyanidins according to their degree of polymerization. The wine or grape extracts could be separated on C18 Sep-Pak cartridges into three fractions by different organic solvents, namely: 3-flavonols monomeric (FI), oligomeric proanthocyanidins (FII) and polymeric proanthcyanidins (FIII). This cartridge permits the removal of sugars and others highly polar compounds like organic acids, amminoacids and proteins. The main limitation of SPE cartridge is the
16 incapacity to separate the anthocyanins polymeric proanthocyanidins from polymeric pigments (Cheynier et Fulcrand, 2003).
1.5 Infra-red spectroscopy
Infra-red spectroscopy is an analytical technique widely used for the identification and quantification of organic, and in some cases inorganic, materials.
The term spectroscopy refers to the study of the interaction between material substance and, in general terms, electromagnetic radiation. In fact electromagnetic radiation is a form of energy which propagates itself in an ondulatoric way through the space. The whole of electromagnetic radiation is called electromagnetic spectra. If the nature of the electromagnetic radiation is fundamentally always the same, different forms can be divided within the spectra according to the three correlated values of wavelength, frequency and energy; so we can find the region of visible light, X-ray, infra-red, microwaves, ultraviolet radiations, radio frequencies, gamma rays, cosmic rays.
An important aspect of spectroscopy is that a spectra of a compound (graph of the absorbed or transmitted radiation in function of the wavelength or the frequency) depends of its own structure. There are three types of absorbance spectroscopy most used: Infrared spectroscopy (IR), nuclear magnetic resonance spectroscopy (NMR) and ultraviolet-visible spectroscopy (UV-vis). Theorically these three differ only for the frequency of the radiation used. There is also another type of spectroscopy widely used that is mass spectroscopy (MS), but it is not an absorbance spectrometry.
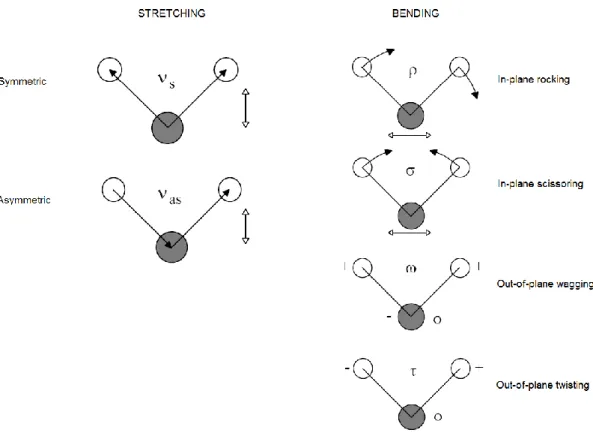
Infrared radiation spans a section of the electromagnetic spectrum having wavenumbers from roughly 13,000 to 10 cm–1, or wavelengths from 0.78 to 1000 μm. It is bound by the red end of the visible region at high frequencies and the microwave region at low frequencies. The IR region is commonly divided into three smaller areas: near IR, mid IR, and far IR. We are going to focus our attention on mid IR region, between 4000 and 400 cm–1 wavenumbers that is also the most frequently used, but also the other regions are used for analysis (Sherman Hsu,Handbook of Instrumental Techniques for Analytical Chemistry). In IR spectroscopy, an organic molecule is exposed to infrared radiation. When the radiant energy matches the energy of a specific molecular vibration and a net change in the dipole moment of the molecule happens, absorption occurs. The IR radiation is absorbed and converted from the organic molecule in vibration energy. This absorption is quantized, but
17 the vibrational spectra appear like bands rather than lines and this is due by the fact that the changement in the vibrational energy is followed by variations in the rotational state. The bands are hence roto-vibrational bands. The main categories of molecular vibrations are stretching and bending. In the stretching type there is a change in inter-atomic distance along bond axes and we can have symmetric or asymmetric type of stretch. In the bending type there is a change in angle between two bonds, here there are four types of bend: rocking, scissoring, wagging and twisting. In addition to the vibrations mentioned above, interaction between vibrations can occur (coupling) if the vibrating bonds are joined to a single, central atom.
Figure 1: Different types of molecular vibrations (A. Piazzalunga).
Although fundamental absorptions or vibrations are visualized as strong bands or peaks, an IR spectrum is complicated by the presence of three types of bands: weak overtone, combi-nation, and difference bands. Overtones result from molecules being excited from the ground state to higher-energy states and correspond to multiples of the frequency of the fundamen-tal absorption. Combination bands result from frequencies that are vibrationally coupled, and difference bands result from the difference between two interacting bands. No two molecules of different structure have exactly the same IR absorption pattern; thus, the IR spectrum of a pure sample can be described as a molecular fingerprint characteristic of a specific chemical or biochemical substance (Esbensen et al., 2008).
18
1.5.1 FTIR Spectroscopy
FTIR spectroscopy is a nondestructive technique that provides structural information on molecular features of a large range of compounds. Its main advantages are speed, high degree of automation, medium resolution, and cost-effectiveness. Recent improvements in instrumentation together with advances in fiber optics and chemometrics have provided an analytical tool that is suitable for routine qualitative analysis and process control in many industries (Esbensen et al., 2008). Its basic principle is represented by the possibility to gather at the same time all the frequencies of the IR spectra on the detector. This is possible transforming, by an interferometer, the polychromatic IR radiation released by the radiation source (each instant with the same intensity) in an interferogram, where the absorption is not anymore in function of the frequency, but of the time (passing from the dominion of frequencies to the dominion of time). So, differently from the traditional spectrophotometers, in this equipment it is used the Michelson’s interferometer which produces during a special scansion the interferogram of the examined compound. After the passage of the radiation through the sample, a mathematical operation known as Fourier transformation converts the interferogram (a time domain spectrum displaying intensity versus time within the mirror scan) to the final IR spectrum, which is the familiar frequency domain spectrum showing intensity versus frequency. This also explains how the term Fourier transform infrared spectrometry is created. In more technical view an incandescent light source emits a ray in the field of infrared; this ray arrives to a half-reflecting mirror (the beam splitter, a crystal of KBr) that divides the beam half to a fixed mirror and half to a moving mirror. The beams reflected by these two mirrors are sent back to the beam splitter that put back together the two beams and send them to the detector. These two beams made a different optical pathway that creates constructive or destructive interferences and creates a different signal proportional to the different optical pathway in the single moment. With this movement all the monochromatic radiations give a combined signal of interference (interferogram). Then the Fourier transformation gives a traditional IR spectra, transforming the signal in function of time to the signal in function of wavelength (Oliviero Rossi notes, University of Calabria).
19 Figure 2: Schematic diagram of a Michelson interferometer, configured for FTIR.
(www.en.wikipedia.org)
Figure 3: Data processing in FTIR.
(ThermoNicolet at http://mmrc.caltech.edu/FTIR/FTIRintro.pdf)
This technique in comparison with the traditional spectrometry offers some benefits, we are going to see the main of them:
1) Better speed and sensitivity. A complete spectrum can be obtained during a single scan of the moving mirror, while the detector observes all frequencies simultaneously.
20 2) The time of measurement is reduced to 1 sec or less versus 10 to 15 min of the
conventional one.
3) Increased optical throughput. Energy-wasting slits are not required so the overall energy of the radiation source is available. More power arrives to the detector in comparison to the dispersive spectrometers.
4) Internal laser reference. The use of a helium laser as the internal reference provides an automatic calibration.
5) High precision of wavenumbers. It’s possible to overlap at the signal as an internal standard the radiation of a laser source, which frequency is precisely known.
6) No heating of the sample.
7) Elimination of stray light and emission contributions. 8) Powerful data station.
9) Possibility to interface a gas chromatographic device.
1.5.2 Application of FTIR spectroscopy in enology
In the last decades FTIR spectroscopy developed really fast and was widely investigated and used in different fields of science. Several foods and beverages have been analyzed using FT-MIR and chemometrics (Briandet et al., 1996; Budinova et al., 1998; Cabezas et al., 2006). In particular the world of enology showed a great interest in this application and used this equipment to obtain qualitative and quantitative information about the different parameters that are characterizing wine and must.
The use of FTIR in enology must be based on specific analytical calibrations established through the quantification by usual of physical and chemical methods of the parameters to analyse. The FTIR technique is an indirect analytical method (Patz et al., 2000). The analytical calibrations for all the parameters are created after the quantification of those parameters in the calibration samples using routine methods and the analytical results are used as a reference for the FTIR equipment calibration.
In order to calibrate the equipment, it is necessary to measure the infra red spectrum of a group of wine samples and the parameters to calibrate should be quantified in those wines by routine methods. The selection of appropriate wave lengths for the quantification of each parameter is crucial in the development of new calibration, for which a great diversity of wines is required (Dubernet 2002; Moreira et al., 2002).
21 The number of parameters of wine and must able to be detected by FTIR spectroscopy increased year by year from the development of this technique with the possibility now to determine parameters like ethanol, organic acids, density, total and volatile acidity, reducing sugars, dry extract and many others. Taken from the thesis of Ana Paula Nascimento of 2011, we can see table 1 as a resume of the application of FTIR spectrometry in the region of MIR in the enology field.
Table 1: Applications of FTIR spectrometry in the region of MIR in the viticulture-enology (Ana Paula Nascimento, 2011).
Applications References
Characterization of polysaccharides in wine Coimbra et al., 2005; Boulet et al., 2007
Determination of ethanol in wine Gallignani et al., 2005
Determination of organic acids in wine Moreira et Santos, 2005 Estimation of procyanidins average degree of
polymerization in grapes
Passos et al., 2010
Determination of parameters of routine analyses in must and wine
Dubernet et Dubernet, 2000; Edelmann et al., 2001 ; Moreira et Santos, 2004 ; Patz et
al.,2004 ; Urtubia et al.,2004 ; Moreira et Santos
2005 ; Swanepoel et al., 2007 ; Wynne et al., 2007 ; Urtubia et al., 2008 Fu et al., 2009 ; Determination of glycosidic precursors in grapes Schneider et al., 2004
Prediction of total antioxidant capacity of red wines
Versari et al., 2010
Determination of glycerol in wines Dixit et al., 2005
Determination of total and volatile acidity in wines Pizarro et al., 2011 Determination of colored components in red
wines
Versari, Boulton and Thorngate, 2004
Quantification of total tannins and average degree of polymerization in red wines
Fernandez and Agosin, 2007
Identification of spectral regions for the quantification of tannins in red wines
Jensen et al., 2008
Determination of colloidal stability in wines Versari et al., 2011
Determination of assimilable Nitrogen in musts Dubernet et al., 2001; Skoutelas D., 2010
Considering the aim of this thesis we are going to examine more deeply just the quantification of tannins with FTIR spectroscopy. In particular we are going to analyze the different steps in the development of this spectroscopic methodology made by Fernandez and Agosin in 2007, Jensen et al. in 2008, Passos et al. in 2010 and Nascimento in 2011.
22 Wine characterization by FT-MIR spectroscopy presents two main limitations: similar IR absorption bands of most interesting compounds and dominating absorption of major wine components, particularly ethanol and water (Patz et al., 2004). Both limitations are particularly critical for the analysis of phenolic compounds, because ethanol, water and organic acids absorb in the same MIR region, masking the characteristic IR vibrations of phenolics (Moreira and Santos, 2004).
Fernandez and Agosin investigate the suitability of FT-MIR spectroscopy as an accurate method for quantifying wine tannins and evaluated the prediction of the mean degree of polymerization. They developed the model on a single red wine variety, the samples were previously purified by solid phase extraction and as references were used the methods of protein precipitation (from Harbertson et al.) and phloroglucinolysis. Then several models were developed using multivariate PLS regression and spectral interval selection procedures. The main differences presented by the spectra were found in the wavelengths regions between 2800-3700 cm-1 and 800-1800 cm-1. The prominent absorption band around 3400 cm-1 can be associated with O-H and C-H stretching vibrations. The peaks of the fingerprint zone, between 800 cm-1 and 1800 cm-1 could be attributed to C=C-C aromatic ring stretching and several aromatic C-H out of plane and in plane bending vibrations. In particular, the peak around 1285 cm-1 was assigned to the ethereal C-O stretching vibration arising from the pyran-derived ring structure of flavanoid-based tannins. As a whole, this work showed that FT-MIR spectrometry combined with multivariate data analysis allows an accurate determination of tannin concentration and mDP in wines.
Also in Jensen et al. study of direct quantification of tannins in wines by infrared spectroscopy is faced the problem of the interference between the characteristic absorption bands of major wine components and tannins. This problem has been overcome by sample purification using solid phase extraction (as previously shown in the study of Fernandez and Agosin) but it is still a not suitable strategy for rapid tannin analyses in wine industry. So Jensen study focus on an alternative way, which is to identify the characteristic spectral regions of tannins, which do not suffer from this interference, and in turn use this identification to develop calibration models that then allow the rapid quantitative assessment of tannins by FT-MIR. So a four variable selection methods for finding the best regions in the range of the IR spectra were evaluated to see if the calibration models could be improved. Although the regions identified by the four variable selection methods were not identical, two regions were selected by all four methods: the region from 1060 to 995 cm-1, which was dominated by high absorption of the OH stretch in ethanol, and the region between 1485 and 1425 cm-1, at which grape tannin gave a distinct absorption peak. The present study
23 demonstrated that the identified regions could be used to develop calibration models, which allowed the measurement of tannins in wines by FT-MIR spectroscopy.
In the work of Passos et al., regression models based on the FTIR spectral region between 1800 and 700cm−1 using Partial Least Square regression and orthogonal projection to latent structures were assayed in grape seeds freeze-dried procyanidin extracts. Identification of procyanidins molecular features related to the absorbance characteristics in the mid infrared region were established and correlated with procyanidins average degree of polymerization (DPn). For this purpose it was used a methodology of fractionation based on the difference in the solubility of procyanidins in methanol/chloroform solutions, showing the relationship of procyanidins DPn and solubility in this solution. This method allowed also to build the calibration model in order to estimate the average degree of polymerization of grape seed procyanidins. According to the regression model it is possible to identify the most important bands related to the DPn value. The observation of the positive peaks at 1203 and 1099cm−1 suggests a possibility to assess the DPn of procyanidins by monitoring the aromatic substitutions, in this case the increase of aromatic substitutions in polymerized molecules. Although this method has not been yet tested in other than grape seeds it is expected that applications can be found also in other procyanidins sources like grapes extract or wine.
The recent study of Ana Paula Nascimento has the objective to evaluate the application of FTIR spectroscopy for the quantification of total condensed tannins, as the determination of their three fractions: polymeric, oligomeric and monomeric. The calibration models were developed using two methodologies as reference: fractionation by reverse phase method and quantification by reaction with vanillin and the method of precipitation with methyl cellulose. Unfortunately the results leads to the conclusion that in this study the models are not robust enough for the estimation of concentrations of total condensed tannins and the three fractions. With this last survey it is clear that the problems came out in the previous studies are still not easy solved, especially when the spectroscopic analysis is directed directly to the raw wine. So we can understand that the important goal to find a rapid and precise analytical tool for the quantification of total tannins with FTIR spectroscopy is far from been achieved, despite the elevate number of studies in relation to this topic.
24
1.6 Chemometrics
With the introduction of modern analytical instrumentation capable of multivariate responses like FTIR spectroscopy, we can have in an easy and rapid way indirect, full-spectrum measurements of the chemical and physical properties of a sample. As a result, extremely large data sets are generated in which essential information may not be readily evident. In fact we need more complex analytical approaches than the traditional univariate methods. For this purpose, chemometrics and multivariate analysis were joined closely to the quantitative analysis in the infrared spectrometry. Now the use of chemometrics for calibration, validation and comparison of main components of wine as determined by IR is indispensable. Qualitative and quantitative IR spectroscopic methods typically require multivariate calibration algorithms to model the spectral response to chemical or physical properties of the calibration samples. Measured frequencies often have to be preprocessed through a series of mathematical procedures, including various forms of scaling and corrections to yield a suitable absorbance spectrum. Vibrational bands (peaks) are generally overlapping and may often appear nonspecific and poorly resolved (Bauer et al., 2008). In particular with the term chemometrics is considered the use of mathematical and statistical techniques for handling, interpreting, modelling and predicting a group of data. Basically is a science that uses mathematic-statistics methods in order to solve multivariate problems. The birth of this discipline is brought back up Svante Wold and Bruce Kowalski that in June 1974, in a letter sent to Analytical Chemistry journal, first suggested the term “Chemometrics” (D’Angelo et al.). Chemometrics permits a multivariate approach to the system under study: in this way it permits to take in account all the variables, allowing the best use of the information in the analysed dataset. Nowadays chemometrics regroups the methods of classification, modelling and multivariate regression, the analysis of similarity, the analysis of principal components and the different methods linked to it, the expert systems and the methods of artificial intelligence, strategies based on the neural network, methods of experimental design and optimization (www.chemiometria.it). Chemometrics pursues three principals objectives:
a) Organize an optimal sampling (representative); b) Optimization of the analytical methodologies;
25
1.6.1 Multivariate Analysis
In chemometrics a lot of emphasis is given to the multivariate analysis of the problem. In fact nowadays analytical instruments like FT-IR spectroscopy gives to the researcher a dataset, in the specific case a spectra, that must be approached as a multivariate data in order to gain the maximum of information from it. All these data values are difficult to cope and evaluate in a simple and fast way using simple univariate statistical tools, specially due to their large number and to their multivariate correlation. In order to discover relevant patterns within large multivariate data sets, the application of modern chemometrics methods based in statistical multivariate data analysis is proposed. The basic assumption of chemometrics methods is that each of the measured parameter in a particular sample is affected by contributions coming from multiple independent sources (Tauler R. et al.). As pointed out by Rasmus Bro in 2003 multivariate data analysis and multivariate calibration give several significant advantages in their application. It is claimed there, that multivariate models are more adequate than univariate models. This strong statement holds in general because it is always possible to discard variables such that a univariate approach is re-obtained and multivariate models can handle situations that cannot be handled univariately. In particular, it is possible to minimize the influence of the noise, to incorporate interferents and to have automatic outlier detection when building or using a model. In addition multivariate models and data make it possible to supplement the traditional deductive approach with an exploratory one (Rasmus Bro, 2003). If multivariate data analysis is not used we can encounter some risks like spurious correlations, lost of relevant information and not recognizable outliers in a simple comparison.
1.6.2 Data pre-treatment
In general the dataset of information is in form of matrix where each row is an object, described by many variables one for each column. The instrumental data gives an high information but correlated at the analytical data in a complex way. There is as well an elevated noise and not relevant information. In order to remove or reduce the sources of systematic or unpredictable variation which are not related with the chemical problem of interest, as well as to increase the spectral characteristics, a pre treatment of the data is necessary (A. P. Nascimento, 2011). Pretreatments are performed with very simple