On the Behavior of Solutions of Xenon in Liquid n-Alkanes: Solubility of Xenon in
n-Pentane and n-Hexane
Rui P. M. F. Bonifa´cio,† Luı´s F. G. Martins,‡ Clare McCabe,§ and Eduardo J. M. Filipe*,† Centro de Quı´mica Estrutural, Instituto Superior Te´cnico, 1049-001 Lisboa, Portugal, Centro de Quı´mica de E´Vora, UniVersidade de E´Vora, Rua Roma˜o Ramalho 59, 7000-671 E´Vora, Portugal, and Department of Chemical and Biomolecular Engineering, and Department of Chemistry, Vanderbilt UniVersity,
NashVille, Tennessee 37235-1604, United States
ReceiVed: June 21, 2010; ReVised Manuscript ReceiVed: October 8, 2010
The solubility of xenon in liquid n-pentane and n-hexane has been studied experimentally, theoretically, and by computer simulation. Measurements of the solubility are reported for xenon + n-pentane as a function of temperature from 254 to 305 K. The uncertainty in the experimental data is less than 0.15%. The thermodynamic functions of solvation such as the standard Gibbs energy, enthalpy, and entropy of solvation have been calculated from Henry’s law coefficients for xenon + n-pentane solutions and also for xenon + n-hexane, which were reported in previous work. The results provide a further example of the similarity between the xenon +
n-alkane interaction and the n-alkane + n-alkane interactions. Using the SAFT-VR approach we were able
to quantitatively predict the experimental solubility for xenon in n-pentane and semiquantitatively that of xenon in n-hexane using simple Lorentz-Berthelot combining rules to describe the unlikely interaction. Henry’s constants at infinite dilution for xenon + n-pentane and xenon + n-hexane were also calculated by Monte Carlo simulation using a united atom force field to describe the n-alkane and the Widom test particle insertion method.
1. Introduction
Mixtures involving n-alkanes and noble gases have been extensively studied and used as model systems for testing statistical theories of liquids. These chemical families provide a range of molecules whose physical properties gradually change within the homologous series or periodic group and are therefore especially suited to study the role of size, shape, and flexibility on the thermodynamic properties of liquid mixtures. The interaction between xenon and the n-alkanes, in particular, has been extensively studied. Xenon is highly soluble in lipids and fats and shows anesthetic properties at subatmospheric pressures. Given its chemical inertia, nontoxicity, and nonflammability (which make it an easy and safe gas to handle), xenon could be considered the perfect anesthetic; its use was recently submitted for regulatory medical approval in Europe.1A further important
application of xenon in nuclear medicine involves the use of
133Xe isotope to study cerebral blood flow and pulmonary
functions.2
At the molecular level, xenon is a spherical and structureless particle, with a high polarizability that enhances dispersion forces. Its intermolecular potential is therefore relatively well characterized. These properties justify its frequent use as a prototype solute in the study of solute-solvent interactions from first principles. In addition, one of xenon’s most abundant natural isotopes, 129Xe, has an NMR-active nucleus whose shielding
constant is very sensitive to the local environment. The129Xe
particle can thus be used as a “probe” to study the properties of condensed phases, biological structures, and microporous materials by NMR spectroscopy.3,4
In previous work5-7we reported low-temperature
thermody-namic studies (from 160 to 200 K) of mixtures of xenon with the lighter alkanes (methane, ethane, propane, butane, and i-butane). We found that these mixtures exhibit a behavior that closely resembles that seen for mixtures of n-alkanes. The data, as interpreted by the statistical associating fluid theory (SAFT-VR),8indicates that xenon can be represented by a sphere with
almost the same diameter and intermolecular potential, as those suited to describe the n-alkanes. The diameter of the xenon atom (measured, for instance, in terms of its van der Waals radius) agrees very well with that of the cross-sectional diameter of the n-alkanes. The following example provides further evidence of this behavior, as do the results presented in this work.
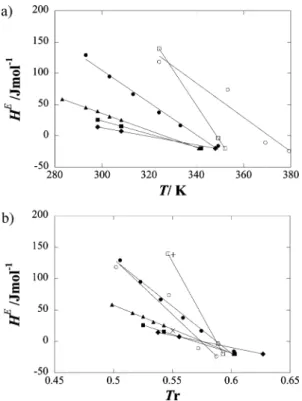
Excess enthalpies (HE) for a number of equimolar mixtures
of n-alkanes are plotted in Figure 1a as a function of temper-ature. From the figure we observe the general trend that n-alkanes mix with positive excess enthalpies at low tempera-ture, which decrease with increasing temperatempera-ture, passing through zero, and becoming negative at higher temperatures. The temperature at which HE (x ) 0.5) becomes negative
changes from system to system. Interestingly, if the same data is plotted against the reduced temperature of the mixtures, Tc12
(defined as Tc12 ) (1 - k12)(Tc1Tc2)1/2, where (1 - k12) ) (8(Vc1Vc2) 1/2)/((V c1 1/3 + V c2 1/3)3) and T c1, Tc2, Vc1, and Vc2 are,
respectively, the critical temperatures and critical volumes of the pure fluids) it can be observed that the temperature at which HE(x ) 0.5) becomes negative falls within 0.57 and 0.59 for
all systems (Figure 1b). Following our suggestions,9,10Blas and
dos Ramos11 were able to reproduce this universal behavior
using the soft-SAFT equation. The reduced temperature at which HE (x ) 0.5) becomes negative was predicted by theory as
0.51-0.52.
Also included in Figure 1b are the HE(x ) 0.5) values for
the xenon + propane and xenon + n-butane systems. Given * To whom correspondence should be addressed. E-mail: [email protected].
†Instituto Superior Te´cnico. ‡Universidade de E´ vora. §Vanderbilt University.
10.1021/jp105713m 2010 American Chemical Society Published on Web 11/10/2010
the volatility of these compounds, the experimental data for these mixtures was determined at much lower temperatures. Never-theless, the xenon + alkane data conforms to the general n-alkane + n-alkane trend.
As it will be shown, the results reported in this work provide further evidence supporting that these findings are not mere coincidences at the macroscopic level but reflect a more uni-versal behavior at the molecular level.
Solubility measurements often constitute an important source of information about the properties and structure of solutions.12
Precise measurements covering sufficiently large ranges of temperature are frequently the only means of obtaining the enthalpy and heat capacity changes associated with the dissolu-tion process. In the present work, accurate determinadissolu-tions of the solubility of xenon in n-pentane as a function of temperature have been performed in the 254-304 K range. From the experimental results, thermodynamic quantities of solvation were calculated for both xenon + n-pentane and xenon + n-hexane, which was measured in previous work.13 As before,14 the
systems were modeled using the SAFT-VR approach. Henry’s constants at infinite dilution as a function of temperature were also obtained by molecular simulation and are directly compared with experimental results.
2. Experimental Section
The n-pentane solvent was obtained from Lab-Scan, analytical reagent, with a 99% mol/mol minimum stated purity. The liquid was purified by distillation in an inert atmosphere of dry nitrogen. The final purity was confirmed by checking its vapor pressure after degasification. Deviations from literature values15
were found to be less than 0.1%. The xenon used was from
Linde Gas with 99.99% mol/mol minimum stated purity. The gas was used as received from the manufacturer.
The experimental apparatus and procedure have been previ-ously described in detail.12The solubility measurements involve
equilibration of known amounts of dry gas and degassed solvent at constant volume and determination of the equilibrium pressure for the saturated solution maintained at constant temperature. The amount of gas is determined by measuring its pressure in a calibrated glass bulb at constant temperature and correcting for gas imperfection. Pressure is measured with a transducer (Paroscientific model 0-7 bar, precision 0.01% FS). The pure solvent is degassed by successive melting/freezing cycles while vacuum pumping noncondensable gases. The amount of pure solvent is determined volumetrically. The equilibrium cell, based on the design of Carnicer,16has two capillaries through which
the liquid is forced to circulate during the equilibration process, promoting a close contact with the gas. The volume of the cell was previously determined with a precision of 0.01%. The readings of pressure during the dissolution process are recorded until a constant value is reached, indicating that equilibrium has been attained. The final pressure, temperature, and level of the solution in the capillaries are then measured. Equilibrium is typically attained within 72 h.
Temperature is maintained constant in a water thermostat to within 0.01 K by means of a Hart Scientific PID temperature controller and is measured with a previously calibrated Pt100 platinum resistance thermometer. The measurement of solubility at different temperatures is done by simply changing the thermostat set point and waiting for a new thermodynamic equilibrium. With a single loading it is thus possible to make measurements over a large temperature range. Several runs, in which the temperature was both increased and decreased, were performed in order to check the reproducibility of the results. 3. Experimental Results
The solubility of xenon in n-pentane was experimentally measured from 254.19 to 304.48 K. The results are reported in Table 1. For each experimental point, the temperature, equi-librium pressure, molar fractions of xenon in the liquid and gaseous phases in equilibrium, and Henry’s law coefficients, H2,1(T,p1sat), are indicated.
Henry’s law coefficients were calculated from experimental data as follows. Henry’s law coefficients are usually defined as17
Figure 1. Excess enthalpies, HE(x ) 0.5), for equimolar mixtures of
n-alkanes and xenon + n-alkanes as a function of (a) temperature and
(b) reduced temperature. Lines are trend lines, and symbols are experimental data from the literature: ([) n-hexane + n-decane, (9)
n-hexane + n-undecane, (2) n-hexane + n-dodecane, (b) n-hexane + hexadecane, (0) hexane + tetracosane, (O) octane +
n-octacosane, (+) xenon + propane, (×) xenon + n-butane.
TABLE 1: Values for the Henry’s Law Coefficients, Equilibrium Pressure, p, and Xenon Molar Fraction in Gaseous and Liquid Phases between 254 and 305 K for Xenon + n-Pentane solutions
T/K p/kPa x2(10-2) y2 H2,1(p1sat, T)/MPa
254.19 66.90 3.0384 0.8620 1.886 255.77 68.80 2.9841 0.8538 1.956 258.35 71.83 2.9118 0.8395 2.058 267.30 83.75 2.6726 0.7842 2.443 269.36 86.96 2.6115 0.7706 2.551 277.69 101.2 2.4040 0.7114 2.978 279.96 105.5 2.3515 0.6944 3.101 286.22 118.9 2.2053 0.6470 3.475 295.17 141.8 2.0219 0.5777 4.040 304.48 171.4 1.8413 0.5074 4.718 H2,1(T, p) ) lim x2f 0
[
f2(p, T, x2) x2]
(1)where f2is the fugacity of the solute (component 2) and x2its
molar fraction in the liquid solution. The fugacity of component 2 can then be determined in the usual way18
with
where φ2is the fugacity coefficient of component 2, p is the
vapor pressure of the saturated solution, and y2 is the solute mole fraction in the vapor phase. B22 is the second virial
coefficient of the solute, and δ12is given by 2B12- B11- B22,
where B11is the second virial coefficient of the solvent and B12
is the solute-solvent crossed second virial coefficient. The equilibrium compositions were calculated iteratively from experimentally measured quantities allowing for imperfection of the gaseous mixture. The process starts with initial guesses for the molar fractions in both phases and continues with the determination of the quantities of solute and solvent present in the two phases. The process converges rapidly, and coherent values for yi and xi are obtained after a few iterations. The calculation of Henry’s law coefficients is then immediate using eqs 1-3. For comparison purposes, it is useful to express Henry’s coefficients at the same pressure, namely, the vapor pressure of the pure solvent. The pressure dependence for H2,1
can be expressed as19
where V2∞is the partial molar volume of the solute at infinite
dilution and p1satis the vapor pressure of the pure solvent.
The vapor pressure of n-pentane was taken from ref 20 and the molar volume calculated using the equation reported by Cibulka.21The second virial coefficients for pure n-pentane were
taken from Dymond et al.22 and for pure xenon from the
compilation of Dymond and Smith.23The crossed virial
coef-ficient for the mixture was estimated using the Tsonopoulos correlation.24As a first approximation, the partial molar volumes
of xenon in n-pentane, necessary for calculation of the Henry’s law coefficients (eq 4), were estimated using the method described by Tiepel and Gubbins.25,26This method has been
applied to calculate the partial molar volume of several gases in water and proved to be accurate to within 3%. This uncertainty affects negligibly the values of the Henry’s law constant.
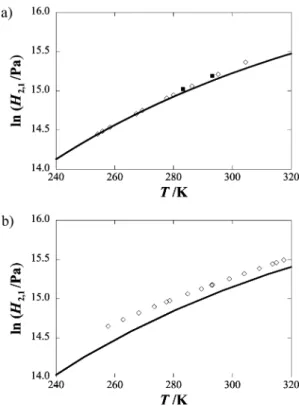
Henry’s law coefficients, H2,1(T, p1sat), are plotted as a function
of temperature in Figure 2. The solubility of xenon in n-pentane has been previously measured by Pollack and Himm27at 283.15
and 293.15 K and are also included in Figure 2. The values reported herein differ from these results, 1.7% and 0.5% respectively.
The dependence of the Henry’s law coefficient in relatively narrow temperature ranges can be represented by the equation proposed by Clarke and Glew28
The experimental results were fitted to eq 5, and the coefficients Ai are listed in Table 2. The relative deviations of the experimental results from the smoothing correlation do not exceed (0.25%, and the average absolute deviation (AAD) is 0.13%. The same procedure was applied to the solubility results of xenon in n-hexane from a previous work,12and the obtained
coefficients are also included in Table 2.
The change in molar Gibbs energy when the solute is transferred, at temperature T, from the pure perfect gas state at standard pressure to the dilute state in the solvent (standard Gibbs energy of solvation)29is given by18
where p° is the standard state pressure, considered as 101.325 kPa. The standard enthalpy and entropy of solvation can be obtained by calculating the corresponding partial derivatives of the Gibbs energy with respect to temperature at constant pressure. The result for the enthalpy of solvation at temperature T and at the vapor pressure of pure solvent is
f2(p, T, x2) ) φ2(p, T)y2p (2) φ2(p, T) ) exp
[
p(B22+ y1 2 δ12) RT]
(3) H2,1(T, p) ) H2,1(T, p1sat)exp∫
p 1 sat p[
V2 ∞ (p, T) RT dp]
(4)Figure 2. Henry’s law coefficients for (a) xenon + n-pentane and (b)
xenon + n-hexane. For xenon + n-pentane: (]) this work; (s) SAFT-VR results; (9) Pollack and Himm.27 For xenon + n-hexane, the
experimental results are from ref 13.
[ln H2,1(T, p1 sat )] ) A0+ A1 10-2T/K + A2ln(10 -2 T/K) + A3(10-2T/K) + A4(10-2T/K)2 + ... (5) ∆G2 o (T, p1 sat ) ) RT ln
(
H2,1(T, p1 sat ) po)
(6) ∆H2o(T, p1 sat ) ) -RT2[
d dT(
ln H2,1(T, p1sat) po)
-V2∞(T) RT(
dp1 sat (T) dT)
]
(7)while the standard entropy of solvation is given by
The thermodynamic functions of solvation were calculated from the Clarke and Glew smoothing equation for both xenon + n-pentane and xenon + n-hexane solutions. The results are listed in Table 3. No values obtained directly by calorimetric determinations could be found for comparison.
4. Theory
A quantitative interpretation of the results was performed using the statistical associating fluid theory for potentials of variable attractive range, SAFT-VR.8The SAFT-VR equation
has been extensively tested against simulation data30for model
fluids and successfully used to describe the phase equilibria of a wide range of industrially important experimental systems; for example, alkanes of low molecular weight through to simple polymers31 and their binary mixtures,32-34perfluoroalkanes,35
alcohols,36 water,37 and carbon dioxide,38-41 have all been
studied. The main expressions of the SAFT-VR equation of state for the square-well potential have been presented, and the reader is directed to the original reference for full details.8In the
SAFT-VR approach, molecules are described as chains of m tangen-tially bonded hard spherical segments with the attractive interactions described by a potential of variable attractive range, such as the square-well potential used in this work. Each segment is characterized by three parameters, namely, the hard-sphere diameter σ and the depth ε and width λ of the potential well. For the n-alkanes, a simple empirical relationship between the number of carbon atoms n in the alkyl chain and the number of spherical segments m in the model chain has been proposed in earlier work:42,43m ) 0.33(C - 1) + 1. Values of m ) 2.33
and 2.67 are therefore used for n-pentane and n-hexane, respectively. A single sphere is naturally used to model the xenon atom. The remaining pure-substance parameters ε, σ, and λ are determined by fitting the theoretical expressions to the experimental vapor pressure and saturated liquid density data; the optimized parameters for xenon, n-pentane, and n-hexane6,13were determined in previous work and are
presented in Table 4.
The study of phase equilibria in mixtures additionally requires determination of a number of unlike parameters. The unlike size parameter was calculated using the Lorentz combining rule
and the unlike energy parameter from the Berthelot combining rule
where deviations from the geometric mean can be allowed through the binary interaction parameter ξ. For both xenon + n-pentane and xenon + n-hexane systems we used ξ ) 1, since with this approximation we were able to quantitatively describe a number of xenon + n-alkane systems.5-7,13The unlike range
parameter was determined from the arithmetic mean
In this way, the SAFT-VR approach becomes completely predictive in the sense that no parameters are fitted to
experi-TABLE 2: Coefficients for Eq 5 Correlating the Experimental Data for Xenon + n-Pentane and Xenon + n-Hexane Solutions
coefficients xenon + n-pentane xenon + n-hexane
A0 +76.293 +74.287
A1 -90.504 -86.314
A2 -61.431 -54.874
A3 +12.224 +10.012
AAD +0.13% 0.5%
TABLE 3: Thermodynamic Functions of Solvation for Xenon in n-Pentane and n-Hexanea
T/K ∆G2°/kJ mol-1 ∆H2°/kJ mol-1 ∆S2°/J K-1mol-1
xenon + n-pentane 254.19 6.183 -11.084 -67.9 255.77 6.290 -11.096 -67.9 258.35 6.466 -11.125 -68.1 267.30 7.079 -11.332 -68.8 269.36 7.221 -11.402 -69.1 277.69 7.803 -11.774 -70.5 279.96 7.964 -11.900 -70.9 286.22 8.413 -12.300 -72.3 295.17 9.072 -13.009 -74.8 304.48 9.784 -13.916 -77.8 xenon + n-hexane 257.70 6.691 -9.470 -62.7 262.81 7.010 -9.352 -62.2 268.16 7.342 -9.275 -61.9 273.42 7.668 -9.246 -61.8 277.59 7.926 -9.255 -61.9 278.68 7.993 -9.262 -61.9 284.77 8.371 -9.338 -62.1 289.47 8.665 -9.439 -62.5 292.97 8.884 -9.538 -62.8 293.24 8.901 -9.546 -62.9 298.98 9.264 -9.754 -63.6 304.04 9.588 -9.983 -64.3 309.16 9.921 -10.25 -65.2 313.68 10.21 -10.53 -66.1 314.94 10.30 -10.61 -66.4 317.48 10.47 -10.79 -66.9 323.65 10.88 -11.26 -68.4 324.20 10.92 -11.31 -68.6 332.67 11.51 -12.06 -70.9 a
∆G2° is the molar Gibbs energy of solvation, ∆H2° the molar
enthalpy of solvation, and ∆S2° the molar entropy of solvation. The
values are based on the ideal gas state at 101.325 kPa.
∆S2o(T, p1sat) ) -R ln H2,1(T, p1 sat ) po -RTd dT
(
ln H2,1(T, p1 sat ) po)
- V2 ∞(
dp1 sat (T) dT)
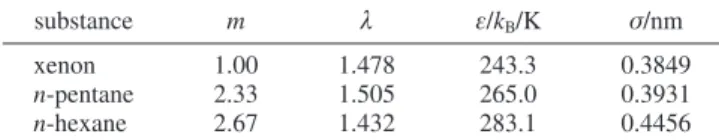
(8)TABLE 4: Optimized Square-Well Intermolecular Potential Parameters for n-Pentane, n-Hexane, and Xenona
substance m λ ε/kB/K σ/nm
xenon 1.00 1.478 243.3 0.3849
n-pentane 2.33 1.505 265.0 0.3931
n-hexane 2.67 1.432 283.1 0.4456
am is the number of spherical segments in the model chain, λ the range, ε/k the depth of the potential well, and σ the diameter of each segment. σ12) (σ11+ σ22)/2 (9) εij) ξ(εiiεjj) 1/2 (10) λ12) σ11λ11+ σ22λ22 σ11+ σ22 (11)
mental results for the mixtures being studied and are performed using solely pure-component parameters.
5. Computer Simulation
Henry’s constants for xenon in n-pentane and n-hexane as a function of temperature were also obtained by computer simulation using Widom’s test-particle insertion algorithm. The method uses Monte Carlo simulations to compute excess chemical potential (µ2exc,∞) of the solute 2 in the solvent 1 at infinite dilution, which in turn allows the calculation of Henry’s constant by the well-known relation
where µ2exc∞ is the excess chemical potential (the difference between the chemical potential of solute 2 in solvent 1 at infinite dilution and the chemical potential of pure species 2 at the ideal gas state), T is temperature, and F1is the density of pure solvent.
The excess chemical potential at infinite dilution is evaluated by
where uTPis the interaction energy of the test particle with a
configuration of solvent molecules, V is the volume of solvent in a given configuration, and {NpT denotes an isothermal-isobaric ensemble average.
The computer simulations were performed using the MCCCS Towhee Monte Carlo molecular simulation package, version 6.2.2.44The force field used to describe both n-alkanes was based
on TraPPE-UA,45 whose main characteristics are fixed bond
lengths, harmonic style angle bending terms, quadratic torsion terms for the intramolecular interactions, and the intermolecular terms are modeled by Lennard-Jones potentials centered on the carbon atoms. This is a united atom force field, which means that CHngroups are modeled as single pseudoatoms; however, the nonbonded parameters used were not those proposed by Martin et al.41Although TraPPE-UA produces good
results for the excess thermodynamic functions of mixtures involving light n-alkanes (ethane, propane, and n-butane) and xenon,46vapor pressures of these n-alkanes as pure compounds
were not well predicted, particularly at low temperatures. Recently, Laginhas et al.47carried out an optimization of the
nonbonded parameters of CH3and CH2within the TraPPE-UA
framework in order to obtain agreement between experimental and simulation results of vapor pressures and densities for the lightest n-alkanes (except methane) at low temperatures. More specifically, the procedure used by Laginhas was as follows: a trial and error optimization of nonbonded CH3parameters was
done in order to match experimental and simulation results of vapor pressure and density for ethane. Using this pair of parameters, the CH2ones were determined by matching the same
results for propane. Then, ε and σ for CH3and CH2, optimized
in this way, were used to predict vapor pressures and densities for n-butane at low temperatures, giving a reasonable agreement between simulation and experimental results. Furthermore, using the optimized pairs of potential parameters, the authors were able to predict liquid-vapor equilibrium diagrams for xenon + ethane, xenon + propane, and xenon + n-butane binary mixtures. Xenon parameters have also been optimized by the
same trial and error procedure, using the Lennard-Jones-type potential from Bohn et al.48as the starting point. However, in
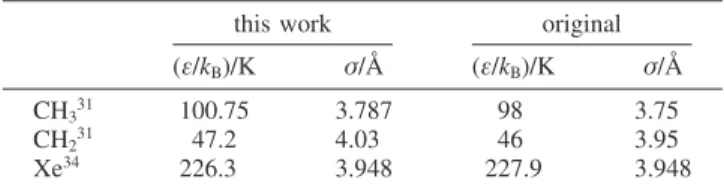
the case of the three n-alkanes studied, no unique pair of parameters for each interaction site was obtained for the entire temperature range tested. Two sets of parameters have been proposed: one for the low-temperature (up to 210 K) limit and the other for the high-temperature limit. In this work we use the high-temperature set of parameters for the n-alkanes and the unique set for xenon both obtained by Laginhas et al. The parameters used in this work are shown in Table 5, where they are also compared with the original ones. The unlike parameters were obtained using the Lorentz-Berthelot combi-nation rule, which means that no experimental results were needed to predict Henry’s constants.
The calculations were carried out in the NpT ensemble with a single box having side lengths of approximately 35-40 Å and containing 300 solvent molecules. A 12 Å cutoff radius was used in the interaction calculations, and the neglect of long-range interactions beyond the cutoff radius was compensated by application of analytic tail corrections. Coulombic interac-tions were not considered, since all the molecules studied are neutral and apolar. In each simulation, a preliminary solvent equilibration run of 50 000 MC cycles (each cycle consisting of a number of moves equal to the number of molecules in the system) was done, followed by a production run consisting of another 200 000 MC cycle, which were divided into 20 blocks in order to calculate standard deviations. One thousand insertions of solute test particle were done for each MC production cycle (a total of 2× 10⁸insertions per run). The Monte Carlo moves
consisted of simulation box volume changes, coupled-decoupled configurational-bias regrowths, translations of the center of mass, rotations about the center of mass, and configurational-bias molecule reinsertions in the simulation box. Henry’s constant calculations were done as a function of temperature from 250 to 305 K for xenon + n-pentane and 335 K for xenon + n-hexane at 5 K intervals. The system pressure was fixed to a value of 100 kPa. Henry’s constants obtained by computer simulation were corrected to the solvent vapor pressure so that they can be compared with experimental results. The correction was done by the same procedure used to correct the experimental Henry’s constants.
6. Discussion
The results of the SAFT-VR calculations for the xenon + n-pentane and xenon + n-hexane systems are presented in Figure 2 and compared with the experimental results. The Henry’s constants were calculated from the chemical potential of xenon in the solvent at infinite dilution.49 As can be seen from the
figure, the SAFT-VR predictions are in excellent agreement with the experimental results for the xenon + n-pentane mixture. In the case of xenon + n-hexane the theoretical results underes-timate the experimental Henry’s coefficients by∼10%. It should be kept in mind, however, that no deviations from the Lorentz-Berthelot combining rules were introduced, and
there-H2,1(T, p) ) lim x2 f 0 [RTF1exp(µ2exc,∞/ RT)] (12) µ2 exc,∞) -RT〈V exp( uTP/ kT)〉NpT 〈V〉NpT (13)
TABLE 5: Nonbonded Parameters for Each Interaction Site Used in This Work for Computer Simulation Calculations Compared with the Original Ones
this work original (ε/kB)/K σ/Å (ε/kB)/K σ/Å
CH331 100.75 3.787 98 3.75
CH231 47.2 4.03 46 3.95
fore, agreement with experimental data could be improved by adjusting the cross-interaction energy; however, this would detract from the comparisons being made to the n-alkanes.
A theoretical interpretation of the results was also attempted by Monte Carlo simulation. Henry’s constants as a function of temperature obtained by simulation are presented in Table 6 for xenon + n-pentane and Table 7 for xenon + n-hexane, both with their standard deviations. The comparison with experi-mental results is shown, respectively, in Figure 3a and 3b. In the case of xenon + n-pentane, the agreement between simula-tion and experimental results is remarkable, in particular at the lowest temperatures. In the high-temperature limit, the deviations between simulation and experimental results seem to increase, in any case not exceeding 7%. For xenon in hexane, the agreement is quite good, also showing more pronounced deviations at the highest temperatures; the maximum deviation from experimental results is 9%. The most interesting feature of the results is the fact that the prediction was done with a rather simple model for the n-alkanes. The xenon + n-hexane system is much better described by this model than by the OPLS all-atom force field, as used by Bonifa´cio et al.13As shown in
this work, modeling n-alkanes with force fields based on implicit hydrogen atoms can be quite successful for vapor-liquid equilibrium predictions. It is also interesting to note the resemblance between the two models underlying the two theoretical treatments (TraPPE-UA and SAFT-VR). In both
cases, the n-alkane molecules are taken as a chain of spherical segments interacting through a spherical symmetric potential, though the intramolecular interactions within the n-alkane chain are not considered explicitly in the SAFT model. The xenon particle is also modeled as a sphere of practically the same diameter. As can be seen, the results of both treatments are very similar and both are able to capture the similarity of thermo-dynamic behavior between xenon and the n-alkanes.
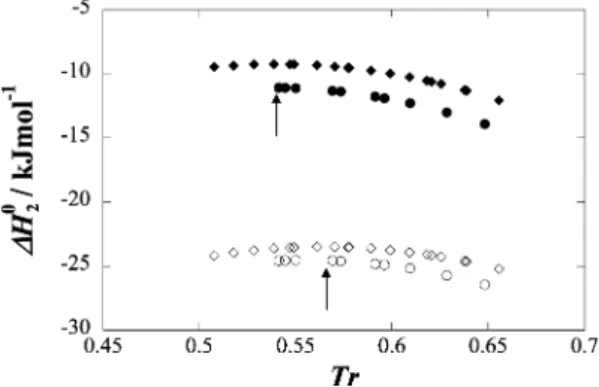
The standard enthalpy of solvation for xenon + n-pentane and xenon + n-hexane solutions is plotted in Figure 4 as a function of temperature. As can be seen, the enthalpy of solvation slightly increases at lower temperatures, goes through a maximum, and then decreases at higher temperatures. The temperature at which the solvation enthalpy is maximum is 254.5 K for xenon + n-pentane) and 275 K for xenon + n-hexane. Interestingly, these temperatures correspond to 0.54 reduced temperature for both solvents and is very close to the reduced temperature at which HE(x ) 0.5) becomes zero for
mixtures of n-alkanes (Figure 1).
The dissolution process of a solute in a solvent is often described as the combination of two contributions: (1) formation of a cavity with the appropriate size and shape to host the solute
TABLE 6: Monte Carlo Results of Henry’s Constants for the Dissolution of Xenon in n-Pentane As a Function of Temperature, Henry’s Constants at Saturation Pressure of the Solvent, and Henry’s Constant Standard Deviations
T/K H2,1/MPa psat/kPa H2,1psat/MPa δH2,1psat/MPa
250 1.81 7.538 1.80 0.087 255 1.97 9.919 1.97 0.085 260 2.21 12.89 2.20 0.098 265 2.36 16.56 2.36 0.10 270 2.58 21.05 2.57 0.096 275 2.87 26.48 2.86 0.084 280 3.08 32.99 3.07 0.14 285 3.36 40.73 3.35 0.10 290 3.52 49.87 3.52 0.091 295 3.85 60.57 3.85 0.13 300 4.15 73.01 4.15 0.11 305 4.40 87.39 4.40 0.091
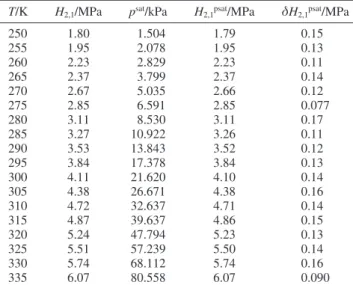
TABLE 7: Monte Carlo Results of Henry’s Constants for the Dissolution of Xenon in n-Hexane As a Function of Temperature, Henry’s Constants at Saturation Pressure of the Solvent, and Henry’s Constant Standard Deviations
T/K H2,1/MPa psat/kPa H2,1psat/MPa δH2,1psat/MPa
250 1.80 1.504 1.79 0.15 255 1.95 2.078 1.95 0.13 260 2.23 2.829 2.23 0.11 265 2.37 3.799 2.37 0.14 270 2.67 5.035 2.66 0.12 275 2.85 6.591 2.85 0.077 280 3.11 8.530 3.11 0.17 285 3.27 10.922 3.26 0.11 290 3.53 13.843 3.52 0.12 295 3.84 17.378 3.84 0.13 300 4.11 21.620 4.10 0.14 305 4.38 26.671 4.38 0.16 310 4.72 32.637 4.71 0.14 315 4.87 39.637 4.86 0.15 320 5.24 47.794 5.23 0.13 325 5.51 57.239 5.50 0.14 330 5.74 68.112 5.74 0.16 335 6.07 80.558 6.07 0.090
Figure 3. Henry’s constants for (a) xenon + n-pentane and (b) xenon
+ n-hexane obtained by computer simulation (0, with their corre-sponding error bars) in comparison with experimental results (b).
Figure 4. Standard molar enthalpies of solvation ∆H2° for ([) xenon
molecule and (2) interaction between the solute molecules and the solvent molecules within its coordination sphere. Energeti-cally, cavity formation is often identified with the vaporization enthalpy of the solvent, ∆Hvap, corrected for the change in size
and shape of the cavity. Irrespectively of the model used to calculate the enthalpy of cavity formation, Hcav, the
solute-solvent enthalpy of interaction, Hint, can then be obtained from
the solvation enthalpy as
In this work we calculated the enthalpy of cavity formation for xenon in n-pentane and n-hexane following the procedure proposed by Sinonaglu50
where Ss/SSrepresents the ratio of the surfaces of the solute
and solvent cavities and can be calculated from partial molar volumes at infinite dilution of the solute in the solvent, molar volumes of the solvent, and simple geometrical considerations. The calculated interaction enthalpies, Hint, are plotted in
Figure 5 as a function of the reduced temperature. As can be seen, the interaction enthalpy of xenon and n-pentane is stronger (more negative) than that with n-hexane. This reflects the higher percentage of CH3groups in the n-pentane molecule, with which
xenon interacts more strongly than with CH2groups.51However,
perhaps more interestingly, it is also seen that the interaction enthalpy of xenon with both alkanes shows a maximum at a reduced temperature of 0.57. As previously explained, mixtures of n-alkanes mix with positive excess enthalpies at low temperature that decrease with increasing temperature, go through zero, and become negative at higher temperatures. The temperature at which HE(x ) 0.5) becomes negative is found
to be within 0.57 and 0.59 for all systems (Figure 1b). It should be emphasized that separating the experimental solvation enthalpy into contributions from cavity formation within the solvent and solute-solvent interaction provides a clear indication that the explanation for the observed behavior should be at the level of the cross interaction. While the reason for this behavior is not clear, the present result is a further example of the similarity between the xenon + n-alkane interaction and the n-alkane + n-alkane interactions.
7. Conclusion
Solubilities of xenon in n-pentane, expressed as Henry’s law coefficients, were measured between 254 and 304 K with an estimated accuracy of 0.15%. The thermodynamic functions of solvation such as the standard Gibbs energy, enthalpy, and entropy of solvation have been calculated from Henry’s law coefficients and its temperature dependence for xenon + n-pentane solutions and for xenon + n-hexane from a previous work. The molar enthalpy of solvation was decomposed into its cavity and interaction contributions. For both systems the enthalpy of interaction shows a maximum at a reduced tem-perature of 0.57, the same reduced temtem-perature at which the excess enthalpy for equimolar mixtures of n-alkanes change from positive to negative. This result provides a further example of the similarity between the xenon + n-alkane interaction and the n-alkane + n-alkane interactions.
The solubility results were modeled using the SAFT-VR equation and molecular simulation. The theoretical results predict closely the experimental solubility of xenon in n-pentane and n-hexane over the range of temperatures studied using simple Lorentz-Berthelot combining rules for the unlike interactions.
References and Notes
(1) Lynch, C., III; Baum, J.; Tenbrinck, R. Anesthesiology 2000, 92, 865–868.
(2) Pollack, G. L. J. Chem. Phys. 1981, 75, 5875–5878. (3) Pollack, G. L. Science 1991, 251, 1323–1330.
(4) Lim, Y.-H.; King, A. D., Jr. J. Phys. Chem. 1993, 97, 12173–12177. (5) Dias, L. M. B.; McCabe, C.; Filipe, E. J. M.; Calado, J. C. G. J.
Phys. Chem. B 2004, 108, 7377–7381.
(6) Filipe, E. J. M.; Gomes de Azevedo, E. J. S.; Martins, L. F. G.; Soares, V. A. M.; Calado, J. C. G.; McCabe, C.; Jackson, G. J. Phys. Chem.
B 2000, 104, 1315–1321.
(7) Filipe, E. J. M.; Martins, L. F. G.; Calado, J. C. G.; McCabe, C.; Jackson, G. J. Phys. Chem. B 2000, 104, 1322–1325.
(8) Gil-Villegas, A.; Galindo, A.; Whitehead, P. J.; Mills, S. J.; Jackson, G.; Burgess, A. N. J. Chem. Phys. 1997, 106, 4168–4186.
(9) Personal communication.
(10) Martins, L. F. G. Ph.D. Thesis, Instituto Superior Te´cnico, Lisboa, Portugal, 1999.
(11) Dos Ramos, M. C.; Blas, F. J. J. Phys. Chem. B 2005, 109, 12145– 12153.
(12) Hildebrand, J. H.; Prausnitz, J. M.; Scott, R. L. Regular and Related
Solutions; Van Nostrand Reinhold: New York, 1970; pp 111-141.
(13) Bonifa´cio, R. P.; Costa Gomes, M. F.; Filipe, E. J. M. Fluid Phase
Equilib. 2002, 193, 41–51.
(14) Bonifa´cio, R. P.; Filipe, E. J. M.; McCabe, C.; Costa Gomes, M. F.; Pa´dua, A. A. H. Mol. Phys. 2002, 101, 2547–2553.
(15) Ambrose, D.; Walton, J. Pure Appl. Chem. 1989, 61, 1395–1403. (16) Carnicer, J.; Gibanel, F.; Urieta, J. S.; Gutierrez Losa, C. ReV. Acad.
Cienc. Zaragoza 1979, 34, 115–122.
(17) Smith, J. M.; Van Ness, H. C.; Abbott, M. M. Introduction to
Chemical Engineering Thermodynamics, 5th ed.; McGraw-Hill: New York,
1996.
(18) Rettich, T. R.; Handa, Y. P.; Battino, R.; Wilhelm, E. J. Phys. Chem.
1981, 85, 3230–3237.
(19) Benson, B. B.; Krause, D. J., Jr. J. Sol. Chem. 1989, 18, 803–821. (20) Lemmon, E. W.; Goodwin, A. R. H. J. Phys. Chem. Ref. Data
2000, 29, 1.
(21) Cibulka, I. Fluid Phase Equilib. 1993, 89, 1–18.
(22) Dymond, J. H.; Cholinski, J. A.; Szafranskiand, A.; Wyrzykowska-Stankiewicz, D. Fluid Phase Equilib. 1986, 27, 1–13.
(23) Dymond, J. H.; Smith, E. B. The Virial Coefficients of Pure Gases
and Mixtures; Clarendon Press, Oxford, 1980.
(24) Poling, B. E.; Prausnitz, J. M.; O’Connell, J. P. The Properties of
Gases and Liquid, 5th ed.; McGraw-Hill: New York, 2001.
(25) Tiepel, E. W.; Gubbins, K. E. Can. J. Chem. Eng. 1972, 50, 361– 364.
(26) Tiepel, E. W.; Gubbins, K. E. J. Phys. Chem. 1972, 76, 3044– 3049.
(27) Pollack, G. L.; Himm, J. F. J. Chem. Phys. 1982, 77, 3221–3229. (28) Clarke, E. C. W.; Glew, D. N. Trans. Faraday Soc. 1966, 62, 539– 545.
Figure 5. Standard molar enthalpies of solvation, ∆H2° (filled
symbols), and enthalpies of interaction, Hint(open symbols), for xenon
+ n-pentane (circles) and xenon + n-hexane (diamonds) as a function of reduced temperature. The arrows locate maxima.
Hint) ∆H2 0- H cav (12a) Hcav) Ss SS ∆vapH (13a)
(29) Costa Gomes, M. F.; Grolier, J. P. Phys. Chem. Chem. Phys. 2001,
3, 1047–1052.
(30) Galindo, A.; Davies, L. A.; Gil-Villegas, A.; Jackson, G.; Calero, S.; Lago, S. Phys. ReV. E 1998, 57, 2035. McCabe, C.; Gil-Villegas, A.; Jackson, G. Chem. Phys. Lett. 1999, 303–27. Davies, L. A.; Gil-Villegas, A.; Jackson, G. J. Chem. Phys. 1999, 111–8659. Kalyuzhnyi, Y.; McCabe, C.; Whitebay, E.; Cummings, P. T. J. Chem. Phys. 2004, 121–8128.
(31) McCabe, C.; Jackson, G. Phys. Chem. Chem. Phys. 1999, 1, 2057. McCabe, C.; Galindo, A.; Garcia-Lisbona, M. N.; Jackson, G. Ind. Eng.
Chem. Res. 2001, 40, 3835. McCabe, C.; Kiselev, S. B. Ind. Eng. Chem. Res. 2004, 43, 2839.
(32) McCabe, C.; Galindo, A.; Gil-Villegas, A.; Jackson, G. Int. J.
Thermophys. 199819, 1511. McCabe, C.; Gil-Villegas, A.; Jackson, G. J. Phys. Chem. B 1998, 102, 4183. Galindo, A.; Florusse, L. J.; Peters, C. J. Fluid Phase Equilib. 1999, 160, 123. Sun, L. X.; Zhao, H. G.; Kiselev,
S. B.; McCabe, C. J. Phys. Chem. B 2005, 109, 9047. Zhao, H. G.; Morgado, P.; McCabe, C.; Gil Villegas, A. J. Phys. Chem. B 2006, 110, 24083.
(33) Sun, L. X.; Zhao, H. G.; Kiselev, S. B.; McCabe, C. Fluid Phase
Equilib. 2005, 228, 275.
(34) Dias, L. M. B.; Bonifacio, R. P.; Filipe, E. J. M.; Calado, J. C. G.; McCabe, C.; Jackson, G. Fluid Phase Equilib. 2003, 205, 163. Pollock, M.; Adjiman, C. S.; Galindo, A.; Jackson, G.; Filipe, E. J. M. Ind. Eng.
Chem. Res. 2009, 48, 2188.
(35) McCabe, C.; Galindo, A.; Gil-Villegas, A.; Jackson, G. J. Phys.
Chem. B 1998, 102, 8060. Bonifacio, R. P.; Filipe, E. J. M.; McCabe, C.;
Gomes, M. F. C.; Padua, A. A. H. Mol. Phys. 2002, 100, 2547. Morgado, P.; McCabe, C.; Filipe, E. J. M. Fluid Phase Equilib. 2005, 228, 389. Morgado, P.; Zhao, H. G.; Blas, F. J.; McCabe, C.; Rebelo, L. P. N.; Filipe, E. J. M. J. Phys. Chem. B 2007, 111, 2856.
(36) Watson, G.; Latitte, T.; Zeberg-Mikkelsen, C. K.; Baylaucq, A.; Bessieres, D.; Boned, C. Fluid Phase Equilib. 2007, 253, 80. Castro-Marcano, F.; Olivera-Fuentes, C. G.; Colina, C. M. Ind. Eng. Chem. Res.
2008, 47, 8894. Clark, G. N. I.; Galindo, A.; Jackson, G.; Rogers, S.;
Burgess, A. N. Macromolecules 2008, 41, 6582.
(37) McCabe, C.; Galindo, A.; Cummings, P. T. J. Phys. Chem. B 2003,
107, 12307. Valtz, A.; Chapoy, A.; Coquelet, C.; Paricaud, P.; Richon, D. Fluid Phase Equilib. 2004, 226, 333. Clark, G. N. I.; Haslam, A. J.; Galindo,
A.; Jackson, G. Mol. Phys. 2006, 104, 3561. Zhao, H. G.; McCabe, C.
J. Chem. Phys. 2006, 125, 4504.
(38) Blas, F. J.; Galindo, A. Fluid Phase Equilib. 2002, 194-197, 501. Sun, L. X.; Zhao, H. G.; Kiselev, S. B.; McCabe, C. Fluid Phase Equilib.
2005, 228, 275.
(39) Galindo, A.; Blas, F. J. J. Phys. Chem. B 2002, 106, 4503. (40) dos Ramos, M. C.; Blas, F. J.; Galindo, A. J. Phys. Chem. C 2007,
111, 15924.
(41) dos Ramos, M. C.; Blas, F. J.; Galindo, A. Fluid Phase Equilib.
2007, 261, 359.
(42) Jackson, G.; Gubbins, K. E. Pure Appl. Chem. 1989, 61, 1021. (43) Archer, A. L.; Amos, M. D.; Jackson, G.; McLure, I. A. Int. J.
Thermophys. 1996, 17, 201.
(44) http://towhee.sourceforge.net.
(45) Martin, M. G.; Siepmann, J. I. J. Phys. Chem. B 1998, 102, 2569. (46) Palace Carvalho, A. J.; Prates Ramalho, J. P.; Martins, L. F. G. J.
Phys. Chem. B. 2007, 102, 2569.
(47) Laginhas, C. E. C.; Palace Carvalho, A. J.; Prates Ramalho, J. P.; Martins, L. F. G. Proceedings of the 10th International Chemical and Biological Engineering
Conference, CHEMPOR, Braga, Portugal, Sept 4-6, 2008.
(48) Bohn, M.; Lago, S.; Fischer, J.; Kohler, F. Fluid Phase Equilib.
1985, 23, 137.
(49) Ghonasgi, D.; Llanorestrepo, M.; Chapman, W. G. J. Chem. Phys.
1993, 98, 5662.
(50) Sinanoglu, O. Mol. Interact. 1982, 3, 283.
(51) Bonifa´cio, R. Ph.D. Thesis, Instituto Superior Te´cnico, 2004. JP105713M