A Work Project, presented as part of the requirements for the Award of a Master Degree in Management from the NOVA – School of Business and Economics.
SOCIAL IMPACT BOND FEASABILITY STUDY EQUITY IN PRIMARY EDUCATION IN LATVIA:
MISSION POSSIBLE
LUIZE JANSONE, 2979
A Project carried out on the Master in Management Program, under the supervision of: António Miguel (Nova SBE)
2 Abstract
Educational inequity is one of the most pressing problems in Latvian school system. As educational inequity is a complex problem with devastating long-term consequences, it requires a strong intervention model to tackle it successfully. Mission Possible is a member of Teach for All network whose methodology globally has shown great success in tackling inequity in disadvantaged schools. This feasibility study evaluates whether Mission Possible is an appropriate intervention to be financed through a Social Impact Bond (SIB) and whether it would bring any social and financial value to all stakeholders involved.
Keywords: Social Impact Bond; Feasibility study; Educational inequity; Mission Possible case
Foreword
The author would like to thank Professor António Miguel for his help and kindness during this feasibility study, as well as thanks to Kārlis Andersons and Aija Upleja form Iespējamā Misija for open-mindedness and provision of all information necessary. A great appreciation goes also to the authors’ family and friends who have always supported, encouraged and inspired her.
3
Table of
Contents
Table of Contents ... 3
1. Methodology of the Thesis ... 4
2. Literature Review on Social Impact Bonds ... 5
3. The Problem: Inequity in primary education in Latvia ... 7
4. The Root Causes of Educational Underachievement in Disadvantaged Schools ... 9
5. Consequences of Educational Underachievement: From Grade Repetition to Long-term Inequality ... 10
6. Solution for Inequity and Underachievement in Latvian Schools ... 13
7. Intervention Model: Mission Possible ... 15
8. Construction of The Social Impact Bond for Mission Possible ... 17
8.1. Modelling Mission Possible Social Impact Bond... 19
8.2 Intervention Costs ... 19
8.2. Outcome Metrics ... 19
8.3. Payment Mechanism... 20
8.4. Investment Structure ... 21
9. SIB Business Case and Sensitivity Analysis ... 21
9.1. Business Case ... 21 9.2. Scenarios ... 22 10. Limitations ... 24 11. Recommendations ... 25 12. Bibliography ... 26 13. Appendix ... 29
4
1.
Methodology of the Thesis
This feasibility study was developed as a management master thesis work project in the Directed Research format. It was integrated in the Social Impact Bond Research Programme by Social Investment Lab (Laboratório de Investimento Social) in Lisbon, Portugal. The main purpose of this programme is to promote and foster the development of SIB feasibility studies on different social problems. The goal of this feasibility study is to evaluate whether the intervention model by Mission Possible (Iespējamā Misija) is a suitable project to be invested in through the SIB model. The structure of this study follows a general SIB feasibility study methodology, and include the following steps: understanding of the social problem of inequity in education and associated socio-economic implications; identifying the most appropriate intervention model to tackle the problem; determining how a SIB could be an appropriate investment model to fund the intervention model; and creating a SIB business case with possible scenarios for its application in Latvia.
During the development of this study the methodology of work included the access to a structured training plan including workshops on financial modelling for SIB’s, PowerPoint Presentations, and mentoring from the supervisor, the managing director of LIS was available as well. To get a better understanding of the organisation, its activities and the intervention model, Mission Possible was consulted and contributed to the study with valuable information and documentation. Very supportive and valuable relationship was established with Kārlis Andersons, the Director of MP and Aija Upleja, Participant Recruitment, Selection & Marketing Manager.
The methodology was defined in the beginning of the study, including main objectives, tasks and timeline, which can be consulted in the Appendix 1.
5
2.
Literature Review on Social Impact Bonds
For a long time, it has been perceived to be governments’ job to solve societal problems. [Eggers & Macmillan, 2013] To do so, most governments exploit a traditional “fee for service” model, funding tested and safe inputs (such as human resources) or activities (services) that lead to certain outcomes. [Bridges Impact, 2014] The traditional model presents several issues such as hindered innovation, lack of attention to performance indicators, and having no incentives to thrive for better outcomes. On top of that, often the State does not have the capacity to provide services directly to those who are more vulnerable and represent the segments of the population facing prominent social issues (e.g. homelessness, unemployment, health conditions, etc.). Therefore, social organisations (who encompass the third sector), emerge as key players in tackling the societal problems. Yet, they face several difficult challenges as well. Their reliance on grants and donations combined with insufficient and ineffective use of resources, and lack of ability to deliver high quality services of scale [Gustafsson-Wright, Gardiner & Putcha, 2015] are great challenges that organisations find hard to overcome. That in turn may lead to difficulties that range from attracting talent to, most importantly, achieving the intended outcomes and impact.
Considering challenges both government and social organisations face, the need for different approaches in financing social interventions becomes clear. In recent years’ impact investing as a tool for financing innovative social interventions as well as receiving financial returns has become increasingly popular, and one model is taking the lead. Social Impact Bonds (SIB) also known as Pay for Success (in USA) or Social Benefit Bonds (in Australia) are welfares’ and social sector’s equivalent to public-private partnerships (PPP) for infrastructure financing with a few major distinctions.
Firstly, SIBs are set up between four main actors, namely impact investors which provide upfront investment and expect financial returns, service provider which uses the capital
6 provided to implement its services, an outcome payer which agrees to repay initial investment plus interest if and only if the intended outcomes are reached, and an independent evaluator. [Bridges Impact, 2014]. Each SIB is structured around a well-defined social outcome in an intervention area and appropriate success metrics are agreed on between parties. Secondly, there is a set of characteristics that define a SIB, i.e., there is a clear social problem that costs a significant amount of money to the public sector; a well-defined intervention model is undertaken by a social organisation to solve the problem; pre-defined, measurable and objective outcomes are set that shows cost savings and generate incentives to perform well. [Social Finance, 2016]
Benefits attributed to such social service financing model are extensive. First, it enables government to innovate by transferring the risk. Second, it promotes collaboration between funders, thus making it easier to gather funds for social problems that are not in a single department’s supervision. Thirdly, very important aspect presented by SIB is that due to its nature that requires clearly defined metrics, profound data and research, and feedback, it consequentially brings rigor to the delivery models. This ensures that the model is adequate to the current situation on the ground and resources are targeted towards the intended outcomes. [Social Finance, 2016]
Summing it up, SIB’s provide a wide range of benefits to social organisations, public sector, investors and after all, the society in general. To a social organisation, it encompasses the ability to innovate or scale the intervention to grow the impact. SIB’s enable governments to focus their resources on outcomes, to invest in interventions and preventative services, and stimulate innovation. Investors benefit both financially from a successful investment that is also linked to social outcomes, and from opportunity to support entrepreneurial solutions. [Bridges Impact, 2014]
7 Since 2010 when the very first SIB was introduced in The United Kingdom, already 60 projects have been launched worldwide from which 21 have demonstrated positive social outcomes [Social Finance, 2016]. Nevertheless, there are sceptics out there pointing at the fact that the model itself is too complicated that the complexity and the time needed to set up the model does not outweigh the benefits. [OECD LEED, 2015] The perceived complexity here stems from three aspects of the SIB: firstly, it requires quantifying issues that have a human dimension in order to define outcome metrics; secondly, developing an appropriate measurement to avoid cherry-picking and to incentivize working towards outcomes is a challenge in itself; and lastly it may be rather difficult to establish a partnership between the main actors [Social Finance, 2016] Even though the above mentioned challenges are indeed resource intensive and require spending, the benefits of a SIB should be assessed on a long-term. This is what is called “value for money” [Social Finance, 2016] – the value comes not only from cost savings but from spending it on more efficient interventions that deliver better outcomes in a long term.
The perceived complexity described before and relatively small body of data on other SIBs comparing with mainstream financial instruments may pose a challenge when introducing the model in a country for the first time. There is a range of conditions that must be in place for the SIB to be viable1, but the most important one is the readiness of governmental body to take on different ways of contracting social services [Social Finance, 2016].
This feasibility study will examine whether a social impact bond is a viable mechanism to provide additional funding to a Latvian educational organisation Mission Possible that works towards improving equity in primary education.
3.
The Problem: Inequity in primary education in Latvia
Maximising the educational attainment of all young people is a priority for Europe. It is important because higher levels of educational attainment are associated with better
8 employment outcomes, more active citizenship and people's overall greater wellbeing. A higher level of educational attainment also increases society’s prosperity. [Education and training Monitor, 2016] Nowadays in most of the developed countries enrolment rates in primary and lower secondary education are close to 100%. Yet, despite the virtually universal enrolment and increase in the number of years of schooling, outcome inequities are growing and in fact the gap between more advantaged and more disadvantaged students is getting bigger. [Johansone, 2010]
Terms equity and equality are often used interchangeably in discussions on education, but a clarification here is useful. Generally, equality means providing everyone with the same resources and equal opportunities, whereas equity implies that everyone gets those resources and has an access to opportunities they need. [Mann, 2014] In PISA tests equity in education is defined as providing all students, regardless of gender, family background or socio-economic status, with similar opportunities to benefit from education. For example, the stronger the impact of a student’s socio-economic status on his or her performance, the less equitable the school system. [PISA, 2012]
Performance differences between socio-economically advantaged and disadvantaged students, or those attending rural and urban school are some of the variables that indicate the degree to which and education system is equitable. [Faubert, 2012]. Students from low socio-economic background are twice as likely to be low performers, implying that personal or social circumstances are obstacles to achieving their educational potential [OECD, 2012]. Across OECD countries this gap is well represented by differences in the PISA scores. For instance, Latvia in PISA tests scores around the OECD average: mean score in maths being 482 (OECD 490), in reading 488 (493), and in science 490 (493). Overall, Latvia scores close to OECD average, but there is a smaller share of top performers (8.3% compared to 15.3% OECD average), and smaller share of low achievers (10.5% compared to 13.0%). However, in Latvia,
9 there are large disparities across the school system where students from rural areas score significantly lower than those in the city. On top of that, in Latvia, 26 score point difference is associated with one unit change on the ESCS index2. In context - 30 points on PISA test is estimated to be comparable to one year of schooling. [PISA 2015 Results]
4.
The Root Causes of Educational Underachievement in
Disadvantaged Schools
There is a wide range of root causes of underachievement, stemming from a combination of personal, social, economic, educational and family-related factors, and is often a result of cumulative disadvantage. [Education and training Monitor, 2016] Schools and thus students are most vulnerable to this in rural areas as socio-demographic situation there usually tend to be lower. [Appendix 2] There are five main sources of inequity in education.
1) Socio-economic inequity: socio-economically disadvantaged students tend to underperform academically, show lower ambitions and continue education after mandatory period at lower rates when compared with their wealthier peers. Additionally, the peer effect also contributes to lower achievements. [Hanushek, Kain, Markamn & Rivkin, 2003] On top of that, schools in less advantaged regions such as those in rural areas tend to have fewer resources to invest in teachers and specialised courses, extracurricular activities, computers and books; 2) Familial inequity: students living in a dysfunctional household may receive little educational support or encouragement from their parents. Research suggests that student’s academic performance is positively correlated with their parents’ educational level; [Dubow, Boxer & Huesmann, 2010]
3) Staffing inequity: schools in disadvantaged areas may lack teachers or have less skilled personnel, hindering academic achievements of the students. This often is combined with
2 The ESCS (economic, social and cultural status) index summarises different aspects of one’s socio-economic status. The index is derived from several variables related to students’ family background, and it has a strong impact on student’s educational achievement.
10 Instructional inequity – classes may be taught by less-skilled teachers in uninteresting or ineffective way, or in some courses significantly less content may be taught;
4) Assessment inequity: students may be disadvantaged when taking tests due to the design, content or language choices. Often related with Linguistic inequity: students who are not yet proficient in Latvian3, may be disadvantaged in Latvian-only classrooms or when taking tests and assessments presented in Latvian. Additionally, lower-income students who attend schools that do not regularly use computers may be disadvantaged—compared to wealthier students with more access to technology at home or students who use computers regularly in school. [Great Schools Partnership, 2016]
5) Learning environment: in schools in disadvantaged areas expectations for students tend to be lower as well as low morale; more ability grouping is evident. On top of that, in those schools usually is a lack of after-school opportunities.
5.
Consequences of Educational Underachievement: From Grade
Repetition to Long-term Inequality
Inequality and inequity in education is such a serious problem because of its complexity and a wide range of implications that are attributed to lower educational achievements.
The most obvious problems posed by lower educational attainment are grade repetition and higher risk of dropping out of school, the latter usually being related with the former. In Latvian schools, transition to the next grade takes place automatically as there are no formal examinations to pass from one class to the next. A student must pass all subjects with a grade of at least 4 points (out of 10) or with satisfactory descriptive evaluation in the first 3 years of school. [Cabinet of Latvia, Regulation Nr. 591] Grade repetition is allowed, however, both teachers and parents are involved in the decision-making process. [OECD, Education in Latvia, 2016] In reality, grade repetition is used very rarely because of a low support for such measures
11 - in academic year 2015/2016 there were only 1708 students that repeated a year, constituting 0.98% of total student population [State Department of Educational Quality, 2016] This number seems very low especially when compared with the share of low-achievers. In 2012, proportion of 15-year-olds with underachievement in reading was 17.0% (EU 17.8%), in maths 19.9% (EU 22.1%), and in science 12.4% (EU 16.6%). Average drop-out rate in lower-secondary education is around 2.8% [World Inequality Database on Education] However, it is much higher for grades 7to 12 – 14% and 23% respectively. The rate increases with each grade, is higher in rural areas and among economically disadvantaged students, and half of them have dissatisfactory educational results. [Baltic Institute of Social Sciences]
Furthermore, admissions in Latvian tertiary education system are based on achievements in national centralised high school exams - meaning that only the higher scoring students have the chance to enrol in governments funded study programs. The remaining students also have the option to enrol but need to pay for their studies. On average, around 32% of all students are enrolled in state funded study places. For low-achiever this barrier can be insurmountable, as there is numerus clausus system in place. [MoES, 2016] There is no available data on socio-economic characteristics of the two groups. However, Cabinet of Latvia has published an evaluation of the tertiary highlighting the strengths and weaknesses of it. Some of the weaknesses outlined there are as follow: state funded study places mainly are beneficial to students from better socio-economic backgrounds; student loans are not appealing for many students and loan guarantor requirement is a huge obstacle for many; there is virtually non-existent support for students from poor backgrounds as well as there is no mechanism in place to check whether a student has an access to funds to finance the study process. [Cabinet of Latvia, Regulation Nr. 333] All that combined increases chance of an individual to become NEET – not in employment, education or training. About 35% (around 35,000 individuals) of
12 those who are NEET in Latvia have only below upper secondary education.4 Total costs of NEET as for 2011 were estimated to be € 535,755,173 or about € 5515 per NEET individual. A dismal majority of economically inactive citizens in Latvia have obtained only secondary education or below. [Appendix 3] Unemployment among individuals with tertiary education is just below 3.1%, and it increases dramatically as educational attainment decreases – 12% for individuals with upper secondary or post-secondary non-tertiary (general) and 23% among those with below upper secondary education. Higher level of education also influences earnings. Those with tertiary education earn around 67% more than those with post-secondary non-tertiary education. [OECD, 2016, Education at a Glance]
On top of that, across most countries and economies, including Latvia socio-economically disadvantaged students not only score lower in PISA tests, they also reported lower levels of engagement, drive, motivation and self-beliefs. [OECD, PISA 2014] The results also reveal that these are important components in fulfilling ones’ potential, and far too many students in most countries do not take the most of the opportunities available to them because they are just not engaged with school. On the contrary, research suggests that improved educational achievements are related to a range of positive outcomes such as increased earnings [OECD, 2012] lower potential of being unemployed, decreased likelihood of dropping out of school and dependence on social welfare programs.
From a system perspective, the development of higher skills is a necessary component to increase levels of competitiveness, innovation, job creation, GDP growth and social cohesion. [Education and training Monitor, 2016] All of which are very crucial and relevant in the current economical state of Latvia.
According to Trong (2009), if inequities remain unaddressed they can intensify disparities between social groups, affecting life situations ranging from health to the labour market. In
13 other words, inequity is a self-perpetuating problem, because more advantaged parents can send their children to better schools, support them more, having their children achieve higher levels of education thus better paying jobs and having the ability to then send their children to better schools, and so on. Most importantly, the same but in the opposite direction applies to disadvantaged families. Thus, it is crucial to break the circle and give a chance to more disadvantaged people to obtain great education.
6.
Solution for Inequity and Underachievement in Latvian Schools
There are many components that make up the school such as facilities, equipment, students themselves, and the staff and teachers. Although each of them is an important factor, the quality of a school cannot exceed the quality of its teachers and principals. This can be backed up with evidence from countries like Brazil, Colombia and Estonia among others that have improved their performance in PISA by establishing policies to improve the quality of their teaching staff. These policies include either adding to requirements to obtain a teaching licence, providing incentives for high‑achieving students to enter the profession, increasing salaries to make the profession more attractive and to retain more teachers. [OECD, 2013] A recent McKinsey & Company report on best practices on how the most improved school systems keep getting better, shows that Latvia over years has improved from “Fair” to “Good”. As noted there, for a country it is important to use a set of interventions that are suitable its current state. Now, Latvia must go from “Good” to “Great”, and as for this step, it is suggested that interventions should “focus on ensuring that teaching and school leadership is regarded as a full-fledged profession.” That includes raising calibre of entering teachers (improved recruiting programs, pre-service training and certifications requirements). [McKinsey & Company, 2010]Latvia, however, has not applied such intervention yet, but based on OECD recommendations, it should. According to OECD report, the most important step Latvia should take in order to improve learning outcomes across the country, is to establish conditions for teachers and school
14 leadership to thrive. [Reviews of National Policies for Education: Education in Latvia] In the way of doing so, Latvia must overcome several obstacles associated with attracting and maintaining the most talented students to the teaching. These obstacles range from attracting only the most talented and passionate ones to study programmes and increasing the reputation of such profession, to ensuring continuous development of and feedback to the teachers throughout professional life.
Some countries such as Estonia and Finland have already established more rigid selection process including a set of selective criteria to attract the best graduates into the profession [OECD, 2016]. However, this can work only if there are students that want to join this field, thus creating a competitive market with possibility to choose the best out of a group. In Latvia, however that is not the case as the reputation is rather bad mainly due to the low pay. Nevertheless, as pointed out before, the quality and motivations of teachers are crucial for equity. Hence the pressing need to develop recruitment policies that ensure highly motivated and talented people are being selected. Secondly, it is important to ensure that teacher’s education in continuous and relevant. Undeniably, initial teacher education is the first and crucial phase of teachers’ professional life, but that alone cannot produce ready-made professionals. It is crucial that teachers receive continuous professional development trainings and feedback throughout their careers. The aforementioned issues such are even more relevant when talking about disadvantaged schools. Majority of teachers prefer not to work in such schools, yet ensuring that high-quality teaching is available to disadvantaged pupils should be a priority, according to OECD report (2012) on Equity and Quality in Education.
Given that a positive learning climate can be considered a pre-condition for better student performance, it is important to attract the most talented teachers into the most challenging classrooms. [OECD, PISA 2014] Yet, disadvantaged schools that are most in need for qualified teachers, tend to have a great difficulty attracting them.
15 Great criticism is being targeted at Latvian educational system, and insufficient funding is being named as the most important problem that basically hinders any kind of improvements. Spending in primary and lower secondary education is relatively low, mainly due to the low teacher salaries. Annual expenditure per student by educational institutions for all services in 2013 for primary education was 3005 € (5974 USD in PPP), and in secondary 3025 € (6010 USD in PPP); compared with an OECD average of 8477 USD (PPP) and 9811 USD (PPP) respectively. [OECD, 2016 Education at a Glance] However, notable is the fact that in 2014 expenditure on education started to increase in the EU, and Latvia was one of the few countries that saw an increase of greater than 5%. [Education and training Monitor, 2016] Yet, despite that increase, equity problems in education are not resolved. This therefore indicates that more funding per se is not a sufficient solution, and new approaches are needed.
7.
Intervention Model: Mission Possible
“Mission Possible” (MP) is a partner organisation of the global “Teach for All” (TFA) network. TFA’s organisations overall mission is to “develop collective leadership to ensure all children have the opportunity to fulfil their potential.” [Teach for All] Latvian network organisation MP was founded in 2008, based on a belief that the leadership development approach is integral to addressing both educational inequity and its root causes. Thus, it places diverse and outstanding graduates from a range of academic disciplines into high-need schools. The reasoning behind it is that these schools have traditionally struggled to recruit high quality teachers and maintain low teacher turnover [Allen et al., 2012].
16 To ensure that only the best students are placed in schools, candidates first must pass a rigid four stage selection process. [Appendix 4] Then throughout their time in school, they receive several training sessions. First, prior to the start of the academic year they must participate in a 6 weeks intensive training course. Then, twice a year they must attend development trainings and on top of that every Friday is dedicated to some sort of short trainings as well. All the training is provided by MP graduates as well as by professionals in the respective area, including professors from universities. On top of that each teacher gets assigned to a personal mentor to ensure that a teacher gets professional support. It is all done to ensure that these graduates receive individual support and feedback as well as obtain important leadership skills. MP teachers work in schools as regular teachers with same obligations, responsibilities and rights. However, additionally to regular salary they would receive, MP teachers receive a scholarship of 200 € per month. The reasoning behind this is that teachers are paid poorly in Latvia, and since the program plus the trainings require full time commitment with no possibility to take upon other projects (as many teachers do in Latvia) to earn more, they are provided with an additional money to make the programme more attractive. Additionally, once per year they receive a small amount of money to organize educational activity for the students (e.g. school trip, event at school).
Figure 1: Mission Possible Timeline
MP program is rather popular in Latvia, as many schools want MP teachers in their staff. For instance, the first MP cohort was formed in 2008 and it consisted of only 11 graduates. Over next 8 years till 2016 a total of 147 participants have taken part in the program. In 2013. /2014. a.y. they received 85 requests, in 2016. /2017. a.y. already twice as much - 170. However, due Jun Jul Aug Sep Oct Nov Dec Jan Feb Mar Apr May Jun
Recruitment of Participants Initial Training 1st Development Training 2nd Development Training Recruitment of Schools Teacher Activity Support Academic Year Scholarships
17 to insufficient funds that they mainly get from private funding or Erasmus projects, MP is not able to match the supply with the growing demand.
Despite the growing scale, MP does not have any outcome measurement processes in place, neither research or impact measurement is done by MP in Latvia. Meaning, there is no evidence on how MP teachers are helping achieve equity in Latvian primary education. As the director of the MP points out, the only measurements they have are on outputs – the number of graduates applied to MP and the number of those who finish the MP two-year program. However, other Teach for All network organisations or those using similar approach have been reported to have great results in schools at all levels, and generally these teachers achieve even better results than veteran and fully certified teachers. [Allen & Allnut, 2013; Teach for America, 2012]
8.
Construction of The Social Impact Bond for Mission Possible
Target population: School children in 8th grade (typically 13-15-year olds) in schools in rural areas of Latvia (i.e. outside the capital city of Riga) that have high rates of grade repetition.5 In Latvia, average rate of grade repetition is low (~1.0%), but it is higher in 9th grade – around 2%. However, grade repetition has the tendency to concentrate at certain schools, thus there are numerous schools with much higher rates (that is, there are school such as gymnasiums where grade repetition is just not allowed and if that should be necessary, a student must change schools). Since the duration of the MP programme is 2 years, teacher is assigned to the 8th grade so that he/she would have a chance to work with the same students for this period leading up to the examination after the 9th grade. Rural schools are chosen firstly, because in PISA and national tests students in those overall schools score significantly lower; secondly, they struggle more to attract qualified teachers.
5 A complete list of these schools is available here:
18 A strong intervention model: Even though MP has not carried out any research or outcome measurements, based on evidence from other TFA network organisations, it is possible to assume that this model can improve educational achievements and decrease inequity.
Quantifiable outcomes and an effective measurement framework: MP can effectively maintain close contact with schools and teachers to track the progress of students they are working with. However, since MP does not have an established outcome measurement, it is recommended that they create a system to track the improvement of students’ achievement and to create evidence of the impact of MP teachers. To see how achievement has changed in the given school, a comparison of the national test scores at Year 9 as well as average final grades of Year 8 and 9 in two prior years before joining the programme could be compared with the results achieved during the program. To ensure more objectivity those results should be compared with those of similar schools who have not joined the programme. The control group can be created from schools of the same size and similar socio-economic locations.
Quantifiable economic benefit: By improving students’ educational achievements and fostering their further educational attainment (enrolment in either comprehensive or vocational high schools), MP is preventing them from grade repetition. On top of that, MP is improving their chances to get a job as well as receive higher salary, reducing possibility of those students to become NEET. Thus, it generates direct cost savings from smaller number of grade repetitions, as well as indirect cost savings from otherwise forgone taxes, and less spending on support for NEETS.
Alignment with public policies: The concept of social investment in Latvia is rather new and at a national level there are no policies in place to support it, yet. However, recently a discussion around the need of new investment tools to support innovation in education has been on the agenda. On top of that, the need for new approaches in providing more equitable system and improved teacher development programmes has been recognized by policymakers.
19
8.1. Modelling Mission Possible Social Impact Bond
The model as a dynamic tool. The main added value of this feasibility study is the financial model created in Excel. It is built in a dynamic way that allows to edit a set of inputs, including operational, metrics and performance inputs, and in result a case specific scenario is obtained. This tool can be used to develop a business case and perform a sensitivity analysis.
The length of the cohort is 25 months, and the total length of the intervention in 49 months. During this time 3 cohorts each of 50 teachers will start and finish the intervention. Each of the teachers is expected to teach at least two 8th grades and two 9th grades during each year of their placement, in total 8 classes.
8.2 Intervention Costs
The intervention costs are strongly linked to the size of the cohort. Usually MP worked with 20 teachers per cohort, however, based on the high demand and the capacity of the organisation, it is possible to increase the number up to 30 teachers. The total cost associated with the execution of MP intervention having 30 teachers per each of the 3 cohorts is 1,578,250 €, and are divided in different categories as follows: (costs per cohort can be consulted in Appendix 5)
Figure 2: Total Intervention Costs
8.2. Outcome Metrics
Selection of appropriate outcome metrics to measure success is an essential step in developing SIB. Two important things should be considered when choosing it – firstly, it must reflect the
Total Intervention Costs
Costs
Per Unit Unit
Number of Units Number of Activities Costs Per
Activity Total Costs
Recruitment of participants € 1 500 Teacher 90 1 € 135 000 € 135 000
Initial Training € 2 000 Teacher 90 1 € 180 000 € 180 000
Development Training € 1 000 Teacher 90 4 € 90 000 € 360 000
Scholarships € 200 Teacher 90 20 € 18 000 € 360 000
Teacher Acitivty Support € 250 Teacher 90 2 € 22 500 € 45 000
Recruitemnt of Schools € 350 School 90 1 € 31 500 € 31 500
Overheads € 9 335 50 € 9 335 € 466 750
20 success and greater impact the intervention is making, and secondly, the data on it must be available and accessible. In case of MP’s project, this is one of the biggest challenges. To estimate returns to education and particularly the costs and benefits of increased educational achievement a complex econometric model such as Mincerian production function should be produced. Several countries have done it and published the data, however, Latvia is not one of them.6 Thus, for the purpose of this project, the following outcome metrics were considered:
1) Year 8 completion results, which considers the grades and improvements of students that are at risk of failing after the first year of MP teacher being in class;
2) Year 9 completion results, which considers the grades and improvements of students that are at risk of failing after the two years of MP teacher being in class. No failing student should be in class after this period;
3) Enrolment in Secondary Education, which considers how many students after completing Year 9 enrolled in secondary education institution of any kind, as the main purpose of having better achievement in lower secondary school is to ensure that students can and will continue their education.
Currently none of these metrics is measured by MP, however, this data is available and easily accessible. While it does not cover the whole range of benefits that MP’s project produces, it can be a good starting point for outcome measurements.
8.3. Payment Mechanism
Based on the SIB structure, once the determined outcomes are achieved, investors are entitled to the repayment granted by government. For each of the outcome metrics an outcome payment is considered. The cost per student per school year is 3,005 €, and this amount is divided in two parts: 1,000 € after successfully completing Year 8, and the remaining 2,005 € after successful completion of Year 9. The cost of enrolling in secondary education in the model is set to be
21 3,500 €. However, it should be noted that currently there is no research done in Latvia on how much is the return to secondary education, nor how big are the forgone tax earnings, health costs and other spending for the government for each person with below secondary education. Thus, this cost is assumed as a fraction of the possible costs saving that could arise to government. However, there is a need for a rigid research and more precise estimate of how much is the return of upper secondary education.
8.4. Investment Structure
Timing of investors’ capital commitment: The total investment is gathered from investors at the beginning of the intervention and paid out to the service provider upfront.
Working Capital Contingency: The financial model also includes a working capital contingency of 94,695 € for three months of the intervention. This amount, however, should not be used unless there is such eventuality that requires a contingency, and this money is to be returned to investors at the end of the intervention if it has not been spent.
Repayment: The financial model considers a two-month delay between outcomes are measured and until payment is processed to investors. This period accounts for the time necessary for the process.
9.
SIB Business Case and Sensitivity Analysis
9.1. Business Case
The SIB structure proposed by this model considering all the factors and details mentioned before, results in the following financial outline, which shows a surplus of 178,100 € and IRR of 1,85%.
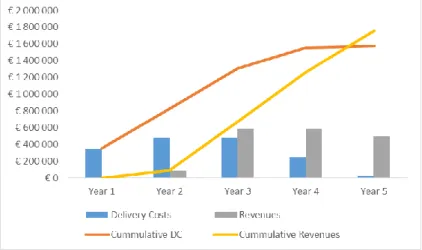
22 Figure 3: Mission Possible SIB Business Case
Investor Cash Flow. The total investor requirement (including WC contingency) is 1,663,050 €. The whole amount will outflow at the beginning of intervention as an upfront investment. Investors will receive their repayments after 15, 27, 30, 38, 42, 51 and 54 months, amounting to 1,850,485 € (including WC contingency). Hence, investor surplus is 187,435 € yielding an IRR of 1.85%.
Figure 4: Investor Cash Flow
9.2. Scenarios
The proposed business case is done based on many estimates that may or may not be realized, and any changes would have a strong impact on the business. Hence, the need to carry out a sensitivity analysis to prepare for unforeseen circumstances. Six different scenarios were tested, namely the most optimistic and the most pessimistic scenario for changes in one of the three main factors, ceteris paribus.
23 Number of At Risk Students per Teacher: This is one of the most important determinants of the success. Given that costs changes depending on how many teachers there are but not by how many students are reached by each of them, it is crucial to ensure that MP teachers are placed in schools where the situation is more critical. Three possibilities are showed below: if on average each of the teachers would work with only 1 at risk student (90 in total), base case when each teacher on average reaches 3 students (270 in total), and the best case when each teacher reaches 4 students (360 in total).
Figure 5: Scenario Analysis – Number of Students
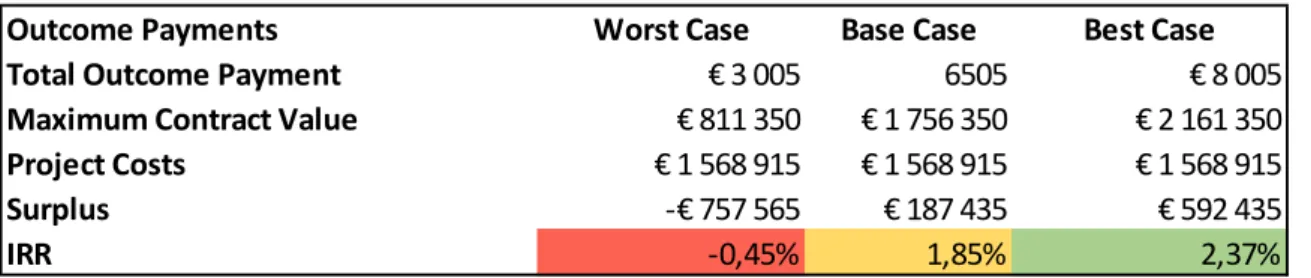
Outcome Payments: The amount of money that investors can receive per successfully reached outcome has a great impact on the project surplus and the investors’ financial returns. As it has been mentioned before, these cost estimates are not precise, thus it is necessary to see what impact different outcome payments would have. For the worst-case scenario, it is assumed that there would be no payment for enrolment in secondary education as this estimate lacks strong grounds. In the best case, this payment would be 5,000 €.
Figure 6: Scenario Analysis: Outcome Payment
Students Worst Case Base Case Best Case
Total Number of Students 90 270 360
Maximum Contract Value € 585 450 € 1 756 350 € 2 341 800
Project Costs € 1 568 915 € 1 568 915 € 1 568 915
Surplus -€ 983 465 € 187 435 € 772 885
IRR -1,46% 1,85% 2,72%
Outcome Payments Worst Case Base Case Best Case
Total Outcome Payment € 3 005 6505 € 8 005
Maximum Contract Value € 811 350 € 1 756 350 € 2 161 350
Project Costs € 1 568 915 € 1 568 915 € 1 568 915
Surplus -€ 757 565 € 187 435 € 592 435
24 Cohort: The number of teachers per each cohort is the main determinant of the outcome. There are several factors that can influence the number of starters in each cohort, and thus the number of students reached each year. Initially MP worked on average with 20 teachers per cohort (worst case: 60 in total), it is recommended for them to work with 30 per cohort (base case: 90 in total), and in the best-case scenario they could work with 50 teachers per cohort (150 in total).
Figure 7: Scenario Analysis: Number of Teachers
The success rate could be another variable tested in the sensitivity analysis. However, in this case it is not considered since only the number of students at risk of failing a year (based on previous results and their socio-demographic background) for each teacher is considered. Given that this number is rather small (in base case it is 3 students, possibly could be between 1 and 5), the aim is to ensure that all of them pass the year and enrol in the secondary education. For the intervention to be useful it is very important that this criterion is fulfilled.
10. Limitations
The main limitation of the model is the limited data available and accessible. Firstly, Mission Possible does not have outcome measurements of any kind, only some output measurements. Secondly, educational inequity is very complex problem with many factors causing it as well as many factors that should be measured to estimate the costs of it or benefits of reducing it. On top of that, Latvia became an OECD member country only in June, 2016, meaning that it has been included in very few research papers. Also, most of the research done by Latvian universities are not accessible for students that are not enrolled in the given university, as it was in this case. Thirdly, data on education in Latvia, the costs per student in different educational levels, rates of enrolment, dropouts, grade repetition among others are either outdated or just
Cohort Worst Case Base Case Best Case
Total Number of Teachers 60 90 150
Maximum Contract Value € 1 170 900 € 1 756 350 € 2 927 250
Project Costs € 1 198 415 € 1 568 915 € 2 309 915
Surplus -€ 27 515 € 187 435 € 617 335
25 are not available. For instance, in many articles and policy discussions oftentimes “rural schools” are said to be one of the biggest problems in Latvian education. However, it is nowhere said which exactly are these “rural schools”. Hence, many estimates and assumptions were made to create the model.
11. Recommendations
The benefits of improved educational equity are high based on research and empirical evidence. Globally Teach for All methodology has been proven to be effective to combat inequity, and has been recognised as a successful programme. However, in Latvian case of Mission Possible there are still long way to go before it can be considered as an appropriate intervention to deal with this societal problem. To apply SIB structure to the MP it first must create outcome measurement framework and identify exact target group. It should take a more focused approach by placing teachers in the more disadvantaged schools and in those grades where they can have the biggest impact. Nevertheless, educational inequity remains one of the most pressing basic education problems in Latvia. Considering the positive externalities that higher educational achievement and attainment has, it is crucial to ensure that every child receives good quality education notwithstanding their socio-economic background.
26
12. Bibliography
1. Allen, Rebbeca., Simon Burgess. and Jennifer Mayo. 2012. The teacher labour market, teacher turnover and disadvantaged schools: new evidence for England. CMPO working paper No. 12/294.
2. Allen, Rebecca., Allnut, Jay. 2013. Matched panel data estimates on the impact of Teach First on school and departmental performance. DoQSS Working Paper No. 13-11. September, 2013.
3. Baltic Institute of Social Sciences. Research on Reasons and Risk Factors of Early Drop-out among young people aged 13 to 18. (Pētījums par priekšlaicīgas mācību pamešanas
iemesliem un riskiem jauniešiem vecuma grupā no 13 līdz 18 gadiem.) Riga, 2014.
4. Cabinet of Latvia. 2015. Regarding New Funding Model of Tertiary Education in Latvia. Regulation Nr. 333.
5. Cabinet of Latvia. 2015. The order of enrolling students in comprehensive schools and in special pre-school groups as well as of discarding or transferring them to the next grade. (Kārtība, kādā izglītojamie tiek uzņemti vispārējās izglītības iestādēs un speciālajās
pirmsskolas izglītības grupās un atskaitīti no tām, kā arī pārcelti uz nākamo klasi).
Regulation Nr. 591. Article IV, Paragraph 32.
6. Central Bureau of Statistics. 2015. Inhabitants by the status of economic activity, level of education and gender. Accessed November 3, 2016.
http://data.csb.gov.lv/pxweb/lv/Sociala/Sociala__ikgad__nodarb/NB0350.px/table/tableVi ewLayout2/?rxid=cd
7. Central Statistical Bureau of Latvia. 2015. Statistical Yearbook of Latvia 2014. 8. Dubow, Eric, F.., Paul Boxer and L. Rowell Huesmann. 2010. “Long-term Effects of
27 Family Interactions, Child Aggression and Teenage Aspirations.” Merrill Palmer Q
(Wayne State Univ Press). 2009 Jul; 55(3): 224–249. DOI: 10.1353/mpq.0.0030
9. European Commission. 2006. “Communication from the Commission to the Council and to the European Parliament. Efficiency and equity in European education and training systems.” Accessed October 2, 2016.
http://eur-lex.europa.eu/legal-content/EN/ALL/?uri=CELEX%3A52006DC0481
10. European Commission. 2016. Education and Training Monitor 2016 – Country Analysis. 11. Eurostat. (2014). Employment rate by highest level of education, age group 25–64, 2014
(%). Accessed November 3, 2016.
http://ec.europa.eu/eurostat/statistics-explained/index.php/File:Employment_rate_by_highest_level_of_education,_age_group_
25%E2%80%9364,_2014_(%25)_YB16.png
12. Faubert, Brenton. 2012. A Literature Review of School Practices to Overcome School Failure. OECD Education Working Papers, No. 68. OECD Publishing. DOI: 10.1787/5k9flcwwv9tk-en
13. Great School Partnerships. Equity. The Glossary of Education Reform. Accessed October 29, 2016. http://edglossary.org/equity/
14. Hanushek, A. Eric., John F. Kain, Jacob M. Markman and Steven G. Rivkin. 2003. “Does Peer Ability Affect Student Achievement?” Journal of Applied Econometrics. 18: 527 – 544. DOI: 10.1002/jae.741
15. Johansone, Ieva. 2010. Achievement Equity by Urbanization in Latvia’s Primary Education – Analysis of PIRLS and TIMSS 2007 Data. TIMMS & PIRLS International Study Center, Boston College.
16. Mann, B. 2014 Equity and Equality Are Not Equal. The Education Trust. Accessed on November 1, 2016. https://edtrust.org/the-equity-line/equity-and-equality-are-not-equal/. 17. McKinsey & Company. 2010. “How the world’s most improved school systems keep
28 18. Ministry of Education and Science of Latvia. 2016. Tertiary Education Funding.
19. Nodarbinātības Valsts Aģentūra. Pārskats par bezdarba situāciju valstī. Rīga, 2015.
20. OECD Publishing. 2012. Equity and Quality in Education: Supporting Disadvantaged Students and Schools, OECD Publishing.
21. OECD Publishing. 2012. How does education affect the economy? in Education at a Glance 2012: Highlights, OECD Publishing, Paris. D
22. OECD Publishing. 2013. PISA 2012 Results: Excellence through Equity (Volume II): Giving Every Student the Chance to Succeed. Defining and Measuring Equity in Education. 23. OECD Publishing. 2013. PISA 2012 Results: What Makes Schools Successful (Volume
IV): Resources, Policies and Practices: Resources, Policies and Practices.
24. OECD Publishing. 2013. PISA 2012. Results in Focus: What 15-year-olds know and what they can do with what they know.
25. OECD Publishing. 2015. PISA 2015. Results in Focus. 26. Social Finance. 2016. Social Impact Bonds. The Early Years.
27. State Department of Educational Quality. 2016. Repetition Rates in Educational Institutions that Provide Comprehensive Basic Education in Latvia. (Otrgadniecība izglītības iestādēs,
kas īsteno vispārējās pamatizglītības programmas Latvijā).
28. Teach for All. http://teachforall.org/en/about/vision-and-mission
29. Teach for America. (012. What Research Says? Accessed on November 1, 2016.
https://www.teachforamerica.org/sites/default/files/what_the_research_says.pdf
30. Trong, Kathleen, L. 2009.” Using PIRLS 2006 to Measure Equity in Reading Achievement Internationally”. Boston College, Lynch School of Education.
31. World Inequality Database on Education. Country Report. Latvia. Accessed on November 29, 2016. http://www.education-inequalities.org/countries/latvia