Probit regression to estimate the physiological
potential of hybrid maize seed
1Sebastião Gazola
2, Carlos Alberto Scapim
3, Alessandro de Lucca e Braccini
3,
Ângela Maria Marcone de Araujo
2, Antonio Teixeira do Amaral Júnior
4*,
Marcelo Vivas
4ABSTRACT – This work was carried out to study the physiological potential of artificially aged seed lots of maize. The specific aim of this study was to fit a simplified equation from Andreoli, Vp=Vi-p.tg(β), and present a methodology using probit regression analysis, given by the equation P(Y=y)=C+(1-C)F(β0 + β1.log(x)). We used seeds from three lots of the maize hybrid OC 705 which were submitted to the accelerated aging test, at the temperature of 43 ºC, every 24 hours. The simplified equation did not provide a good fit to the data, with r2 of at most 92%. Pearson’s Chi-square test and the log-likelihood ratio Chi-square test indicated that probit regression had a good fit to the data, providing estimated values with high accuracy. It was observed that lot three maintained the highest vigor throughout the storage period.
Index terms: Zea mays, vigor, probit regression, accelerated aging.
Regressão probito para estimar o potencial fisiológico
de sementes de milho híbrido
RESUMO - Com o interesse de estudar o potencial fisiológico de lotes de sementes de milho envelhecidas artificialmente, este trabalho teve por objetivo ajustar uma equação simplificada de Andreolli Vp=Vi-p.tg(β) e apresentar uma metodologia utilizando a análise de regressão probito, dada pela equação P(Y=y)=C+(1-C)F(β0 + β1.log(x)). Foram utilizadas sementes de três lotes de milho do híbrido OC 705, submetidas ao teste de envelhecimento acelerado, à temperatura de 43 ºC a cada 24 horas. A equação simplificada não proporcionou um bom ajuste dos dados, com r2 de no máximo 92%. Os testes do Chi-quadrado de Pearson e do Chi-Chi-quadrado da razão de log-verossimilhança indicaram que a regressão probito proporcionou um bom ajuste aos dados, fornecendo valores estimados com boa precisão. Observou-se que o lote três manteve o vigor mais elevado ao longo do período de armazenamento.
Termos para indexação: Zea mays, vigor, regressão probito, envelhecimento acelerado.
Submitted on 09/24/2014. Accepted for publication on 12/04/2014. 2Departamento de Estatística, Universidade Estadual de Maringá, 87020-900- Maringá, PR, Brasil.
3Departamento de Agronomia, Universidade Estadual de Maringá, 87020-900 - Maringá, PR, Brasil.
4Laboratório de Melhoramento Genético Vegetal, Universidade Estadual do Norte
Fluminense Darcy Ribeiro, 28013-602 - Campos dos Goytacazes, RJ, Brasil.
*Corresponding author <amaraljr@pq.cnpq.br>
Introduction
Seed germination and longevity have been the object of studies from long before the 1960s. The reason is that it is very important to know the performance of seed lots over time, allowing greater commercial utilization and lower loss in storage. Since the 1960s, researchers have sought models able to estimate the viability of seed lots (Roberts, 1961a, 1961b; Andreoli, 2004; Marcondes et al., 2007; Andreoli and Andrade, 2007; Silva and Carvalho, 2008; Marcondes et al., 2011). Roberts (1961a and 1961b) described a basic
equation for viability of wheat and rice seeds, including ambient
storage temperature and seed moisture content: Log p =KV –
C1m – C2t; in which p is the mean period of viability; KV, C1, and C2 are specific constants of each lot; m is the seed moisture; and t is temperature. It was later applied to other species.
According to Ellis and Roberts (1980), the seed survival curves draw near positive normal cumulative distribution; these curves (percentage of viability versus time) become a straight line if the percentage values are transformed in probit.
environment: Vp=Vi-p.tg(β) (1), in which Vp is the viability of the lot transformed in probit, Vi is initial germination, and tg(β) is the seed deterioration rate. Marcondes et al. (2007), using the simplified equation from Andreoli, analyzed the changes in the germination percentages and in the deterioration rate of wheat seeds under conventional storage conditions and found that the simplified equation produced results of germination prediction and deterioration rate with satisfactory precision.
Many models used to describe the longevity of seed lots have been based on Probit. For example, Gianinetti and Cohn (2007), Sinicio et al. (2009), Pires et al. (2009), and Probert et al. (2009) studied the germination of seed lots using Probit analysis.
The modeling of responses, which are probabilities or proportions of occurrences, may be carried out by transformation of the observations in probits. These probit values are modeled to estimate the probabilities of occurrences at each level of treatment.
The aim of this study was to determine the adequacy of the simplified equation developed by Andreoli (2004) in percentages of normal seedlings obtained through seeds subjected to the accelerated aging test and present a new approach also using probit regression analysis.
Material and Methods
To study the physiological potential of seed lots, we used data obtained from an experiment carried out in the Seed Laboratory at the Iguatemi Experimental Farm of the State
University of Maringá, Paraná State, Brazil. Seeds from three
lots of the maize hybrid OC 705 harvested in December 2002 were used. The percentages of normal seedlings were obtained through the accelerated aging test at the temperature of 43 ºC in three different time periods, January and July 2003 (storage periods corresponding to zero and six months) and May 2004 (period of 16 months of storage). In each period, we observed the percentage of initial vigor and under stress conditions of random samples of seeds aged at the times of 24, 48, 72, 96, 120, 144, 168, and 192 hours. Nine data sets were obtained, coming from the three lots in the three time periods, which were denoted as L1P1, L1P2, L1P3, L2P1, L2P2, L2P3, L3P1, L3P2, and L3P3, in which the first number refers to the lot and the second number to the time period.
In the literature, there are many probit regression equations, so as to obtain a better fit to the type of data of interest. In this study of normal seedlings percentage, we chose the simplified equation of Andreoli (2004), Vp=Vi-p. tg(β), and the equation defined as:
P(Y=y)=C+(1-C).F( 0 +
1 .log(x))in which 0 and
1 are the parameters to be estimated; F is the function of normal cumulative distribution; x is the explanatory variable or treatment; P is the probability of aresponse Y (y{0,1}); and C is a natural response ratio.
The probit procedure provides estimates for the parameters
0
,
1, and C and calculates the maximum likelihood using a modification of the Newton-Raphson algorithm. The natural response ratio C may also be fixed instead of estimated. The estimation of C may begin either with an initial value, which may be specified, or from the rate observed in a control group.The quality of the fit may be verified by soliciting tests, Pearson’s chi-square test and the likelihood ratio test (LRT), where the degree of freedom is given by (K-1).m – q, in which K is the number of response levels, m is the number of independent variables, and q is the number of parameters estimated in the model (Finney, 1971).
The data set to be used by the probit procedure should contain the treatment variable and the response variable, with the quantities observed for each level of treatment, when the number of subjects subjected to each level of treatment is the same. In the cases in which the number of subjects at each level of treatment varies, in addition to the above variables, it will be necessary to include a variable indicating the number of subjects per level of treatment.
The probit procedure, according to all the procedures of the SAS program (SAS/STAT, 2014), admits several options and declarations, some mandatory and others optional, which provide the estimates of the parameters of the model and the statistics necessary for their evaluation. The syntax of the probit procedure for modeling of experimental data of two response options, in which the responses are the probabilities at each level of treatment, in its simplest form is:
proc probit log10 optc lackfit covout data=XX Plots=(predpplot ippplot lpredplot); model Resp/number=Tempo/corrb covb; output out = new p = p_hat;
run;
proc print data=new; run;
natural C response will be worked with. Natural response is understood as the inherent response, without acquiring treatment effects, i.e., the response observed of an initial value, which may be specified, or of the rate observed in a control group.
The model is fitted as specified in the “model” declaration, and a set of options may be requested together with this declaration. The “output” declaration creates a new data set which, in addition to the input variables, contains the fitted probabilities, the estimators of the parameters of the β0β1x
model and the estimates of its standard error. The “predpplot” declaration creates a graph indicating the relationships among the dependent variable, proportions of observed responses, and the estimated probability values.
Results and Discussion
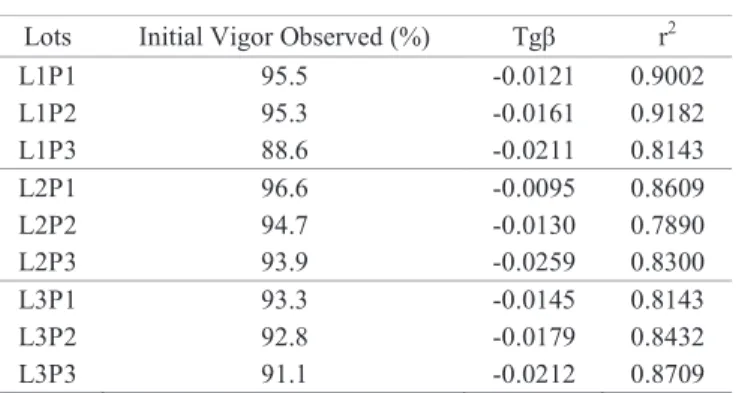
The percentage values of initial vigor of the three lots in the three time periods (L1P1, ..., L3P3) were transformed in probit and fitted to the simplified equation of Andreoli (2004).
The degree of fit measured by the correlation coefficient r2
varied from lot to lot, from 0.789 to 0.918. There was not a high degree of fit since the data on normal seedlings under stress conditions show great variability and, therefore, the probits of the vigor percentages fitted to this equation did not provide sufficient linearization of the data to obtain a better quality fit. The results indicate that the deterioration rate (tgβ) is greater in the third time period (P3), after sixteen months of seed storage, for the three lots evaluated (Table 1).
Table 1. Values in reference to fitting the simplified viability equation Vp=Vi-p.tg(β).
Lots Initial Vigor Observed (%) Tgβ r2
L1P1 95.5 -0.0121 0.9002
L1P2 95.3 -0.0161 0.9182
L1P3 88.6 -0.0211 0.8143
L2P1 96.6 -0.0095 0.8609
L2P2 94.7 -0.0130 0.7890
L2P3 93.9 -0.0259 0.8300
L3P1 93.3 -0.0145 0.8143
L3P2 92.8 -0.0179 0.8432
L3P3 91.1 -0.0212 0.8709
For data on germination of hybrid maize seeds obtained from samples taken throughout the period from 30 to 360 days, Andreoli (2004) obtained an accurate fit by the simplified viability
equation (r2 =0.96). Furthermore, Andreoli and Andrade (2007),
using percentages of maize double hybrid seeds taken at the times
of 0, 30, 60, 90, 120, 240, and 360 days of storage, obtained the r2,
which varied from lot to lot, from 0.97 to 0.99. Using wheat seed lots throughout the period of 300 days, Marcondes et al. (2007)
obtained fits that varied from lot to lot, with r2 from 89% to 96%
and a deterioration rate from 0.0004 to 0.0013.
The values in reference to fitting the probit regression equation, fitted by SAS to the data of vigor percentages of maize seeds under stress (L1P1, ..., L3P3) are shown in Table 2. The percentages of initial vigor estimated by the model are quite near to the values observed.
Table 2. Values in reference to fitting the regression equation P(Y=y) =C+(1-C).F(0+
1.log(x)).Lots Vigor Obs1(%) Fitted parameters Vigor Est2(%) r r2
C 0 1
L1P1 95.5 0.0404 -9.0257 4.2081 95.96 0.9672 0.9355
L1P2 95.3 0.0554 -14.4439 7.0330 94.46 0.9983 0.9966
L1P3 88.6 0.1083 -15.7764 8.0842 89.17 0.9852 0.9707
L2P1 96.6 0.0344 -10.3470 4.6456 96.56 0.9779 0.9563
L2P2 94.7 0.0523 -15.2602 7.1301 94.77 0.9692 0.9334
L2P3 93.9 0.0763 -9.4641 5.1329 92.37 0.9657 0.9327
L3P1 93.3 0.0685 -20.4258 9.7838 93.15 0.9979 0.9957
L3P2 92.8 0.0656 -13.3428 6.5648 93.44 0.9982 0.9964
L3P3 91.1 0.1076 -15.0292 7.4820 89.24 0.9916 0.9832
1Vigor Obs = Vigor observed: 2 Vigor Est = Vigor estimated.
The probit regression model showed a good fit to the data of all the lots, with r2 ranging from 0.9337 to
0.9966. Regulation establishes the minimum percentage of germination of 85% for maize seed sale. It may be observed that up to the germination percentage of 80% of normal
seedlings, the estimated values are very near to the observed values (Figures 1, 2, and 3 and Table 3).
as well as in the second time period, corresponding to six months of storage, indicating that the three lots are
similar in regard to seed vigor up to the storage period of six months.
L1P1
L1P2
L1P3
Figure 1. Values of normal seedlings estimated (Est) and observed (Obs) up to 192 hours through the accelerated aging test in lots L1P1, L1P2, and L1P3 of maize seeds of the hybrid OC 705.
L2P1
L2P2
L2P3
Figure 2. Values of normal seedlings estimated (Est) and observed (Obs) up to 192 hours through the accelerated aging test in lots L2P1, L2P2, and L2P3 of maize seeds of the hybrid OC 705.
Normal seedlings (%)
Normal seedlings (%)
Normal seedlings (%)
Normal seedlings (%)
Normal seedlings (%)
Normal seedlings (%)
Time (hours) Time (hours)
Time (hours)
Time (hours) Time (hours)
Time (hours)
Est Est
Est
Est Est
Est
Obs Obs
Obs
Obs Obs
Obs
100
80
60
40 20 0
100
80
60
40 20 0
100
80
60
40 20 0
100
80
60
40 20 0
100
80
60
40 20 0
100
80
60
40 20 0
0 48 96
144 192 0 24 48 72 96 120 144 168 192
0 24 48 72 96
120 144 168 192
0 24 48 72 96
120 144 168 192 0 24 48 72 96
120 144 168 192
0 24 48 72 96
Figure 3. Values of normal seedlings estimated (Est) and observed (Obs) up to 192 hours through the accelerated aging test in lots L3P1, L3P2, and L3P3 of maize seeds of the hybrid OC 705.
0 20 40 60 80 100 0
24 48 72 96 120 144 168 192
N o rm al s eed ling s ( % ) Est Obs 1 2 0 0 20 40 60 80 100 0
24 48 72 96
120 144 168 192
N o rm al s eed ling s ( % ) Time (hours) Est Obs 0 20 40 60 80 100
0 24 48 72 96
120 144 168 192
N o rm al s eed ling s ( % ) Time (hours) Est Obs
L3P1 L3P2
L3P3
Table 3. Va lues of normal seedlings observed up to the time of 96 hours by the accelerated aging test and estimated by the
probit regression model P(Y=y) =C+(1-C).F(
β
0 +β
1.log(x)).Time (h) Observed Estimated Observed Estimated Observed Estimated
L1P1 L2P1 L3P1
0 95.50 95.96 96.60 96.56 93.30 93.15
24 96.20 95.90 96.20 96.56 95.30 93.15
48 94.60 93.51 96.20 96.02 94.50 93.15
72 86.70 85.10 95.70 92.42 86.40 92.02
96 63.60 72.26 81.00 84.25 81.50 79.09
L1P2 L2P2 L3P2
0 95.30 94.46 94.70 94.77 92.80 93.44
24 94.60 94.46 95.50 94.77 92.80 93.44
48 91.90 94.04 94.20 94.72 93.30 92.45
72 90.20 86.54 93.60 92.70 81.80 81.75
96 61.10 65.36 82.20 82.45 58.70 58.80
L1P3 L2P3 L3P3
0 88.60 89.17 93.90 92.37 91.10 89.24
24 86.30 89.17 89.10 91.57 88.00 89.24
48 89.90 87.88 80.60 73.71 89.60 88.60
72 79.90 69.25 23.30 43.63 72.10 77.76
96 21.40 35.83 41.20 22.04 61.20 51.62
The accelerated aging test is based on the fact that more vigorous seeds produce a greater percentage of normal seedlings in the germination test after being subjected to stress conditions by high temperature and high relative moisture (Krzyzanoswki et al., 1999; Torres, 2004; Malone et al., 2008).
In the P3 time period, at 16 months of seed storage, the percentage of normal seedlings of lot L2 fell to 73.71% already
in the aging period of 48 hours, and 43.63% at 72 hours; i.e., there was a faster reduction in the physiological potential of the seeds. Throughout the storage period, it may be observed that lot L3 showed the lowest loss in vigor because with 72 hours of stress, it obtained an estimated percentage of normal seedlings greater than the other lots, i.e., 77.76%.
For sale of the seed lots, it is expected that throughout the
Normal seedlings (%)
Normal seedlings (%)
Normal seedlings (%)
Time (hours) Time (hours)
Time (hours) Est Est Est Obs Obs Obs 100 80 60 40 20 0 100 80 60 40 20 0 100 80 60 40 20 0
0 24 48 72 96
120 144 168 192 0 24 48 72 96 120 144 168 192
0 24 48 72 96
time of storage they maintain a percentage of normal seedlings above 85% (ABRASEM, 2005). Thus, it may be seen that lot L2 has less vigor because throughout the 16-month storage period, in the P3 time period, it showed a faster reduction in the percentage of normal seedlings throughout the time of stress, i.e., low vigor after storage. For lot L3, the reduction in the percentage of normal seedlings throughout the storage period was less, from the data estimated in time period three, and greater than the other lots.
Thus, from the results shown above, it may be inferred that the three seed lots showed similar vigor up to six months of storage. Nevertheless, for a 16 month storage period, lot three maintained higher vigor and is therefore the most adequate seed lot for sale throughout the period of storage.
Conclusions
The probit regression model used in this study allowed identification of lot three as the most suitable for sale throughout the storage period. It also indicated that after the stress period of 72 hours of accelerated aging, seed vigor decreases rapidly.
The simplified model of Andreoli (2004) used in this study was not adequate for estimating the data of percentage of normal seedlings obtained from maize seeds subjected to the accelerated aging test.
For this type of data, with sigmoid behavior, in which probit transformation does not align the data enough to provide an adequate linear fit, investigation of the application of non-linear models or other statistical techniques is suggested.
Acknowledgments
To the team of the Seed Laboratory of the Iguatemi Experimental Farm of the State University of Maringá for carrying out the experiment and obtaining the data.
References
ABRASEM. Associação Brasileira de Sementes e Mudas. Instrução Normativa Nº 25, de dezesseis de dezembro de 2005. http://www. abrasem.com.br/wp-content/uploads/2012/10/Instru%C3%A7%C3%A3o- Normativa-n%C2%BA-25-de-16-de-dezembro-de-2005-Padr%C3%B5es-Nacionais-de-Sementes.pdf. Accessed on: 10 Feb. 2014.
ANDREOLI, C. Simplificação da equação de viabilidade para predizer a
longevidade de sementes de milho e soja. Pesquisa Agropecuária Brasileira,
v.39, n.9, p.911-917, 2004. http://www.scielo.br/scielo.php?script=sci_ arttext&pid=S0100-204X2004000900011
ANDREOLI, C.; ANDRADE, R.V. Seed longevity chart to predict viability
of corn seed during open storage. Revista Brasileira de Milho e Sorgo,v.6,
n.2, p.247-255, 2007. http://rbms.cnpms.embrapa.br/index.php/ojs/article/ view/229/228.
ELLIS, R.H.; ROBERTS, E.H. Improved equations for the prediction
of seed longevity. Annals of Botany, v.45, n.1, p.13-30, 1980. http://aob.
oxfordjournals.org/content/45/1/13.full
FINNEY, D. J. Probit analysis. 2ª ed. Cambridge: University Press, 1971.
333p.
GIANINETTI, A.; COHN, M.A. Seed dormancy in red rice. XII: popula
-tion-based analysis of dry-afterripening with a hydrotime model. Seed Science
Research, v.17, n.4, p.253-271, 2007. http://journals.cambridge.org/action/
displayAbstract?fromPage=online&aid=1402640&fulltextType=RA&file
-Id=S0960258507841523.
KRZYZANOWSKI, F.C.; VIEIRA, R.D.; FRANÇA-NETO. J.B. Vigor de
sementes: conceitos e testes. Londrina: ABRATES, 1999. 218p.
MALONE, P.F.V.A.; VILLELA, F.A.; MAUCH, C.R. Potencial fisiológico de
sementes de mogango e desempenho das plantas no campo. Revista Brasileira
de Sementes, v.30, n. 2, p.123-129, 2008. http://www.scielo.br/scielo.
php?script=sci_arttext&pid=S0101-31222008000200015& lng=en&nrm=iso
MARCONDES, M.C.; ANDREOLI, C.; MIGLIORANZA, E. Equação
de viabilidade para determinar a longevidade de sementes de trigo sob
condições diferenciadas em armazenamento convencional. Revista
Brasileira de Sementes, v.29, n.3, p.182-187, 2007. http://www.scielo.br/
scielo.php?pid=S0101-31222007000300025&script=sci_ arttext
MARCONDES, M.C.; ANDREOLI, C.; MIGLIORANZA, E. Viability equation to determine the longevity of fungicide-treated seeds of wheat
stored in a conventional warehouse. Acta Scientiarum. Agronomy, v.33,
n.3, p.539-544, 2011.
http://www.scielo.br/scielo.php?pid=S1807-86212011000300023&script=sci_arttext
PIRES, L.A.; CARDOSO, V.J.M.; JOLY, C.A.; RODRIGUES, R.R. Germinação
de Ternstroemia brasiliensis Cambess. (pentaphylacaceae) de floresta de
restinga. Acta Botanica Brasileira, v.23, n.1, p.57-66, 2009. http://www.scielo.
br/scielo.php?pid=S0102-33062009000100007& script=sci_arttext
PROBERT, R.J.; DAWS, M.I.; HAY, F.R. Ecological correlates of ex situ seed
longevity: a comparative study on 195 species. Annals of Botany, v.104, n.1,
p.57-69, 2009. http://aob.oxfordjournals.org/content/104/1/57.full.pdf+html
ROBERTS, E.H. Viability of cereal seed for brief and extended periods.
Annals of Botany, v.25, n.3, p.373-380,1961a. http://aob.oxfordjournals.org/
content/25/3/373.full
ROBERTS, E.H. The viability of rice seed in relation to temperature, moisture
content, and gaseous environment. Annals of Botany, v.25, n.3, p.381-390,
1961b. http://aob.oxfordjournals.org/content/25/3/381
SAS/STAT. 13.2 User’s Guide Procedures: The PROBIT Procedure. http:// support.sas.com/documentation/onlinedoc/stat/132/probit.pdf. Accessed on: 12 Nov. 2014.
SILVA, B.M.S.; CARVALHO, N.M. Efeitos do estresse hídrico sobre o
desempenho germinativo da semente de faveira (Clitoria fairchildiana
R.A. Howard. – Fabaceae) de diferentes tamanhos. Revista Brasileira de
Sementes, v.30, n.1, p.55-65, 2008. http://www.scielo.br/scielo.php?script=
SINICIO, R.; BHERING, M.C.; VIDIGAL, D.S.; DIAS, D.C.F.S. Equacionamento da qualidade inicial de sementes de milho e soja para
aplicação no modelo de probit. Revista Brasileira de Sementes, v.31,
n.1, p.122-130, 2009. http://www.scielo.br/scielo.php?script =sci_ arttext&pid=S0101-31222009000100014
TORRES, S.B. Teste de envelhecimento acelerado em sementes de
erva-doce. Revista Brasileira de Sementes, v.26, n.2, p.20-24, 2004. http://www.