art. 4, e180005, 2018
http://dx.doi.org/10.1590/1807-7692bar2018180005
Perception of Value Co-creation Actions in Agricultural
Cooperatives
Luana Zanetti Trindade Ferraz1 Amaury José Rezende2 João Paulo Resende de Lima3 Emanuela Todeva4
Faculdade de Negócios Metropolitana, Ribeirão Preto, SP, Brazil1 Universidade de São Paulo, Faculdade de Economia, Administração e Contabilidade, Ribeirão Preto, SP, Brazil2 Universidade de São Paulo, Faculdade de Economia, Administração e Contabilidade, São Paulo, SP, Brazil3 Saint Mary’s University, Twickenham, United Kingdom4
Abstract
This research evaluates the perception of members regarding the value-creation actions offered by a cooperative and whether the characteristics of the member and cooperative affected this perception. A model to measure the perception of the value co-creation activities provided by the cooperative and member characteristics was created. The adopted methodology was a questionnaire and the Partial Least Square method. Value co-creation, professionalization of management, satisfaction and loyalty, and long-term time orientation of the member were measured based on the member’s perception. The results demonstrate a significant association between satisfaction and loyalty and perception of value co-creation and a positive association between the long-term time horizon and the perception of value co-creation actions. In other words, perception of the benefits generated by the actions of the cooperative can be influenced by time orientation and level of satisfaction and loyalty. The main contribution is the creation of an instrument that measures the level of perception of value co-creation actions.
Introduction
Within cooperatives, the dynamics of production and negotiation relations between the cooperative and its members can change. The traditional relations were solely based on meetings between rural producers who sought to optimize their financial and economic returns, inherent to their transactions, by obtaining better prices with the sale of larger lots and greater bargaining power when purchasing inputs and equipment, leading to lower financial costs (Pinho, 2004; Ventura, Fontes, & Soares, 2009).
In addition to the traditional direct gains resulting from increased revenues, production and productivity, and reduced costs and expenses the indirect gain of cooperatives comes from the activities offered to their members. These activities include technical and professional assistance, rural extension, and actions resulting from services provided for the common benefit of the cooperative, with a primary focus on business (Anceles, 2014).
The cooperative offers its members financial gains through the negotiation of agricultural products, as well as indirect non-financial gains and support to rural producers through the services provided. The relationship between cooperatives and their members is not limited to these operations since these organizations have dedicated efforts to implementing new processes and activities that help create more value for their members (Buainain, Alves, Silveira, & Navarro, 2014). These efforts transcend traditional concepts of value creation, as they seek to create additional value through the transfer of technologies, both in the technical processes of production (how to produce) and in the quality of products (what to produce) in conjunction with customer needs (Grönroos, 2011).
The additional value of improving relations between the parties in a cooperative is achieved by allowing members to participate in the processes and actions of the organization, by increasing revenue for the organization, or by enhancing client satisfaction (Porter & Kramer, 2011). This process is called value co-creation (Grönroos, 2011; Prahalad & Ramaswamy, 2004a, 2004b). To thrive in this new environment, organizations must look for new ways to create value for shareholders who are less
growth-dependent and more focused on the relationship between business stakeholders (Ukon et al.,
2013). The value co-creation process can be favored in a cooperative because the member is both the owner and consumer of the organization and may have greater participation in its activities due to the distribution of property rights and governance mechanisms of a cooperative, and, therefore, receive more benefits from this transaction.
Cooperatives optimize their processes and products by improving relations with members for many reasons. First, these organizations must ensure their economic survival and increase their
competitiveness in a dynamic environment by meeting the needs of members (Ventura et al., 2009).
Moreover, they must guarantee member satisfaction and loyalty in economic exchange relations (purchases, production, and sales) (Anceles, 2014; Bhuyan, 2007; Serigati, 2008). Secondly, they must maintain staff members, considering the relevance of loyalty to cooperatives (Bhuyan, 2007; Bialoskorski, 1998; Hansmann, 1996; Pinho, 2004; Serigati, 2008). Thirdly, cooperatives need to offer portfolios and projects with a medium and long-term horizon in order to impact decisions and the time orientation of members, especially considering the many interests that affect the degree of loyalty (Porter & Kramer, 2011). Lastly, cooperatives must increase the professionalism of their management structure (managers, board, risk committees, and audit committees, thus ensuring member security and satisfaction in relation to the decisions made and contributing to the survival of the cooperatives (Hakelius & Hanssonb, 2007).
In light of these reasons, the following question was investigated: Is the value perception of cooperative members regarding value co-creation actions impacted by the characteristics of these members and the cooperative? The following three objectives were proposed (a) to evaluate the
members’ perception regarding the value co-creation actions offered by the cooperative and whether the
relationship between the perception of value co-creation actions developed by the cooperative and the characteristics of its members.
Jaakkola and Hakanen (2013) encourage the development of methods to identify value co-creation and make it visible to clients and managers as an instrument of control, strategy, and management. In the present analysis, the perception of members is used since it allows a quantitative measurement of value co-creation. Moreover, some results of value co-creation processes generate non-measurable benefits, and the non-measurable results of value creation cannot be separated from value creation (Prahalad & Ramaswamy, 2004a).
This research is divided into six parts. After the introduction, a bibliographic review presents the concepts and theories used, followed by a proposition of the model, methodology of the research, and analysis of the results. Finally, the final considerations and research references are presented.
Literature Review
Cooperatives and their concepts
The International Co-operative Alliance (ICA, n.d.) defines that cooperatives are organizations owned and managed by and for their members. Members have equal rights in the activities of the organization and have a share in the results of the activities. In Brazil, cooperatives have a relevant economic importance. According to the Organization of Brazilian Cooperatives (OCB, n.d.a), the number of cooperatives is approximately 10.4 million and they directly generate 298,182 jobs. There are 6,587 cooperatives in Brazil, mostly in the sectors of consumers, agriculture, education, transport, special, production, tourism and leisure, medical, infrastructure, housing, mining, education, and credit.
Despite the favorable numbers of the cooperative sector, cooperative organizations face some adversities related to horizon, incentives, portfolio, control, and influence problems, and some issues arising from increased market competition. These problems of cooperative society, as well as capital society, demand strategies and resources to ensure survival and business expansion. The biggest challenge for cooperatives is to overcome their intrinsic inability to evolve and change from organizations with originally defensive strategies to more aggressive organizations capable of competing with capital companies.
Cooperatives are established because their members find advantages in the connection between some investments. By participating in a hybrid organization, the parties accept mutual dependency and, therefore, reduce the benefits of control the hierarchy could provide (Anderson, 1985; Menard, 2004). In contrast, the advantages include economies of specialization, economies of scale, economies of scope, and savings in transaction costs (Menard, 2004, 2013).
One of the objectives of cooperatives is to provide economic benefits to members by saving on common expenses and making results more efficient. Cooperatives have greater bargaining power in the market, which increases the economic and financial capacity of a cooperative as a single organization. This benefit also eliminates intermediaries, thus reducing the cost of purchasing consumer products (Fulton, 1999; Pinho, 2004) and ensuring more efficient production quality control (Polônio, 1999).
In this environment, where the relationship between the related parties is fundamental for the competitive advantage of the organization and to overcome market barriers, value creation emerges as a strategy that adds value by strengthening the relationship between suppliers, clients, and cooperatives.
2004a). The strategy can stimulates actions with medium- and long-term benefits and allow clients to perceive the benefits generated by the organization. Moreover, it can encourage client participation in actions that meet their own needs and encourage groups to create benefits for themselves and for the organization (Dervojeda, Nagtegaal, Lengton, & Rouwmaat, 2014; Frow, Nenonen, Payne, & Storbacka, 2015; Grönroos, 2011; Prahalad & Ramaswamy, 2004a). Value co-creation dynamically offers the innovation and creation of products, services, and processes that generate direct and indirect results for the clients and organizations, thus responding to needs (Grönroos, 2011; Prahalad & Ramaswamy, 2004a).
To adhere to value co-creation, organizations must review their strategies and structure and adapt them to the new competitive reality. In many cases, adaptations must be accompanied by new investments and alternative sources of capital (Gimenes & Gimenes, 2008). Continued investments in value creation can be a strategy for the cooperative to grow, generating benefits for members and the organization itself.
Value co-creation in agricultural cooperatives
Value co-creation occurs in the personalized form of the service, i.e., in the unique experiences
for the client. Value is co-created with clients, whenever customers are able to customize their
experiences, using an organization’s product-service in a way that is best suited to the value of their
investment and in the form of new knowledge with greater revenue, profitability, added value, and loyalty. It is a type of economic strategy that addresses the generation and continuous and mutual realization of value among clients and companies (Prahalad & Ramaswamy, 2004a). Thus, the concept of value co-creation has been used when a study intends to investigate client participation in the productive process of organizations. In other words, the concept is related to the joint creation of value by the client and the organization (Payne, Storbacka, & Frow, 2008; Prahalad & Ramaswamy, 2004a).
Ulaga and Eggert (2006) proposed that, in order to create value, organizations must migrate from a product-centered view (the dominant logic of goods) to the vision of personalized experiences for each client. The focus for creating additional value that is so sought after by managers becomes the interaction and enhancement of the cooperative and member relationship. Among the existing actions, value co-creation represents a competitive advantage with client participation that has been the subject of recent research (Galvagno & Dalli, 2014; Prahalad & Ramaswamy, 2004a).
Therefore, value co-creation is the high-quality interactions that allow customers (members) to co-create unique value experiences with the organization (cooperative) and the key to unlocking new sources of competitive advantage (Grönroos, 2011). According to Vega-Vazquez, Revilla-Camacho and Cossío-Silva (2013), value creation represents the creation of joint value between the supplier or client and the organization and requires the construction of experiences and the resolution of problems in a combined effort between the parties in a business relationship. Based on this concept, the main business
skills occur at the point of interaction between clients and companies, and the consumer is the value
co-creator in all cases (Yi & Gong, 2013). Consequently, the client’s role in this process is centered on
performing a series of activities to achieve a particular goal (Payne et al., 2008).
Value co-creation provides unique experiences for each co-worker, representing much more than personalizing products and services through a narrow range of options. It is about creating extra value to a service the cooperative offers its members. Examples include meeting the needs of a group of members, innovations and improvements in products and production processes, and addressing the interests and limitations of members.
their member. Co-creation implies the creation of joint value between the cooperative and its member with a high level of participation of the cooperative in the customization.
This new way of viewing the relationship reveals that the congruence between social progress and productivity in the value chain is much greater than in traditional processes. Within the scope of
cooperatives, an example of joint value creation can be found in the case of Nespresso, one of Nestlé’s
divisions, which has grown 30% annually since 2000. Moreover, Nespresso works with coffee cooperatives to obtain quality products, thus enabling associates (farmers) and cooperatives to obtain the requested product (Porter & Kramer, 2011).
Although Nespresso has expanded the premium coffee market, obtaining a reliable supply of specialty coffees is extremely challenging. Most coffee is cultivated by small farmers in poor rural areas of Africa and Latin America. Furthermore, coffee cultivation in these areas is linked to a cycle of low productivity, poor quality, and environmental degradation that limits the volume of production. To address these issues, Nespresso redesigned its architecture and worked intensively with its producers and suppliers, implementing agricultural practices, securing bank loans, and sharing information on plant, pesticide, and fertilizer management (Porter & Krammer, 2011).
Nespresso established local facilities to measure the quality of coffee at the point of purchase in coffee cooperatives, which allowed it to pay a premium for the best grains directly to producer members and thereby improve their incentives. In addition to obtaining a higher yield per hectare and higher quality of production, the yields for both parties increased and the environmental impact of agricultural activities was reduced.
Based on this example, the concept of value co-creation can be defined as operational policies and practices that improve the competitiveness of an organization while advancing the economic and social conditions of the communities in which it operates. Creating value together or value co-creation focuses on identifying and expanding the connections between social and economic progress. Therefore, the concept is based on the premise that both should be treated using the principles of value (Grönroos, 2011; Porter & Kramer, 2011; Prahalad & Ramaswamy, 2004a).
Variables that influence value co-creation
It is believed that some factors influence value co-creation and, consequently, the perception of members regarding the actions of value co-creation, including the practices of corporate governance. The open and clear dialogue between organizations and members, provided by corporate governance practices, encourages, creates, and assists in maintaining the loyalty and trust of consumers. This process is part of the traditional value co-creation model that involves elements such as dialogue, access, risk-benefit, and transparency (DART) proposed by Prahalad and Ramaswamy (2004a).
These elements are essential for the construction of value co-creation actions, especially dialogue, transparency, and access. Thus, an organization with participatory and professional management that aims to separate ownership and control makes its actions transparent. This transparency favors communication and member access to information and foments their participation in the actions of value co-creation. It also influences member perception of the value added obtained in the customer and organization relationship (Cook, 1994; Prahalad & Ramaswamy, 2004a; Serigati, 2008).
The perception of the benefits and results of value co-creation can be intensified by professionalizing the management of cooperatives and reducing agency conflicts through transparency and the formal control of the board of directors, which represents the interests of the members (Prahalad & Ramaswamy, 2004a). In addition, trust between members and cooperatives tends to increase
(Bachmann, 2001; Serigati, 2008; Ventura et al., 2009). It is believed that the member’s perception of
the results of value co-creation can be influenced by the level of professionalization of management.
Several studies have also identified that the commitment (loyalty) of members is associated with
(Staatz, 1987), and with the cooperative’s ability to differentiate its members from non-members (Galvagno, 1999). According to Bhuyan (2007), the commitment of members is greater when they are satisfied with the performance of cooperative managers and satisfaction is required for increased trust, achieved through transparency in relationships.
Member loyalty is related to the performance and competitiveness of a cooperative and the value given to its stakeholders. Thus, value co-creation as a competitive strategy may represent an increase in the results and benefits perceived by members. To encourage loyalty and reciprocity is to ensure the involvement of members in the cooperative, with effective participation that adds value to the productive chain. Therefore, it is necessary to increase new products and services that can give the cooperative differentiated incentives and direct and indirect benefits above its competitors (Anceles, 2014;
Bialoskorski & Davis, 2010; Ventura et al., 2009).
From the customer perspective, there is a significant relationship between value co-creation and loyalty. Several studies focus on loyalty antecedents, among which satisfaction, perceived value, and quality of services offered to clients are listed, where value co-creation accounts for 34.2% of the loyalty attitude variance, according to Cossío-Silva, Revilla-Camacho, Vega-Vázquez and Palacios-Florencio (2016). Dick and Basu (1994) also state that loyalty is one of the antecedents of value co-creation. It is hoped that the more loyal members (who negotiate more with the cooperative) and satisfied members will more readily perceive value co-creation actions. The perception of benefit may be related to the
member’s time orientation, that is, the time horizon in which members expect to receive a return for
investments or sacrifices made by them and the organization.
Time orientation can be understood as a time gap between the moment efforts are allocated to different tasks and the moment in which the rewards are received, resulting from performance in the tasks (Van Rinsum, 2006). This approach can also be applied to measure member effort and the benefits they receive. Aguiar and Frezatti (2014) identified that non-financial performance measures are related
to long-term orientation. Contrary to the authors’ expectations, non-financial performance measures for
incentive purposes are negatively associated with time orientation. They highlight the importance of understanding how non-financial performance measures are associated with time orientation.
In this sense, the perception of value co-creation actions can be influenced by the effects of long-term time orientation, since the results of product and process improvement and innovation may be due to actions with a long-term focus and non-financial indicators (Prahalad & Ramswamy, 2004b).
Model, Variables, and Proxies
In order to analyze the perception of value co-creation, the following dimensions were considered:
value co-creation between member and cooperative, level of satisfaction and loyalty, member’s time
orientation, and degree of management professionalization, as detailed in the table below. A first-and
second-order model was used to identify and analyze the member’s perception of value co-creation. The
perception index of the value co-creation actions is a latent variable (construct) that was measured from 3 dimensions using 35 questions, which comprise a set of actions and characteristics. According to Chin, Marcolin and Newsted (2003), the latent variable is used to represent a phenomenon that cannot be measured directly. The perception index of value co-creation actions comprises the first-order construct while the dimensions that make up the model are second-order (Chin, Marcolin, & Newsted, 2003). The respondents for the proposed model were the members of a cooperative. The adopted dimensions were value co-creation actions, professionalization of cooperative management, time orientation of the members, and level of satisfaction, and loyalty.
measures. The definitions and variables considered in the proposed structural model resulted in a set of hypotheses and expected relationships (signals) between the variables.
In the proposed model for measuring the perceptions of value co-creation actions (Percpcoo), the aim was to measure the degree of adherence of second-order dimensions, namely (ProfGestão) professionalization of cooperative management, (SatFid) satisfaction and loyalty, and (OTC) time orientation of the members, as shown below. Finally, as the present study is based on a descriptive and exploratory research design, the variables were related not to the connotation of obtaining cause and effect, but to the association between the constructs (Kerlinger, 1980).
Methodology
The aim of this study is provide an in-depth understanding of the members’ perception of value
co-creating actions offered by a cooperative and reveal the dynamic and complex interconnections between the actors (cooperative and members). The present study also seeks to identify the perception of the members, through an empirical investigation, in a context of agricultural cooperatives since it is not possible to quantitatively measure the additional value generated by these co-creation actions; however, it is possible to identify the perception of members regarding their existence in relation to produced and perceived results.
From the empirical perspective, a survey was carried out with the cooperative to verify adherence to the proposed model. Among the advantages of survey studies, as in the case of this research that deals with perception and the time orientation of members, in addition to satisfaction and loyalty, is the possibility of testing theories and understanding behavior at different levels of analysis in an individual organizational subunit (Hair, Ringle, & Sarstedt, 2013; Van Der Stede, Young, & Chen, 2006).
We analyzed the results using Partial Least Square (PLS), which is an estimation technique for the Structural Equations Model that combines the econometric perspective with a focus on the prediction and modeling of latent variables, resulting in greater flexibility in theoretical modeling. We consider PLS the most appropriate technique in comparison to other techniques when there are no assumptions regarding the distribution of data. It is also a non-parametric technique when there is a reasonable number of constructs and predictors and the required sample size is not so high (Chin, 2003).
To use PLS, the minimum sample size must be estimated. In the research, G * Power software was used to evaluate the construct or latent variable that receives the largest number of arrows or has the largest number of predictors. The calculation must precede data collection and for PLS it decides the minimum sample to be used.
The minimum sample calculated for this research should be 74 cases. The parameters are number of predictor variables (professionalization of management, satisfaction and loyalty, and time orientation
of the member), effect size (mean effect 0.15), significance level α = 0.05, power of the sample 1-β = 0.95 (Cohen, 1988). As suggested by Ringle, Silva and Bido (2014), twice as many responses can be used to have a more consistent structural equation model (SEM). In the present study, 204 valid answers were used to present a robust model.
As we worked with linear correlations and regressions, to validate model it was necessary to
evaluate whether these relations are significant when presenting p ≤ 0.05. This is because the null
hypothesis (Ho) is established as r = 0 for correlation cases and with Ho: T = 0 (path coefficient = 0) for regression cases. If p > 0.05, Ho is accepted and the inclusion of VLs or VOs in the MEE should be
rethought. That is, the software calculates Student’s t-tests between the original data values and those
obtained by the resampling technique for each VO-VL correlation ratio and for each VL-VL ratio. SmartPLS displays t-test values and not p-values. It should be interpreted that, for high degrees of
freedom, values above 1.96 correspond to p-values ≤ 0.05 (between -1.96 and +1.96 corresponds to the
The Student’s t-test evaluates whether the coefficient of the independent variables is equal to or different from zero. The significance of the coefficients was evaluated using the bootstrapping procedure.
The questionnaire was elaborated based on theories of value co-creation, distribution of property rights in cooperatives, and characteristics related to professional management, level of satisfaction and loyalty, and type of orientation of the members.
The answers to the questions were analyzed using SmartPLS software and the proposed model was tested using the Partial Least Square (PLS) method. A Likert scale from 1 to 10 was used in the questionnaire, in which 1 represents the lowest score and 10 represents the highest score in the intensity of perception.
A complementary sensitivity analysis was also carried out to verify if the characteristics of the members make the group homogeneous or heterogeneous in multi-group analyses (time of association in the cooperative, schooling, age, ownership size in hectares, and indebtedness). The variables used in the multi-group analysis (time of association in the cooperative, schooling, age, property size in hectares and indebtedness).
Multi-group analysis (MGA) tests whether the estimates of specific group parameters in the
predefined data groups differ significantly significantly (Hair et al., 2013). In this case, it searches for a
p-value <0.05 to show heterogeneity in the groups presented in the research.
In all, 204 questionnaires were used in the analysis. The questionnaires containing more than 10% of items without answers (missing values) were excluded from the analysis. We also excluded the results in which the same replicates were repeated in more than 90% of the questions.
Only one branch of cooperativism was chosen to conduct the research. The agricultural sector comprises rural, producer, and fishing cooperatives. The means of production belong to the associates, who work together and benefit from the gains of joint association. These cooperatives normally cover the entire production chain, from preparing the land to the raw material and sale of the final product (OCB, n.d.b). Moreover, they represent more than 40% of agribusiness GDP (OCB, 2013). Only one cooperative was chosen for this study because it is one of the largest coffee cooperatives in Brazil and in the world. The cooperative also participates in the Nespresso Program which, according to Porter and Kramer (2011), is a clear act of value co-creation between cooperatives and members.
This coffee cooperative is based in southern Minas Gerais state and has been active in this region since 1932, with more than 80 years in the market. Currently, it has approximately 12,000 members, of which 84% are small producers who run family farms. The cooperative has more than 2,000 employees and receives coffee produced from more than 200 cities in its coverage area. The vast majority of cooperatives deliver coffee production, make purchases at cooperative stores, and use the technical assistance services. The cooperative accepted to participate in the research. Moreover, one of its characteristics was the distribution of surplus and it managed to distribute value that can be co-created for its members.
Results
Analysis: descriptive statistics
The structural research model is presented with the necessary corrections to obtain the evaluation
model. According to Ringle et al. (2014), the average variance extracted (AVE) is the average squared
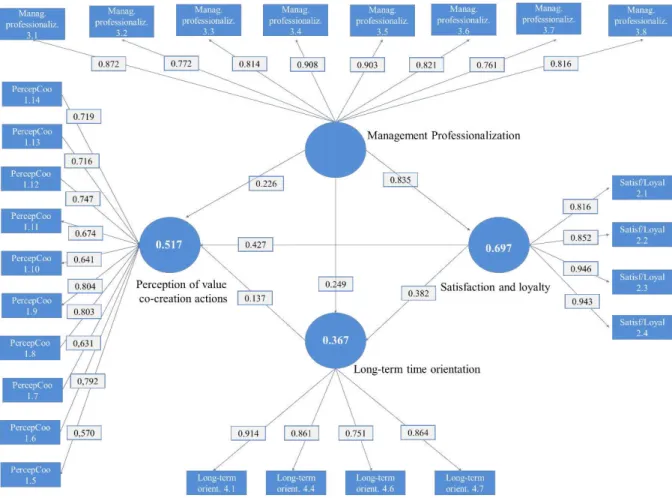
According to the structural model in Figure 1, the dimension of long-term time orientation of the member represents R² 0.367 and a positive effect; satisfactions and loyalty have a positive effect and R² 0.697; perception of value co-creation actions has R² 0.517; professionalization of management did not present significance. Therefore, the perception of value co-creation actions perceived by the members evaluated in the three dimensions presented R² and significant coefficients for two of the dimensions.
Figure 1. Structural Model of Perception of Value Co-creation Actions (MEE) Source: research data.
Table 1 shows that the values of Cronbach’s Alpha, composite reliability, and AVE are all higher
Table 1
Adjustment Quality Values of the MEE Model after Eliminating Variables with Lower Factor Loadings
Cronbach’s Alpha
Composite reliability
Average Variance Extracted (AVE)
Long-term time orientation of the
member (OTC) 0.871 0.912 0.722
Perception of value co-creation
(Percpcoo) 0.897 0.911 0.510
Management professionalization
(ProfGestão) 0.937 0.948 0.697
Satisfaction Loyalty (SatFid) 0.912 0.939 0.794
Cutting Pattern > 0.7 > 0.7 > 0.5
Note. Source: research data.
Table 2
Pearson Correlation and Descriptive Statistics for Latent Variables (VL) and Square Roots of AVE Values on the Main Diagonal (in Blue)
Fornell and Larcker criteria
Long-term time orientation
Perception of value co-creation
Management professionalization
Satisfaction Loyalty
Long-term time orientation 0.861
Perception of value
co-creation 0.564 0.729
Management
professionalization 0.575 0.660 0.848
Satisfaction and loyalty 0.618 0.739 0.881 0.897
Note. Source: research data.
All validated values had a great effect because they were higher than 20% (Ringle, Silva, & Bido, 2014). The results show a significant positive relationship between the level of perception of value co-creation actions and the other studied variables, except for management professionalization, but this has a moderating effect on the other constructs.
Considering the exploratory aspect of the research and its limiting factors, the proposed structural
model presented an explanatory power of R² 0.367 for the member’s long-term time orientation, R²
0.517 for perception of value co-creation actions, and R² 0.697 for the level of satisfaction and loyalty.
In order to interpret these values, it should be considered that member respondents who are satisfied with and loyal to the cooperative have a greater perception of value co-creation actions. Moreover, a long-term time orientation positively influences this perception.
Since linear correlations and regressions were used in the present research, it was necessary to
evaluate whether these relations are significant when presenting p ≤ 0.05, because the null hypothesis
(Ho) for the correlation cases is established as r = 0 and established with Ho: T = 0 (path coefficient = 0) for the regression cases. If p > 0.05, Ho is accepted and the inclusion of VLs or VOs in the MEE
should be rethought. That is, the software calculates Student’s t-tests between the original data values
ratio. SmartPLS displays t-test values and not p-values. It should be interpreted that, for high degrees of
freedom, values above 1.96 correspond to p-values ≤ 0.05. To test the significance of the relationships
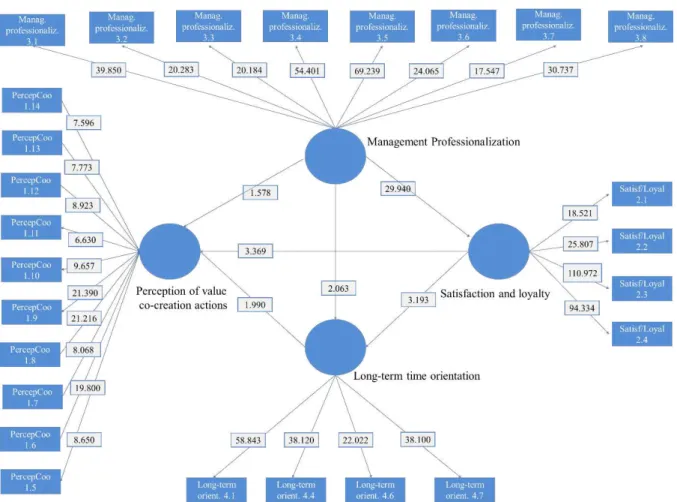
emphasized here, the bootstrapping module was used, as shown in Figure 2.
Figure 2. Structural Model (MEE) with Student’s t-test Values Obtained through the Bootstrapping Module of SmartPLS 3
Source: research data.
The Student’s t-test evaluates whether the coefficient of the independent variables is equal to or
different from zero. The significance of the coefficients was evaluated using the bootstrapping procedure, which represents a non-parametric approach to estimate the accuracy of the model. Figure 2 indicates the regression coefficient and the T statistic, which aims to identify if the values of the tt-test (values close to the arrows joining the variables or constructs) should be greater than 1.96 for the
coefficients to be considered different from zero (Ringle et al., 2014). For this alternative, 500 reaming
variables were used. Figure 2 presents the structural model for latent variables. It is possible to notice that two of the three independent variables explain their respective predictors in a statistically significant way.
In the case of the latent variable management professionalization, the main predictor explained by it was satisfactions and loyalty (t = 29.940), which reflects the use of this measure for the purpose of perceiving value co-creation actions. Hypothesis H1b discusses the reasons for cooperatives to improve
management, since the professionalization of management improves the image of the cooperative
vis-à-vis stakeholders, increasing the reliability of the organization. By professionalizing cooperative management and, consequently, meeting the needs of the members (Bhuyan, 2007; Pinho, 2004;
Serigati, 2008; Ventura et al., 2009), economic survival in this dynamic environment is increased to
maintain and increase competitiveness (Pinho, 2004; Serigati, 2008; Ventura et al., 2009).
that management professionalization would influence the long-term orientation of the member (Cook, 1994), and this hypothesis was validated. But the same does occur with H1a, in which management professionalization in relation to the perception of value co-creation actions was t = 1.578; therefore, H1a was not validated.
In the case of the variable latent long-term orientation of the member, the predictor explained by it presented a t = 1.990, which reflects the use of this measure in the perception of value co-creation actions. This hypothesis H3a represents that the long-term orientation of the member influences perception of the value co-creation actions. Van Der Stede (2000) and Merchant (1990) define time orientation (TO) as the time horizon between effort allocation and the moment remuneration is received
within which it seeks to optimize financial incentives, i.e., TO affects the perception of return. Kaplan
and Norton (1996) argue that non-financial performance measures (such as the perception of value-co-creating actions) are perceived as more timely to provide follow-up information on efforts that have affected term outcomes than financial indicators, and these measures could potentially induce long-term time orientation.
In a cooperative context, the short-term orientation of the member may be detrimental to the organization since there are no incentives to create medium- and long-term results (Cook, 1995; Serigati, 2008). Grönroos (2011) and Prahalad and Ramaswamy (2004a) argue that value co-creation can stimulate actions that bring medium- and long-term benefits, making clients realize the benefits generated by the organization, perceived over time. That is, this hypothesis was validated by the model, agreeing with the literature.
Finally, the latent satisfaction and loyalty variable explains the predictor perception of value co-creation actions with a t = 3.369 and also explains the long-term orientation of the member with t = 3.193. To understand the validation of this H2a hypothesis, studies show evidence that a greater participation of the client in the organization tends to generate higher levels of satisfaction (Chan, Yin,
& Lam, 2010). The effect of the member’s participation in the activities of the cooperative with
satisfaction become evident when a member can create value through their participation (Serigati, 2008). One of the most important factors for the loyalty and satisfaction of cooperative members is related to the performance and competitiveness of the cooperative and the value that is given to its stakeholders;
in other words, the cooperative’s competitiveness strategy vis-à-vis other organizations (Bialoskorski,
1998; Bialoskorski & Davis, 2010; Cook, 1995).
Chan, Yin and Lam (2010), among others, found significant positive relationships between the
client’s participation in the process and their satisfaction with the service provided. Similarly,
Cossío-Silva et al. (2016) also discuss that value co-creation is closely linked to the satisfaction and loyalty of
the clients who participate in these actions; the more customers co-value, the more satisfied and loyal they become to the brand that offers this benefit. The H2b hypothesis has also been validated because, according to the literature, satisfaction (as a measure of non-financial performance) with the organization encourages the client to have a longer-term focus (Hemmer, 1996).
As shown in Figure 2, the hypotheses H1b, H2a and H2b, H3a and H3b can be accepted since the signals indicate a favorable effect for the proposed coefficients.
Table 3
Evaluation of the Structural Model of the Latent Variables: Regression Coefficient and the T Statistic
2nd order variable= >1st order variable
Hypo
thesis Results
Original Sample (O) Sample Mean (M) Standard Deviation (STDEV) T Statistics (|O/STDEV|) p- values Management professionalization = > Perception of value co-creation actions
H1a Not
confirmed 0.226 0.255 0.143 1.578 0.115
Management professionalization =
> Satisfaction and loyalty
H1b Confirmed 0.835 0.836 0.028 29.940 0.000
Satisfaction and loyalty => Perception of value co-creation
actions
H2a Confirmed 0.427 0.406 0.127 3.369 0.001
Satisfaction and loyalty => Long-term time
orientation of the member
H2b Confirmed 0.382 0.382 0.120 3.193 0.001
Long-term time orientation of the
member = > Perception of value
co-creation actions
H3a Confirmed 0.137 0.133 0.069 1.990 0.047
Management professionalization => Long-term time orientation of the
member
H3b Confirmed 0.249 0.253 0.121 2.063 0.040
Note. Source: research data.
Next, the values of two other adjustment quality indicators of the model were evaluated, namely Relevance or Predictive Validity (Q²). According to the literature, the values of Q² should be greater
than 0 (Hair,Hult, Ringle, & Sarstedt, 2014; Ringle et al., 2014). The model test results showed the
predictors have a value of 0.259 for long-term time orientation, 0.235 for perception of value creation actions, and 0.574 for satisfaction and loyalty.
Discussion of the results
The results of the model presented above show that the satisfaction and loyalty variable had the greatest weight in the perception of value co-creation actions, followed by the long-term orientation of the member. Consequently, satisfaction and loyalty have a greater weight in the perception of value co-creation, corroborating the theory on the theme. Satisfied clients perceive more value and are more loyal because they perceive advantages when negotiating with the organization.
over time. On the other hand, the member with a short- and medium-term time orientation had a lesser perception of the value.
The variable management professionalization may have an indirect effect on the perception of value co-creation actions and it can below impact, due to the results of the values found. Therefore, this variable exerts a greater direct weight on member satisfaction and loyalty, in order to influence the perception of value. When members are more satisfied and loyal, they may be more likely to perceive management professionalization actions. Moreover, the level of management professionalization
influences the long-term time orientation of the member, i.e., a more transparent and efficient
management influences the time horizon of the members’ return.
The member’s perception of value co-creation is more affected by the characteristics of interdependence (between cooperative and member) such as satisfaction and loyalty and long-term time orientation of the member than by the management professionalization characteristics of the cooperative. These characteristics of the cooperative have an indirect effect on the satisfaction and loyalty model.
Consequently, the investments of the cooperative should focus on increasing member satisfaction
and loyalty, thus increasing the members’ time horizon and the investments made in relation to risk and
return.Members are more sensitive to investments related to remuneration through surplus and to the
price paid for the product delivered in the cooperative. But it was also observed that members are sensitive to technical assistance investments and other investments made in the initial stages of production processes, such as input prices, prices of agricultural machinery, and training.
These variables influence the members’ perception of value co-creation offered by the
cooperative. These are the drivers for the organization to generate more value for its members, offering an additional membership, and they are represented by actions that increase satisfaction, such as operational activities.
Analysis of heterogeneity
In many real-world applications, the assumption of homogeneity is unrealistic because individuals are likely to be heterogeneous in their perceptions and assessments of current constructs. The multi-group analysis (MGA) is used to test whether predefined data multi-groups significantly differ in their
estimates of specific group parameters (Hair et al., 2013). One of the main objectives of this type of
analysis is to compare pairs of path coefficients for identical models based on different samples. The results of this analysis were performed according to Hair, Hult, Ringle and Sarstedt (2014).
Multi-group analysis (MGA) data suggest that there is heterogeneity between the group of indebted and non-indebted cooperative members. It makes sense to separate them for analysis and consider them as individual samples. The indebted group consisted of 110 individuals and non-indebted group had of 94 individuals. For this analysis, a mean of the responses on debt was calculated, where an average greater than 3.53 was considered as indebted and a lower average was considered as non-indebted.
Table 4
Path Coefficients PLS-MGA Indebtedness
PLS-MGA Indebtedness Non- Indebtedness Indebtedness X Non- Indebtedness
Path coefficients
Standard error
Path coefficients
Standard error
Path
coefficients -diff
p-value
Long term orientation -> Perception of value co-creation actions
0.020 0.098 0.169 0.110 0.149 0.845
Management professionalization
-> Long term orientation 0.136 0.155 0.009 0.238 0.127 0.328
Management professionalization -> Perception of value co-creation actions
-0.050 0.191 0.791 0.225 0.841 0.994
Management professionalization
-> Satisfaction and loyalty 0.862 0.025 0.911 0.022 0.050 0.933
Satisfaction and loyalty
-> Long term orientation 0.594 0.141 0.345 0.249 0.249 0.183
Satisfaction and loyalty
-> Perception of value co-creation actions
0.759 0.155 -0.088 0.255 0.847 0.006
Note. Source: research data.
The data show that the characteristic of level of indebtedness of the member positively influences the relationship satisfaction and loyalty in the variable perception of the actions of value co-creation. Moreover, the most indebted members are more satisfied and loyal and have a greater perception of value co-creation actions. This may be due to the reliance of these members on activities that create value in the organization, as they are more relevant than for less-indebted members.
Continuing this analysis, the data obtained after dividing members by association suggest a heterogeneous perception regarding how long the member is associated with the cooperative. Two groups were formed, the first with 120 respondents with an association time between 0 and 19 years and the second group composed of 84 respondents with more than 20 years as members.
According to the results based on time of association, the time orientation of the member
influences some relations. The effect of time orientation on the member’s perception of value
Table 5
Path Coefficients PLS-MGA for Association Time
PLS-MGA 20 years or more Up to 19 years Up to 19 years X 20 years or more
Path
coefficients
Standard error
Path coefficients
Standard error
Path coefficients -diff
p-value
Long term orientation -> Perception of value co-creation actions
0.076 0.082 0.261 0.114 0.185 0.096
Management professionalization
-> Long term orientation -0.165 0.210 0.361 0.144 0.526 0.024
Management professionalization -> Perception of value co-creation actions
0.457 0.165 -0.123 0.235 0.581 0.977
Management professionalization
-> Satisfaction and loyalty 0.849 0.026 0.899 0.023 0.050 0.076
Satisfaction and loyalty
-> Long term orientation 0.655 0.222 0.370 0.157 0.286 0.860
Satisfaction and loyalty -> Perception of value co-creation actions
0.418 0.155 0.590 0.187 0.171 0.233
Note. Source: research data.
The data indicate that members with up to 19 years of association have a long-term orientation and perceive value co-creation actions more positively (0.261). They also have a better perception of the benefits of professional management. As they perceive the benefits of professional management, they also increase their time horizon, representing greater confidence in the solidity of management and the cooperative regarding their long-term investments (0.849 and 0.899). A direct positive relation was observed between management professionalization and time orientation (0.361), similar to the previous case.
These results indicate that members with short- and medium-term time orientation perceive value co-creation in the activities and professionalization of management. However, the characteristic association time is not determinant in the relationship between management professionalization and satisfaction and loyalty, since both groups perceive the relationship positively and showed very close values.
Another characteristic that revealed the heterogeneity of the groups was in relation to the size of the rural property. The two groups were divided into 151 members with rural properties of up to 20 hectares and 53 members with properties of over 20 hectares. The results revealed aspects of significant
heterogeneity in relation to the size of the members’ rural property. The data indicate (p <0.05) that the
Table 6
Path Coefficients PLS-MGA Property Size
PLS-MGA 20 hectares or more Up to 19 hectares 20 hectares or more vs. Up to 19 hectares
Path
coefficients
Standard error
Path coefficients
Standard error
Path
coefficients -diff
p-value
Long-term orientation -> Perception of value co-creation actions
0.497 0.144 0.060 0.071 0.436 0.003
Management
professionalization -> Long-term orientation
0.647 0.210 0.131 0.169 0.516 0.030
Management
professionalization -> Perception of value co-creation actions
0.000 0.314 0.359 0.166 0.389 0.864
Management
professionalization -> Satisfaction and loyalty
0.931 0.0354 0.888 0.020 0.043 0.130
Satisfaction and loyalty
-> Long term orientation 0.170 0.220 0.449 0.170 0.279 0.844
Satisfaction and loyalty -> Perception of value co-creation actions
0.407 0.251 0.376 0.154 0.031 0.463
Note. Source: research data.
The characteristic of the member in relation to the size of the rural property positively impacts the time orientation and perception of co-creation actions (0.497). Thus, larger members tend to have a greater perception of value because of the risk and return of becoming involved and because they depend on the cooperative organization. This is due to the specificity of the products and seeking to get involved in long-term projects. Additionally, members with larger properties evaluate a positive management
relationship over the member’s time horizon leading them to long-term projects.
The last multi-group analysis considered the level of education of the respondent members. The
two groups were formed by members who finished the 1st grade representing 127 individuals, and
members who had finished 2nd grade or more, composed of 77 individuals. The results revealed a
significant heterogeneity between the groups. The variable management professionalization influencing the perception of value co-creation actions had a significant result (p <0.05). The effect management
professionalization on the perception of members regarding the actions of 2nd value co-creation was
Table 7
Path Coefficients PLS-MGA for Schooling
PLS-MGA 1st grade 2nd grade 1st grade vs. 2nd grade
Path coefficients Standard error Path coefficients Standard error Path
coefficients -diff
p-value
Long-term orientation -> Perception of value
co-creation actions
0.0527 0.084 0.357 0.105 0.304 0.984
Management professionalization ->
Long-term orientation
0.038 0.170 0.239 0.267 0.200 0.735
Management professionalization -> Perception of value
co-creation actions
0.589 0.186 0.000 0.324 1.000 0.0019
Management professionalization -> Satisfaction and loyalty
0.880 0.023 0.881 0.023 1.000 0.513
Satisfaction and loyalty
-> Long term orientation 0.572 0.160 0.442 0.286 0.129 0.354
Satisfaction and loyalty -> Perception of value
co-creation actions
0.175 0.207 0.884 0.236 0.709 0.989
Note. Source: research data.
The characteristic of the member in relation to level of education revealed that members with up
to 1st grade perceive the relationship between management professionalization and their perception of
the benefits of value co-creation, that is, a lower level of education influences a higher perception of value in management. Moreover, the group with a higher level of education does not perceive this relationship. This shows the dependence and trust of members with a lower level of education in relation to management and the actions carried out by the organization.
Multi-group analysis was also performed for the age of members. They were separated into two groups, one group of 88 individuals with up to 50 years and another with 116 individuals over 50 years old. However, the results did not show significant heterogeneity.
The results of the analyses showed that the value co-creation is perceived more intensely among members with a shorter association time. Members with up to 19 years of association had a long-term time orientation, perceived positive actions as value, and also perceived the benefits of professional management. It is also possible to conclude that perception of value co-creation is influenced by the degree of indebtedness of the members. Moreover, most indebted members are more satisfied and loyal and have a greater perception of value co-creation actions.
Finally, the size of the member’s rural property also influences the perception of value co-creation
actions considering members with larger properties tended to perceive more value. The member’s
Conclusions
The results showed a significant positive relationship between the level of perception of value co-creation actions and the other studied variables, except for management professionalization, which, nonetheless, has a moderating effect on the other constructs. The data indicate that the latent variable management professionalization presented, as the main indicator explained, satisfaction and loyalty. In other words, an organization that adopts professional management practices has higher levels of satisfaction and loyalty since the image of the cooperative improves and it is more capable of meeting the needs of stakeholders.
Likewise, management professionalization influences the member’s time orientation, which can
be explained by the increased level of trust and a greater capacity to meet the needs of members, thus reducing the conflicts of the agency. It can also influence the time horizon of the return on investment. The latent variable long-term orientation of the member reflects the use of this measure in the perception of value co-creation actions. Therefore, the perception of the benefits generated by the organization with value co-creation can be influenced by the time horizon of the member, perceived over time. And the variable satisfaction and loyalty explains the perception of value co-creation actions and time orientation confirming the approach of literature on value co-creation.
Regarding the results of the multi-group analysis, it was observed that the effect of satisfaction and loyalty of the member on the perception of value co-creation actions is significantly higher for the indebted members. This means that the more indebted members are more aware of value-co-creating
actions. The effect of the member’s long-term orientation on the perception of value co-creation actions
is significantly higher for the member with up to 19 years of association. And the same result was found in relation to the professionalization of management over the long-term orientation of the member and to the professionalization of management over satisfaction and loyalty.
The data showed that the member’s long-term time orientation influences the perception of value
co-creation actions in relation to the size of the rural property. Members with larger properties (more than 20 hectares) showed a positive association with long-term time orientation. The greater professionalism of management also influenced the long-term orientation of members with larger properties. Furthermore, the effect of management professionalization on the perception of value
co-creation actions is greater for the members with up to 1st grade education, revealing dependence and
trust among the less educated members concerning the decisions and actions of cooperative management.
In addition, it is concluded that members perceive value co-created in the actions offered by the cooperative. It is also concluded that the satisfaction and loyalty and long-term orientation of the member directly influence perception, while the professionalization of the management indirectly influences perception. However, this perception may be influenced by some member characteristics
such as level of indebtedness, time of association, level of schooling, and size of the member’s rural
property. The members’ perception of value co-creation is impacted by the characteristics of the member
and the cooperative.
As practical implications, the results of value co-creation actions with innovation characteristics (value co-creation) tend to be perceived in the long term and influenced by the specific characteristics of the member. Therefore, in order to increase the perception of value creation in the cooperative, it is necessary to carry out activities that provide more immediate returns oriented toward the needs, personal characteristics, and perceptions of the members. If the actions cannot be immediate, the cooperative can create activities to raise awareness of the returns it generates among members by highlighting that these returns are distributed over the years.
processes since it is at this stage that members most need support. Other options would be to enable communication between cooperative and member using transparency techniques and guaranteeing
accountability and attendance of the member’s needs.
Cooperative management can use the information on the perception of members’ value
co-creation actions to identify the value drivers of members, such as support for initial production processes, technical assistance, training, input prices, and price paid for the product delivered at the cooperative.
By showing the contributions of cooperatives through value co-creation actions, it may be possible to increase the perceived value created in the cooperatives and promote a more productive relationship between the parties.
Management that is capable of identifying the value created for members can assertively direct the actions and activities of the cooperative. Moreover, delivering value to the cooperative can contribute to the survival and perpetuity of these organizations.
Finally, we propose further research on cooperative profile in the short-, medium- and long-term time horizon. Future analyses should include more cooperatives and a larger number of respondents given the limitation of the sample of this research. Furthermore, comparative research of cooperatives of agricultural products such as sugar cane and soybean or even in very different segments should be conducted to verify the perception of value co-creation in credit unions.
Contributions
1st author: concept, design, writing, analysis of the manuscript, discussion of results, revision, final approval of the paper.
2nd author: concept, design, discussion of results, analysis of the manuscript, final approval of the paper. 3rd author: analysis of the manuscript, discussion of results, revision.
4th author: concept, design, final approval of the paper.
References
Aguiar, A. B. (2009). Sistemas de remuneração gerencial e orientação temporal dos gestores (Tese de
doutorado). Faculdade de Economia, Administração e Contabilidade, Universidade de São Paulo, São Paulo, SP, Brazil.
Aguiar, A. B., & Frezatti, F. (2014). Uso de medidas não financeiras de desempenho, estratégia e
orientação temporal de gestores das melhores empresas para você trabalhar. Revista Eletrônica
de Administração (Porto Alegre), 20(1), 114-139. https://doi.org/10.1590/s1413-23112014000100005
Aguiar, A. B., Rezende, A. J., & Rocha, W. (2008) Uma análise da complementaridade entre gestão
interorganizacional de custos e open-book accounting. Revista de Administração e Contabilidade
da Unisinos, 5(1), 66-76. Retrieved from
http://revistas.unisinos.br/index.php/base/article/view/5176
Anceles, P. E. S. (2014). Sociedade cooperativa de produção agropecuária: Estudo dos ganhos
Anderson, E. (1985). The salesperson as outside agent or employee: A transaction cost analysis.
Marketing Science, 4(3), 234-254. https://doi.org/10.1287/mksc.4.3.234
Babbie, E. (2001). The practice of social research (9th. ed.). Belmont, CA: Wadsworth.
Bachmann, R. (2001). Trust, power and control in trans-organizational relations. Organization Studies,
22(2), 337-365. https://doi.org/10.1177/0170840601222007
Bhuyan, S. (2007). The “people” factor in cooperatives: An analysis of members’ attitudes and behavior.
Canadian Journal of Agricultural Economics, 55(3), 275-298. https://doi.org/10.1111/j.1744-7976.2007.00092.x
Bialoskorski, S., Neto. (1998). Cooperativas: economia, crescimento e estrutura de capital (Tese de
doutorado). Escola Superior de Agricultura Luiz de Queiroz (ESALQ), Universidade de São Paulo, São Paulo, SP, Brazil.
Bialoskorski, S., Neto, & Davis, P. (2010). Governança e gestão de capital social em cooperativas: Uma
abordagem baseada em valores. ESAC Economia Solidária e Ação Cooperativa, 5(1), 1-24.
Buainain, A. M., Alves, E. D. A., da Silveira, J. M., & Navarro, Z. (2014). O mundo rural no Brasil do
século 21: A formação de um novo padrão agrário e agrícola. Brasília, DF: Embrapa.
Chan, K. W., Yin, C. K., & Lam, S. S. K. (2010). Is customer participation in value creation a
double-edged sword? Evidence from professional financial. Journal of Marketing, 74(3), 48-64.
https://doi.org/10.1509/jmkg.74.3.48
Chin, W. W. (2003). PLS-graph (Version 03.00, build 1058). [Software]. Houston, TX: University of
Houston.
Chin, W. W., Marcolin, B. L., & Newsted, P. R. (2003) A partial least squares latent variable modeling approach for measuring interaction effects: Results from a Monte Carlo simulation
study and an electronic mail emotion/ adoption study. Information Systems Research, 14(2),
189-217. https://doi.org/10.1287/isre.14.2.189.16018
Cohen, J. (1988). Statistical power analysis for the behavioral sciences (2nd ed.). New York: Routledge
Cook, M. L. (1994). The role of management behavior in agricultural cooperatives. Journal of
Agricultural Cooperation, 9, 42-66. Retrieved from
http://ageconsearch.umn.edu/record/46402/files/Vol%209%201994%20The%20Role.pdf
Cook, M. L. (1995). The future of US agricultural cooperatives: A neo-institutional approach. American
Journal of Agricultural Economics, 77(5), 1153-1159. http://dx.doi.org/10.2307/1243338
Cossío-Silva, F.-J., Revilla-Camacho, M.-A., Vega-Vázquez, M., & Palacios-Florencio, B. (2016).
Value co-creation and customer loyalty. Journal of Business Research, 69(5), 1621-1625.
https://doi.org/10.1016/j.jbusres.2015.10.028
Dervojeda, K., Nagtegaal, F., Lengton, M., & Rouwmaat, E. (2014). Design for innovation co-creation
design as a new way of value creation. Business Innovation Observatory Contract, 3(19), 1-20.
Dick, A. S., & Basu, K. (1994). Customer loyalty: Toward an integrated conceptual framework. Journal
of the Academy of Marketing Science, 22(2), 99-113. https://doi.org/10.1177/0092070394222001
Fornell, C., & Larcker, D. F. (1981). Evaluating structural equation models with unobservable variables
and measurement error. Journal of Marketing Research, 18(1), 39-50.
Frow, P., Nenonen, S., Payne, A., & Storbacka, K. (2015). Managing co‐creation design: A strategic
approach to innovation. British Journal of Management, 26(3), 463-483.
https://doi.org/10.1111/1467-8551.12087
Fulton, M. (1999). Cooperatives and member commitment. Finnish Journal of Business Economics
(LTA), 4(99), 418-437. Retrieved from http://lta.lib.aalto.fi/1999/4/lta_1999_04_a4.pdf
Galvagno, M. (1999). The intellectual structure of the anti-consumption and consumer resistance field:
An author co-citation analysis. European Journal of Marketing, 45(11/12), 1688-1701.
https://doi.org/10.1108/03090561111167441
Galvagno, D., & Dalli, M. (2014). Theory of value co-creation: A systematic literature review.
Managing Service Quality, 24(6), 643-683. https://doi.org/10.1108/MSQ-09-2013-0187
Gimenes R. M. T., & Gimenes, F. M. P. (2008). Desafios para a gestão financeira das cooperativas
agropecuárias brasileiras. Análise, 19(1),76-98. Retrieved from
http://revistaseletronicas.pucrs.br/ojs/index.php/face/article/view/351/3215
Granlund, M., & Taipaleenmäki, J. (2005). Management control and controllership in new economy
firms - A life cycle perspective. Management Accounting Research, 16(1), 21-57.
https://doi.org/10.1016/j.mar.2004.09.003
Grönroos, C. (2011). Value co-creation: Towards a conceptual model. Otago Forum, Otago, New
Zealand, 3.
Hair, J. F., Jr., Hult, G. T. M., Ringle, C., & Sarstedt, M. (2014). A primer on partial least squares
structural equation modeling (PLS-SEM). Thousand Oaks: Sage Publications.
Hair, J. F., Jr, Ringle, C. M., & Sarstedt, M. (2013). Partial least squares equation modeling: Rigorous
applications, better results and higher acceptance. Long Range Planning, 46(1-2), 1-12.
https://doi.org/10.1016/j.lrp.2013.01.001
Hakelius, K., & Hanssonb, H. (2016). Members’ attitudes towards cooperatives and their perception of
agency problems. International Food and Agribusiness Management Review, 19(4), 23-36.
https://www.wageningenacademic.com/doi/abs/10.22434/IFAMR2015.0219
Hansmann, H. (1996) The ownership of enterprise. Cambridge: Belknap Press of Harvard University
Press.
Hemmer, T. (1996). On the design and choice of “modern” management accounting measures. Journal of Management Accounting Research, 8, 87-116. Retrieved from https://www.researchgate.net/publication/284261929_On_the_design_and_choice_of_modern_ management_accounting_measures
Henseler, J., Ringle, C. M., & Sinkovics, R. R. (2009). The use of partial least squares path modeling in
international marketing. In R. R. Sinkovics, & P. N. Ghauri (Eds.), New challenges to
international marketing (Book Series: Advances in International Marketing, Vol. 20, pp. 277-319). Bingley, UK: Emerald Group Publishing Limited.
International Co-Operative Alliance. (n.d.). What is a cooperative? Retrieved from
https://www.ica.coop/en/what-co-operative-0
Jaakkola, E., & Hakanen, T. (2013). Value co-creation in solution networks. Industrial Marketing
Management, 42(1), 47-58. https://doi.org/10.1016/j.indmarman.2012.11.005
Kahneman, D., & Tversky, A. (1979). Prospect theory: An analysis of decision under risk.
Kaplan, R. S., & Norton, D. P. (1996). The balanced scorecard. Boston: Harvard University Press.
Kerlinger, F. N. (1980). Metodologia da pesquisa em ciências sociais: Um tratamento conceitual. São
Paulo: EPU, Edusp.
Laverty, K. J. (1996). Economic “short-termism”: The debate, the unresolved issues, and the implications
for management practice and research. Academy of Management Review, 21(3), 825-860.
https://doi.org/10.5465/amr.1996.9702100316
Marginson, D., McAulay, L., Roush, M., & Van Zijl, T. (2010). Performance measures and short‐termism:
An exploratory study. Accounting and Business Research, 40(4), 353-370.
https://doi.org/10.1080/00014788.2010.9995317
Menard, C. (2004). The economics of hybrid organizations. Journal of Institutional and Theoretical
Economics, 160(3), 345-376. https://doi.org/10.1628/0932456041960605
Menard, C. (2013). Plural forms of organizations: Where do we stand working paper. Managerial and
Decision Economics, 34(3-5), 124-139. https://doi.org/10.1002/mde.2578
Merchant, K. A. (1990). The effects of financial controls on data manipulation and management myopia.
Accounting, Organizations and Society, 15(4), 297-313. https://doi.org/10.1016/0361-3682(90)90021-L
Organização das Cooperativas Brasileiras. (2013). Começa hoje uma das maiores feiras tecnológicas
do agronegócio brasileiro. Retrieved from https://www.ocb.org.br/noticia/13668/comeca-hoje-uma-das-maiores-feiras-tecnologicas-do-agronegocio-brasileiro
Organização das Cooperativas Brasileiras. (n.d.b). Cartilha de orientação às cooperativas
agropecuárias. Retrieved from
https://www.somoscooperativismo.coop.br/publicacao/22/cartilha-de-orientacao-as-cooperativas-agropecuarias
Organização das Cooperativas Brasileiras. (n.d.a). Ramos do cooperativismo. Retrieved from
https://www.ocb.org.br/ramos
Payne, A. F., Storbacka, K., & Frow, P. (2008) Managing the co-creation of value. Journal of the
Academic Marketing Science, 36(1), 83-96. https://doi.org/10.1007/s11747-007-0070-0
Pinho, D. B. (2004). O cooperativismo no Brasil: Da vertente pioneira à vertente solidária. São Paulo,
SP: Saraiva.
Polônio, W. A. (1999). Manual das sociedades cooperativas (2a. ed.). São Paulo, SP: Atlas.
Porter, M. E., & Kramer, M. R. (2011). The big idea: Creating shared value. Harvard Business Review,
89(1), 2. Retrieved from https://hbr.org/2011/01/the-big-idea-creating-shared-value
Prahalad, C. K., & Ramaswamy, V. (2004a). Co-creation experiences: The next practice in value
creation. Journal of Interactive Marketing, 18(3), 5-14. https://doi.org/10.1002/dir.20015
Prahalad, C. K., & Ramaswamy, V. (2004b). O futuro da competição: Como desenvolver diferenciais
inovadores em parceria com os clientes. Rio de Janeiro, RJ: Campus.
Ringle, C. M., Silva, D., & Bido, D. S. (2014). Modelagem de equações estruturais com utilização do
SmartPLS [Special issue]. Revista Brasileira de Marketing, 13(2), 56-73. http://dx.doi.org/