Livros Grátis
http://www.livrosgratis.com.br
PRESIDENTE DA REPUBLICA
PRESIDENT OF THE REPUBLIC
Luiz Inacio
Lula
da Silva
MINISTR0 DA EDUCACAO
MINISTER OF EDUCATION
Cristovam Buarque
INSTITUTO NACIONAL DE ESTUDOS E PESQUISAS
EDUCACIONAIS
ANISIO TEIXEIRA
NATIONAL INSTITUTE FOR EDUCATIONAL STUDIESAND RESERACH ANlSIO TEIXEIRA (Inep)
Raimundo Luiz Silva Araujo
DIRETORIA DE TRATAMENTO E DISSEMINAÇÃO
DE INFORMACOES EDUCACIONAIS
THE OFFICE FOR TREATMENT AND DISSEMINATION OF EDUCATIONAL INFORMATION
Jose Marcelino de Rezende Pinto
COORDENAÇÃO-GERAL DE LINHA EDITORIAL
E PUBLICAÇOES
GENERAL-COORDINATION FOR PUBLICATIONS
The challenge of quality education for all
Education in Brazil-1990-2000
COORDENAÇÃO DE PRODUÇÃO EDITORIAL | Coordination of Editorial Production | Rosa dos Anjos Oliveira COORDENAÇÃO DE PROGRAMAÇÃO VISUAL | Coordination of Visual Design | F. Secchin
EDITOR EXECUTIVO | Executive Editor \ Jair Santana Moraes REVISAO | Proofreading | Eveline de Assis | Rosa dos Anjos Oliveira
NORMALIZAÇÃO BIBLIOGRAFICA | Bibliogrphic Standardization | Regina Helena Azevedo de Mello PROJETO GRAFICO/CAPA/DIAGRAMAÇÃO E ARTE-FINAL | Graphic Design | Marcos Hartwich The following persons took part in the preparation of this document:
Jose Marcelino de Rezende Pinto Carlos Eduardo Moreno Sampaio
Liliane Lucia Nunes de Aranha Oliveira Brant Vanessa Nespoli de Oliveira
Carolina Pingret de Sousa Joao Vicente Pereira James Richard Silva Santos
TRADUQAO PARA 0 INGLES | Translation into English Ivan Castro de Almeida | lvan.almeida@planejamento.gov.br Vera Sarmento | verasarmento@terra.com.br
TIRAGEM | Copy | 200 exemplares
Endereço | Address | Inep/MEC - Instituto Nacional de Estudos e Pesquisas Educacionais Anisio Teixeira Esplanada dos Ministerios, Bloco L, Anexo 1, 4° Andar, Sala 418
CEP 70047-900 - Brasilia-DF - Brasil Fones: (61) 410-8438, (61)410-8042 Fax: (61) 410-9441
editoria@inep.gov.br
Cataloguing-in-publication (CIP)
The challenge of quality education for all - Education in Brazil - 1990-2000 / Instituto Nacional de Estudos e Pesquisas Educacionais Anisio Teixeira. - Brasilia : Inep, 2003.
38 p.
1. Education with quality. 2. Educational indicators. I. Instituto Nacional de Estudos e Pesquisas Educacionais Anisio Teixeira.
Summary
Presentation 5 1. Illiteracy 9 2. Access and participation 13
3. Supply of quality education 17 4. Permanence and progression indicators 21
5. Student's assessment results 25 6. Educational profile of the population 27
7. Financing education 31 8. Challenges for quality education for all 35
8.1. Major goals of the National Education Plan (from 2001) 35 8.2. The Ministry of Education Programs, as established in the Pluriannial Plan
Presentation
The Federal Constitution of 1988 became a landmark in setting the conditions toward education for all in Brazil. The Magna Carta, besides securing compulsory elementary education for a period of eight years, determines that secondary education should progressively be available to all the students, and makes early childhood education a right to the family and a duty to the State. The effect of these rights, ensured by the Federal Constitution, determined a marked expansion in enrollments in public education institutions, which, from 1988 to 2002, grew 58% for the pre-school, 36,5% for the elementary school, 232% for the secondary school, and 82% for tertiary schools, alongside with a total of about 720 thousand students enrolled in public nursery schools, which were not even accounted for in 1988, since nursery schools were not part of the educational sector.
There has been great improvement in supplying education services for all levels of education, however, there still remains a long way to go, both toward universal access to early childhood, secondary and tertiary education and to a qualitative improvement of the services provided by the school system. Here, as we will see later, the great challenge is broadening the basis of the resources available for financing education, since these resources available are not enough to secure good education to the
students enrolled in the public education system, in order to attain goals set by the National Plan of Education, sanctioned in 2001 for a 10 years period.
This document was prepared to evaluate the progress of education in Brazil as an input for the Brazilian participation in the 5th Ministerial Assembly to review the Education for All Program, to be held in the city of Cairo, Egypt, between the 19th and the 21st of December, 2003.
It presents an overview of the state of art of education in the country, pointing out at the main challenges for the government in order to be able to comply with the goal set by the Federal Constitution, that is, provide quality education for all Brazilians, regardless race-ethnicity, gender, religious or income.1
The report starts with the issue of illiteracy in Brazil, showing that this is a problem inherent to the texture of which is part of the very tissue of the Brazilian society, reflecting the deep inequalities prevailing in Brazil.2
The second part deals with the access to and the participation of the Brazilian population in the educational system. Here the more noticeable advances in national education can be verified. It is stated that, even though these advances have been noticeable, they are not enough to reach the level of educational development compatible with its potentialities.
Afterwards, questions about the Brazilian educational process are addressed, in which the need to improve the efficiency and the quality of the education system is needed so that the permanence and the progression of students can be ensured. Despite improvement in participation, results are still shortcomings due to high repetition rates, age-grade gap, besides poor school infrastructure, etc.
Therefore, it is easy to notice why the Brazilian students present such low results. The results of the National System of Evaluation for Primary Education3 show that the majority of students in Brazil
perform below minimum standards requirements, endorsed by the weak performance of Brazilian students in international comparative estudies.4
1 For a wider view of the Brazilian educational system, please refer to the publications from Inep: Educação do Brasil na Década de 90 (Education in Brazil in the 90's) and Geografia da Educação Brasileira (Geography of the Brazilian Education).
' Inep tackles the topic in a deeper way in its publication Mapa do Analfabetismo no Brasil (Map of Illiteracy in Brazil).
3 For further information about the Saeb (National System of Evaluation of Primary Education), please refer to Quality of Education: a new reading of the performance of the students of the 4"1 year of elementary school.
* For further information about the the Brazilian participation at Pisa, refer to the Inep publication: Pisa: International Report.
General aspects referring to public financing of education in the country are also presented, pointing out at the amount spent in education and the major challenges to the sector.
Finally, the main goals established by the National Educational Plan are presented, as well as the goals from the Ministry of Education (MEC), presented in the Pluriannual Plan (PAP). This confirms the Brazilian commitment to overcome the inefficiency of the public education system making education stronger and bringing about changes for a better education longed by the Brazilian society.
1.
Even though we observe a marked improvement over the last 10 years in the illiteracy rates, we have to be critical over the educational challenges the country still needs to tackle to overcome the historical deficit.
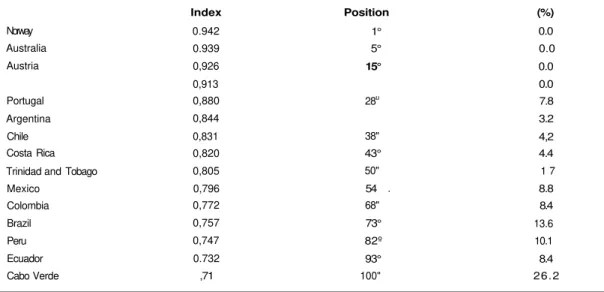
Eliminating illiteracy is, obviously, the first step towards the establishment of an educational system, which is both integrative and inductive to social and economical development. The results of the Human Development Index (HDI) showed that Brazil, despite improvements in its international position, managing to reach, in the year 2000, ranking 73rd, still shows one of the highest illiteracy rates, 13.6% of its population aged 15 years and above, which represents, in a significant number of 16,3 million people. This situation becomes more uncomfortable when compared to countries with lower HDI.
Table 1 - Human Development Index and Illiteracy Rate for the population 15-years-old and above - 2000
It must be mentioned, however, that there has been a decrease of these indices and that in the 90's the illiteracy rate registered an average annual decrease of 4.2% and a positive tendency towards the decrease of
Table 2 - Total Population and Illiterates for 15 years-old and above-Brazil-1991-2000
Year Total Illiterates Illiteracy Rate Illiteracy Rate
Index Position (%)
Norway Australia Austria Portugal Argentina Chile Costa Rica Trinidad and Tobago Mexico Colombia Brazil Peru Ecuador Cabo Verde 0.942 0.939 0,926 0,913 0,880 0,844 0,831 0,820 0,805 0,796 0,772 0,757 0,747 0.732 ,71 1° 5° 15° 28u 38" 43° 50" 54 68" 73° 82º 93° 100" 0.0 0.0 . 0.0 0.0 7.8 3.2 4,2 4.4 1 7 8.8 8.4 13.6 10.1 8.4 26.2
the absolute number of illiterates aged 15 years and above, something that had not happened since 1920. The Brazilian educational system clearly shows a significant reduction of illiteracy in the young adult population, reaching indices smaller than two digits for the population aged 29 year old or less. On the other hand, for the population aged 50 years and above, a group more difficult to be reached by government programs aiming at fighting illiteracy, the rate is at the level of 29.4%.
Gender differences in illiteracy rates are not relevant in Brazil. Despite being equally worrisome, illiteracy rates diverge in only 0.3% in favor of the women.
On the other hand, the country shows a strong regional bias, reflecting and reproducing the socio-economical inequalities of its population. For instance, the illiteracy rate of the population in rural areas is three times the one registered in urban areas, a relation that has not change much since the beginning of the 90's.
Age group
15 years old and above 15 to 19 years 20 to 24 years
25 to 29 years
30 to 39 years
40 to 49 years
50 years and above Gender Man Woman Location Urban Rural
Source: IBGfc - Demogr*l«i; Census 1991-2000
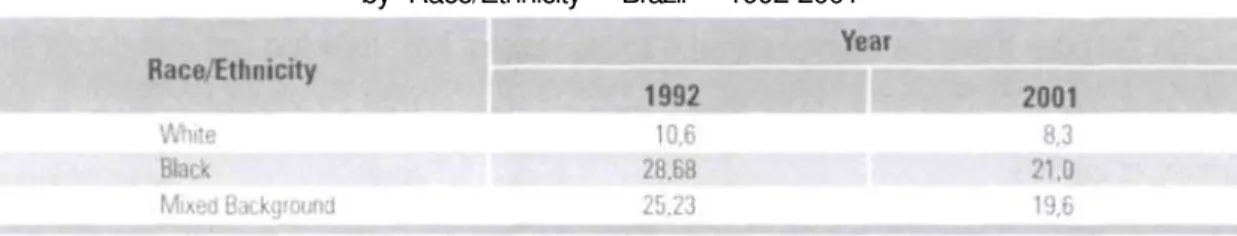
The portrait of inequalities can also be noticed if we analyze the phenomenon by race/ethnicity. In spite of the mixed race/ethnicity characteristics of the Brazilian population, the illiteracy rate among the Afro-Brazilian population is almost twice the one among the white ones, and this ratio is closely related to the socio-economical levels of these populations.
Table 4 - Illiteracy Rate for the population 15-year-older and above, by Race/Ethnicity - Brazil - 1992-2001
In a world order where schooling is part of the basic tools for acquiring citizenship and access to the labor market, it is clear that the higher levels of illiteracy happen among the people from the lowest income groups. While the illiteracy rate among the richier population is only 1.4%, among the poorest ones it is 28%.
Table 5 - Illiteracy Rate for the population 15-years-old and above - Brazil - 1996-2001
Income group
More than 1 minimum wage and 3 More than 3 and 5 minimum wages Mote than 5 and 10 minimum wages More than 10 minimum wages
1996
26,6 14,8
7,4 2,1
Year
2001 28,8 19,7
9,7 4,7 1,4
2. Access and participation
Over the last years, Brazil has made a great effort to include more children in the educational system. The results can be observed by the participation rates at school and the growing number of enrollment at all levels of education. Access to school is the first step towards eliminating illiteracy. If, on the one hand, access to education, mostly for the 7 to 14 years population, has reached satisfactory levels, comparable to the ones of developed countries, on the other, it is essential that these children remain in school. It is not only participation for this age group that has grown significantly, it also happened among the group of those between 15 and 17, 81.1% of them were-enrolled in school during 2001.
Table 6 - Rate of School Attendance - Brazil - 1996-2001
Participation rates by age group Age group
0 to 3 years 4 to 6 years 7 to 14 years 15 to 17 years 18 to 24 years 1996 55.4 90.2 66.8 25,8 2001 10,6 65,6 96,5 81.1 34,0
Source:IBGE Census 1996 and Pnad-2001
NB. In 2001 excluding the rural population of R o n d o n i a Acre, Roraima Pará and Amapá
However, for early childhood education, Brazil need improvement, so that it may guarantee that all of them who want to, have access to education, as it is ensured by the legislation. This is a tenet established by the Federal Constitution and by the Law for Guidelines and Basis of the National Education and will demand cooperation and coordination among the three levels of government.
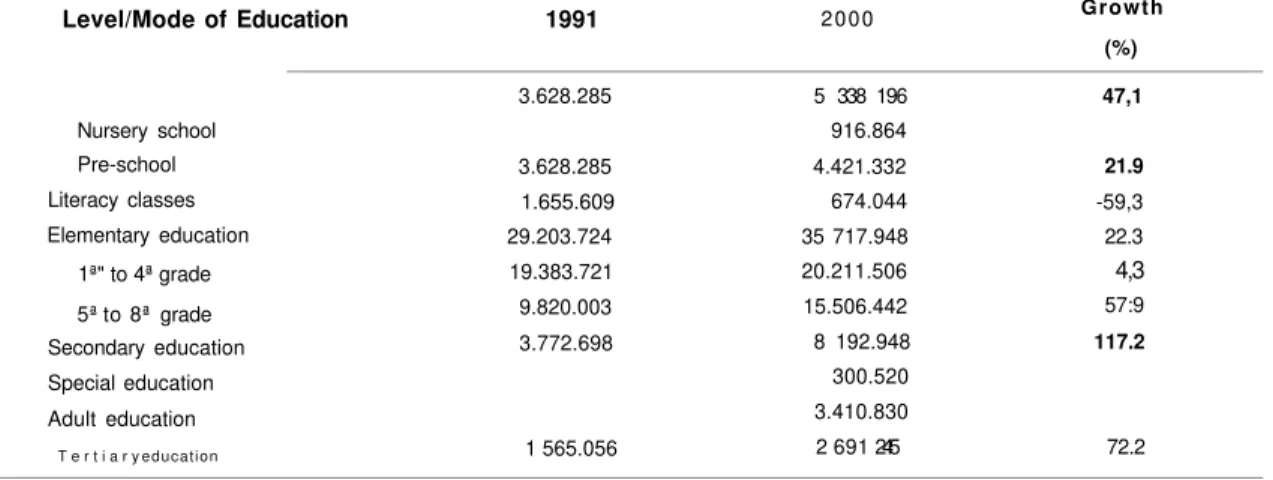
Secondary education is the level of education that has mostly grown in the last ten years, a reflection of the improvement of the students flow; in other words, more students are completing Elementary Education. While the number of students in the first cycle (1 st to 4th grades) of this level has grown only 4.3% in one decade, at the second cycle (5th to 8th grades) level, enrollment growth was 57.9%. The result is a strong demand for secondary education.
In the same way, the tertiary education system has grown very markedly over the last years, especially the private sector. At present, this sector corresponds to about 70% of the total of enrollments of higher education. However, the participation rate in tertiary education in the country is still one of the lowest in Latin America (12% of the population between 18 and 24). As the supply conditions of the private sector has reached its limits, with a large number of vacancies unattended, the way out must be through the growth of the public sector, which is the one presenting the best quality of education provided.
The offer of special education has progressively improved in Brazil. Today there are more than 300 thousand students being served. It is the private sector, however, through philanthropic institutions, which get the biggest share: 56.1 % of the students of especial education study in these schools.
Including special education students in the regular classroom has become part of the daily life in many schools in Brazil, and nowadays there are more than 30 thousand students attending regular classroom.
Table 7 - Enrollments by Level/Mode of Education - Brazil - 1991-2000
Level/Mode of Education 1991
Nursery school Pre-school Literacy classes Elementary education
1ª" to 4ª grade 5ª to 8ª grade Secondary education Special education Adult education
T e r t i a r y education
3.628.285 3.628.285 1.655.609 29.203.724 19.383.721 9.820.003 3.772.698 1 565.056 2000
5 338 196 916.864 4.421.332 674.044 35 717.948 20.211.506 15.506.442 8 192.948 300.520 3.410.830 2 691 245
Growth (%) 47,1 21.9 -59,3 22.3 4,3 57:9 117.2 72.2
3. Supply of quality education
Another major challenge to the Brazilian Educational System is posed by the need of improving the profile of teachers' qualification, essential to the teaching-learning process. With more than 2,5 million teachers working in basic and tertiary education, the country still does not count on enough qualified teachers with tertiary education degree working in basic education, currently, the functions occupied by professional teachers who do not have tertiary education qualification. The effort to revert this picture is part of the governmental policy of enhancement of the teaching career, by increasing their salaries and policies directed to improve the professional status of teachers.5
Over the last decade, at all levels and mode of education, the percentage of teachers having higher education qualification has been growing, but is still insufficient for solving the problem in a short time. In elementary level, less than 50% of the teaching positions are held by professionals with tertiary education.
5 In the publication Estatisticas dos Professores no Brasil (Statistics for Teachers in Brazil), Inep approaches in depth the maior indications for the performance of teachers in all levels and kinds of teaching.
Table 8 - Percentage of the Teachers with Tertiary Education by Level-Brazil-1991-2000
Level/Made of Education
Pie-school Elementary education Secondary education Special education Adult education 1991 17,1 41,0 83,5 Year 1996 18.2 43.8 86.4 43,4 61.1 2000 23,1 48,3 88,5 46.4 67.5
In terms of tertiary education, the policy is aimed at the acquisition of master and doctorate degrees. In 1991, only 35% of the teachers working in higher education had advanced degrees while in 2000 they represented 52% of all higher education teachers.
In order to fulfill the needs of the educational system we need adequate qualification of the teaching staff as well as, investment in the schools infrastructure.
Table 9 - Tertiary Education - Percentage of Professors by Qualification - Brazil - 1991-2000
Year
Brazil
Without tertiary education Tertiaryeducation Specialization Masters degree Doctoral degree 19911 100,0 0,1 31.8 32,9 21.8 13,3
2 0 0 02
100,0 0,1 15,3 32,1 31.4 20,6
Elementary education covers 63% of all students in the Brazilian education system. However, despite the improvement in the infrastructure, 6% of the students still attend schools without electricity; 4% without a sewage system and 1% without drinking water supply.6
Table 10 - Elementary Education - Enrollments and Percentage of Students Attending Schools With Drinking Water, Electricity, Sports Court and Principal's Office
-Brazil-1997-2001
Year
Initial Enrolment at the Regular Elementary Education Drinking
Total Water Absolute % 34.229 388 33151949 96,9
Eletricity Absolute % 31.661.283 92,5 Sports Court Absolute % 17.458.887 51,0 Sewage System Absolute % Secretary or Principal Office Absolute % 30 262.831 88.4
2000 35 717.948 35.241.576 98,7 33.727.855 94,4 18.204.873 51,0 34.434.883 96,4 32.003.786 89,6
Source: MEC/inep
In terms of the pedagogical resources, schools still lag behind on adequate conditions. Only 58% of the students of elementary school attend schools having libraries, 21% have access to science laboratories, 22% have access to computer laboratories. TV School, a governmental policy offering a TV channel to teachers and students, is available to 54% of the students of elementary education.
Table 11 - Elementary Education - Enrollments and Percentage of Students Attending Schools With Libraries, Science Laboratories, Computing Laboratories,
Internet and TV Schools - 1997-2001
6 Caracterizaçao Fisica das Escolas (Physical Characterization of the Schools), an Inep publication, depicts the main indicator of the School Census about the infrastructure available in the schools for primary education in Brazil.
The challenge of quality education for all - Education in Brazil -1990-2000
Total
Initial Enrollment at the Elementary Education
Library Science Computer
Laboratory Laboratory Internet TV School
Absolute % Absolute % Brazil 1997 2000 34.229.388 35.717.948 19.475.328 20 862 982
4. Permanence and progression indicators
After a first reading, the indicators presented related to supply of education cause a good impression about the Brazilian educational system. The contents of this topic, however, shows we need to be very careful before reaching out a conclusion about it, since Brazilian education still proves itself to be very inefficient both concerning to the number of graduates and the quality of learning.
Repetition, which interrupts the natural school flow for the student, has been indicated in studies and research as a major impediment to the educational development and a cause of breakage in the students' self-esteem. Although a reduction in these numbers has been verified, in 2000 about one fifth of the students (21.7%) in the elementary school were enrolled in the same school grade as in the previous year.
Table 12 - Transition Rates for the Students Flow by Level of Education - Brazil - 1991-2000
Level of Education/Transition Rate
Elementary Education Promotion Repetion Drop-out Secondary Education Promotion Repetion Drop-out 1991 60.4 33,2 6.4 63,1 30.7 6,2 2000 73.4 21,7 4.9 73.4 18,6 8.0
Table 13 - Age-grade gap Indicator and Percentage of Students of Elementary Education in the 1st
Cycle of Elementary School (1st to the 4th Grade) - Brazil - 1991-2000
Markers
Rates of distortion between age-grades Elementary school
% of students of elementary school from 1 " to 4 grade
1991 64.1 72,4 65.1 2000 41,7 54,9 56,6
As a consequence of the high repetition rates, the age-grade gap is one of the major problems in Brazilian education.7 In 2000, for each 100 of students enrolled in elementary school, 42 were not enrolled
in their own age cohort class grade. For the secondary level, this indicator was 54.9%. The assessment shows that the students lagging behind at school (that is, attending a grade which does not correspond to their age cohort group) have lower performance in relation to the students in grades appropriate to their age cohort group.
' For further details on the subject, refer to the publication Sincronismo idade-serie: urn indicador de produtividade do sistema educational brasileiro(Synchronism age-grade: an indicator of productivity of the Brazilian Educational System).
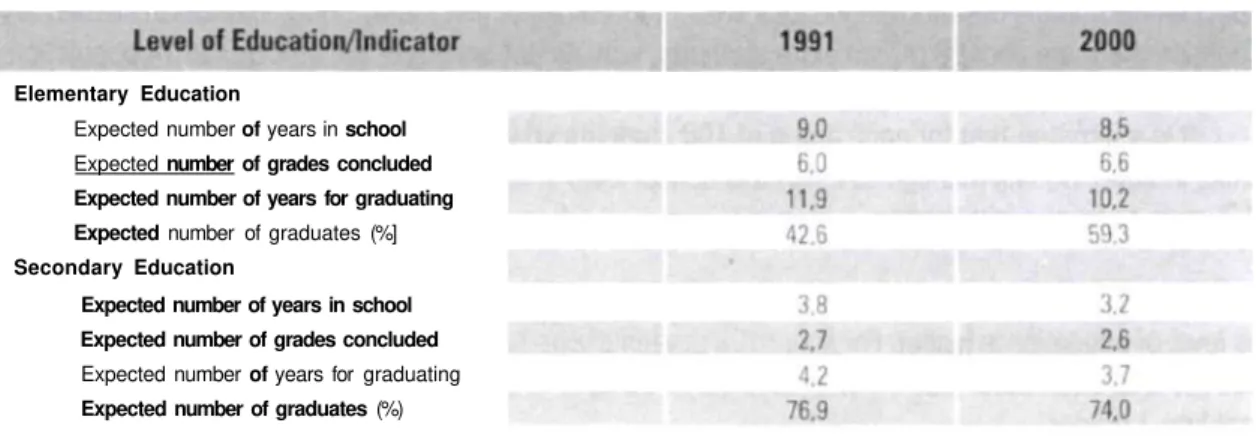
Table 14 - Efficiency Education Indicators by Level of Education - Brazil - 1991-2000
Elementary Education
Expected number of years in school
Expected number of grades concluded Expected number of years for graduating Expected number of graduates (%]
Secondary Education
Expected number of years in school Expected number of grades concluded
Expected number of years for graduating
Expected number of graduates (%)
Even though at a low pace, it is possible to see a significant reduction in the age-grade gap rates at each grade of basic education. It is also important to notice that this indicator has a strong inertial component, a factor helping to explain this slow pace.
The improvement of the students flow has had a strong impact on the age-grade gap indicator. In 1991, for the elementary level, 65.1% of the students were enrolled between the 1st and the 4th grades; in 2000, however, this was reduced to 56.6%.
One of the consequences of the smaller number of repeaters reflects itself in the growth on the number of students reaching higher grades of the elementary school. The decrease in the total of enrollment in elementary school and, at the same time, the growth in the numbers of students who finish this school level and enroll in the secondary school is also a consequence of a more efficienty system. Its consequence has been the improvement of the students flow, and the decrease in the dropout rates.
Brazilian students are spending more years at school, as well as improving their schooling. However, these numbers are still high, on average a student takes 8.5 years to finish 6.6 grades, due to the high repetition rates.
If there were no repetition student would finish elementary school in eight years, and secondary school in three. The long a permanence does not translate in an equal number of grades fulfilled. This
leads to financial and pedagogical wastage, which should be redirected to the improvement of other aspects of the educational system. This shows that the quality of education (or lack of it) has a direct impact on the number of years needed for a student to complete his studies. Today in Brazilian Elementary Education there are about 8 million extra students, who do not belong to the official 7 to 14 population. It is estimated that for each group of 100 students who enroll in the first year of the elementary school in 2000, 59 will manage to finish this school level of education. And they will take, on average, 10.2 years to finish eight grades.
To those who have succeeded in reaching secondary education, the expectancy for completing this level of education is higher. For every 100 students who have enrolled at the first grade of this level in 2000, it is estimated that 74 will manage to be able to finish it, taking on average 3.7 years to complete 3 grades.
So, what we can conclude is that the country has, undoubtedly, a marked progress as to drop out and progression indicators: However, there is still a long way to go to ensure the completion of elementary school to all the ones who have enrolled in it and a still longer road to go in order to provide universal secondary education.
5. Students' assessment results
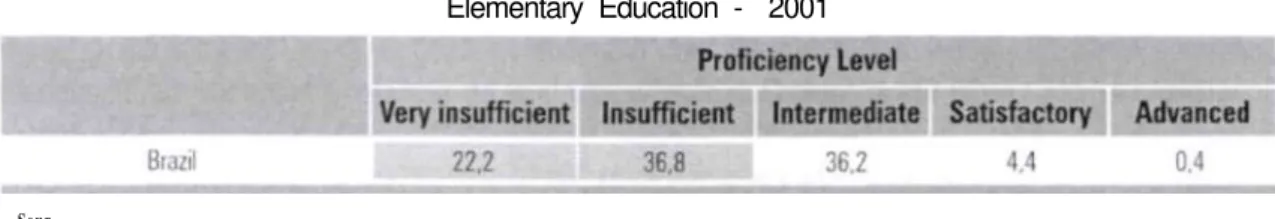
The results of proficiency from the 2001 SAEB assessment (System of Evaluation of the Basic Education), have served as a basis for the development of five categories of performance: very insufficient, insufficient, intermediate, satisfactory and advanced (see notes on Tables 15 and 16).
The analysis of the data from the 4th grade students in Portuguese (language) shows 22.2% of the students as having a very insufficient performance. In other words, they are at the negative end of the scale of proficiency devised by Saeb, and it means that these students have not developed basic reading skills. Thus they have not been properly taught how to read and write. Under a severe scrutiny, we can say that almost 59% of the Brazilian 4th grade students have serious deficiencies towards reading, and are classified as being at the very insufficient or insufficient stages. Only 5% of the students show the expected performance for the grade being tested.
Source: MEC/DAEB
NB:Very insufficient Students were not able to transpose, for a specific mathematical language, operational commands compatible with the 4 grade. (they cannot either identify a plus of minus, or do not know the geometric sigmlicance of simple figures). Students at this stage were not able to
leach level 1 of the Saeb scale
Insufficient Students develop some elementary abilities to interpret problems below what is expected to the 4" grade. (They are able to identify a basic operation and name simple geometrical figures) At this level students reach levels 1 and 2 in the Saeb scale.
Intermediate Students develop some abilities lor interpretation of problems, but not what is expected lor students of the 4 grade (They identify, without precision. up to two operations and some geometrical elements involved in the problem) At this stage students reach levels 3 and 4 of the Saeb scale.
Satisfactory Students are able to interpret ana solve problems in a competent way. They present abilities compatible with the 4" grade. (They recognize and perform operations with rational numbers using sums, subtractions. multiplications and divisions, as well as elements and characteristics belonging to the plain geometrical figures). At this stage students reach levels 5 and 6 of the Saeb scale.
Advanced. They are skilled students. They present abilities for interpretation of problems in a level beyond what is expected for students of the 4" grade They are able to recognize, solve and how to transpose to new situations all the operations with rational numbers involved in a problem. as well as elements and characteristics of the plain geometrical figures). At this stage they reach level 7 of the Saeb scale.
The challenge of quality education for all - Education in Brazil - 1990-2000
Table 15 - Percentage of Students by Proficiency Level - Portuguese 4th Grade -Elementary Education - 2001
S o u r . .
NB Very insufficient Students did not develop reading skills. They are considered functional illiterates. They were not able to answer the test items. At this stage they were not able to reach level 1 of the Saeb scale.
Insufficient Students are not skilled readers, they are able to read only simple sentences. At this stage, they are placed at levels 1 and 2 of the Saeb scale.
Intermediate Students are stalling to develop reading skills, but still below the requirement for reading skills for this grade level. Students at this stage ate placed at levels 3 and 4 of the Saeb scale.
Satisfactory. Students dveloped adequate basic leading skills for the 4 grade. At this stage, they are placed at level 5 at the Saeb scale.
Advanced Students developed comprhensive reading skills for this grade level At this stage they are placed at level 6.
As to Mathematics, the situation is not much different. More than 52% of the students have shown a performance considered insufficient or very insufficient. On the other hand, fewer than 7% of the students have shown a performance considered adequate to the 4th grade.
6. Educational profile of the population
The educational system must have as its aim the fostering of higher levels of education for its population, making it able to perform in a critical and responsible way for the building of a fairer, more democratic and more developed society.
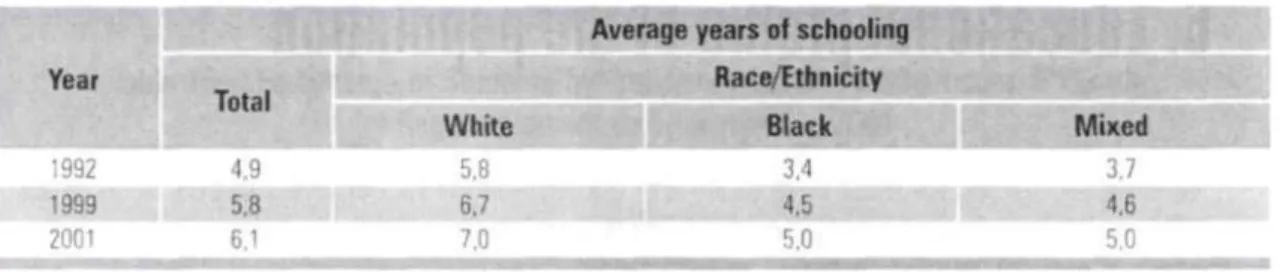
The average schooling of the Brazilian population has progressed from 4.9 years of schooling in 1992, to 6.1 in 2001. However, it is not equal to elementary schooling, that is of 8 years of studies.
The demands of the labor market has shown that those who have secured a job present a school level somewhat above the national average, that is, 6.7 years of studies. The women's average level of schooling has surpassed that of the men, reaching 6.2 in 2001. Among the employed women, the demands of schooling has made them reach the average of 7.3 years, surpassing men in one year of schooling.
Table 17 - Average Number of Years of Schooling for the Population Aged 10 years-old and above, Total and Employed, by Gender - Brazil - 1992-2001
Year
Total
1992 1,9
-1999 58
2001 6,1 Total
Man
4.8 5,6 5.9
Average of years of schooling
Employed Woman Total Man
4,9 5.3 5.1 5,9 6,3 5,9 6.2 0.7 6,3
Woman 5.7 6,8 7.3
In Brazil, we observe deep racial inequalities. Race/ethnicity inequalities are shown in a perverse way. The average schooling of the white population reaches 7 years of studies while blacks and mixed background have on average 5 years of schooling.
Table 18 - Average Years of Schooling for the Population 10 years-old and above,
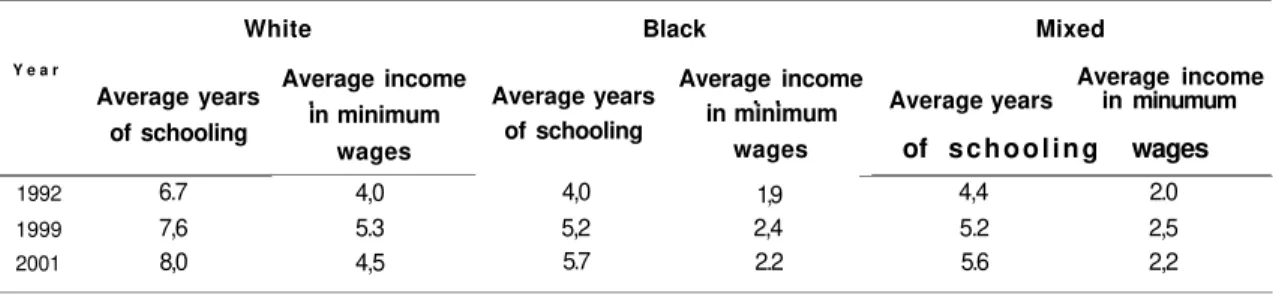
But the most discriminating factor related to schooling is associated to poverty, showing that low income families are almost out of formal education. When one associates the average income of the population to the race/ethnicity factor, this question is more sorely evident. Among the employed population, the average schooling among blacks and mixed background does not reach 6 years of schooling, with an average of monthly income around two times the mirimum wage. It should be noticed that this is still a privileged group of a society under high unemployment. Among the employed white population, the average schooling is 8 years (equal to the compulsory schooling) and their monthly average income is 4.5 times the minimal wage. Another evidence shown in Table 19 is that, despite the increase in number of average schooling between 1999 and 2001, there was a decrease in income for all groups, which shows that more schooling does not necessarily imply in better incomes.
Table 19 - Average Years of Schooling and Income for the Employed Population, by Race/Ethnicity - Brazil - 1992-2001
1992 1999 2001 6.7 7,6 8,0 4,0 5.3 4,5 4,0 5,2 5.7 1,9 2,4 2.2 4,4 5.2 5.6 2.0 2,5 2,2
According to the data above and while structural changes do not occur in the economy, it is important to emphasize the adoption of compensatory public policies as Bolsa-escola Program (stipends to low-income families that enables children to stay in school instead of the labor market and street) and School Meals Program, among others, which favor the permanence of the students in school.
The challenge of quality education for all - Education in Brazil -1990-2000
Employed population by Race/Ethnicity
White Black
Y e a r Average income
Average years . in minimum of schooling
wages
Average income Average years . .
in minimum of schooling
wages
Mixed
Average income Average years in minumum
7. Financing education
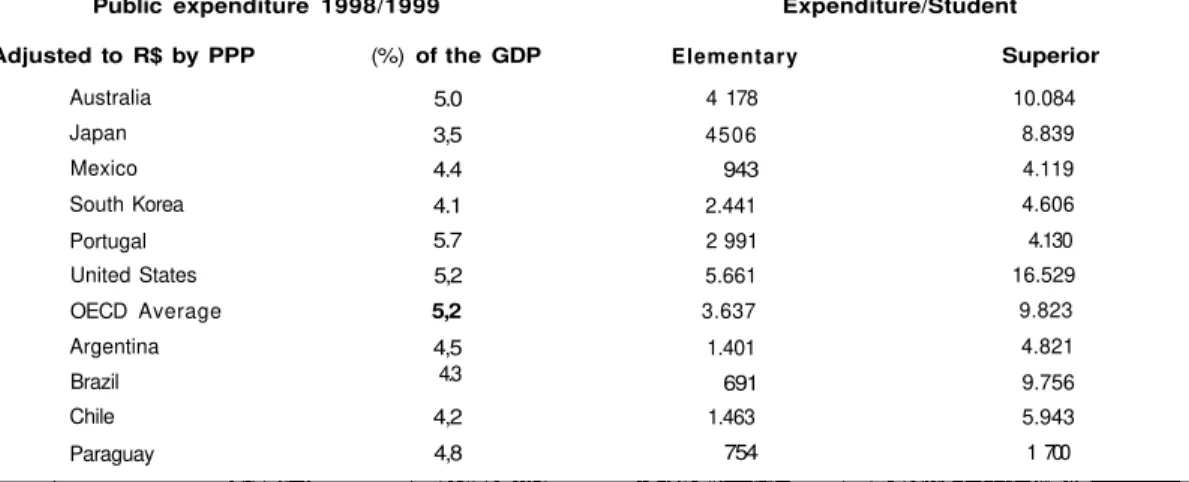
The 1988 Federal Constitution also consolidated the constitutional transfer of funds to education as a portion of the tax revenue. It establishes that a minimal of 18% of the net Federal revenue in taxes and of 25% of the one for the states and municipalities must be spent in the maintenance and development of education. This policy of entailment goes back to the Federal Constitution of 1934, excepting for the dictatorial periods (1937-1945 and 1967-1983). Despite the huge progress it represented in securing a stable source for financing education, its capacity for ensuring money to face new educational challenges presented below has been undermined. This is a result of the low economical growth of the recent years and of a tax policy that gradually diminished the participation of the taxes in the composition of the country revenue burden. As an example, while the income from taxes and contributions grew 187% from 1995 to 2002, the expenditure of the Ministry of Education - MEC grew only 84%. Table 20 shows a comparison among different countries.
Table 20 - Public Expenditure on Education - 1999
Public expenditure 1998/1999
Adjusted to R$ by PPP (%) of the GDP
Australia Japan Mexico South Korea Portugal United States OECD Average Argentina Brazil Chile Paraguay 5.0 3,5 4.4 4.1 5.7 5,2 5,2 4,5 4.3 4,2 4,8 Expenditure/Student Elementary 4 178 4506 943 2.441 2 991 5.661 3.637 1.401 691 1.463 754 Superior 10.084 8.839 4.119 4.606 4.130 16.529 9.823 4.821 9.756 5.943 1 700
The data show that, except for Japan, public expenditure in developed countries is around 5% and 6% of the GDP - Gross Domestic Product, while in developing countries they stay between 4% and 5% of the GDP
Even though Brazilian expenditure on education in relation to the GDP is not different from the countries listed, in view of the low value of the Brazilian GDP per capita, the expenditure/student at elementary school is one of the smallest ones. As to tertiary education, the expenditure/student are higher because the public system of tertiary education, while using up to 21 % of the total funds spent on education, accounts for a much smaller number of students than the one attending basic education. This guarantees a different quality and explains why the public universities concentrate the largest part of the scientific production and Master and Ph D courses in the country, or why the relation candidate/ vacancy for the public tertiary education courses, in 1999, was of 8.3 against a ratio of 2.3 in the private sector.
An important change in the financing system of education in the country happened with the implementation of the Fund for the Maintenance and Development of Primary Education and Enhancement of the Teaching Career (Fundef), in 1998. According to it, at least 60% of the resources allocated to education should be spent in primary education. The implementation of this fund had an equalizing
effect on the States, once it managed to reduce the discrepancies which existed in the standard of service among the municipalities and state education systems. But this sub-entailment ended up causing lack of interest in investments in chilhood and secondary education, sectors where there is a large demand not attended in the country. Finally, the implementation of this fund did not manage, in fact, neither to improve the salaries levels and teachers career paths nor to reduce the differences among regions in the Country. On Table 21 it can be seen that teachers, when compared to a large number of professions, are the ones earning the lowest salaries, or even that, in spite of Fundef, a teacher from the Northeast earns less than half the salary of the one from his colleague from the Southeast.
Table 21 - Average Monthly Income and Number of Professionals According to Type of Profession for Geographical Regions and Brazil - 2001
in R$ 1.00
Type of Professionals
Preprimaiy teacher 1" to 4* grades teacher 5" to 8 ' grades teacher
Education personnel other than teachers with Tertiary education
Secondary education teachei
Noncomissioned officer to the Armed Forces Research professor
Public administrative personnel Business manager
Public technician with tertiary education Civil police Military officer Economist Auditor Lawyet University professor Police Sheriff - official appraiser Doctor Judge Number of professionals in Brazil 201 232 881.623 521.268 139.575 348.831 517.038 6 448 316.761 502.895 421.318 72.743 89.387 44 772 68.870 271 241 136.977 13.973 257.414 10.036
Average income by geographical
Brazil 423 462 600 849 866 869 899 912 1 2( 3 1.311 1.511 2.092 2.255 2.408 2 I97 2.565 2.661 2.973 8 321 North 359 443 601 753 826 818 215 661 987 1.054 1.344 2.129 1.701 3.513 3 894i 1.800 2.754 4.430 5 905 Northeast Southeast 233 293 373 550 628 724 1.150 679 775 794 1.320 1.674 2 . 0 0 9 1.585 2.245 2.252 1 347 2.577 8.039 522 599 793 1.093 979 986 947 1.072 1 411 1.587 1.458 2.251 2,227 2588 2;431 3.087 2.651 2.802 9.018 regions South 436 553 634 738 804 747 713 926 1 058 1.308 1.488 1.950 1 641 1.986 2.597 2.123 3.714 3.260 9.750 Center-W e s t
750 567 594 835 • 872 911 875 1.103 1 124 1.877 2.087 2.321 3.593 3.134 2.768 2190 5 970 4.111 7.331
Source: National Research by Home Sampling (Pnad 2001 NB ( 1 ) Values in R$ September 2.
It is expected that in order to comply with the Education National Plan would take up to 7% of GDP. If this happens it could guarantee the resources needed to provided a public education with quality.
8. Challenges for quality education for all
This diagnosis about the Brazilian education shows that, the federal, state and municipalities face a huge challenge in order to comply with the objectives and goals established by the National Education Plan (NEP) by the year 2011. To the NEP we added, the goals established in the Pluriannual Plan (PAP), in which the educational goals of the Ministry of Education are included. All these objectives and goals are listed below and demonstrate the dimension of the challenges Brazil faces over the next few years, and make it clear that without additional funding, there is little chance they will ever be reached.
8.1. Major goals of the National Education Plan (from 2001)
Early Childhood Education
• Ensuring enrollment to 30% of the children up to the age of 3 within 5 years; • Ensuring enrollment to 50% of the children up to age of 3 within 10 years; • Ensuring enrollment to 60% of the children aged 4 to 6 within 5 years;
• Ensuring enrollment to 80% of the children aged 4 to 5, and an enrollment of 100% at the age of 6 within 10 years;
• Providing schools having a minimal of adequate infrastructure within 5 years;
• Ensuring, at least, all the teachers of early childhood education with secondary education qualification provided by Teachers' Training Schools, within 5 years;
• Ensuring, at least, all the teachers of early childhood education with tertiary education qualification, within 10 years;
• Providing, in 100% of the municipalities, an structure for supervising Children's Education, within 3 years;
• Ensuring school meals for every child enrolled in the public early childhood education system; • Expanding, progressively to a full-time period the education programs.
Elementary School
• Expand to a 9 years period the Elementary Education, starting from the age of 6; • Providing schools with minimal adequate infrastructure, within 5 years;
• Ensuring the Program of Minimal Income for Low-income families (stipends to low-income families that enables children to stay in classrooms and playgrounds, and stay off the labor market and street);
• Provide education services in schools at most over 2 daytime periods and 1 night time period; • Progressively expand the education in school to , at least, a 7-hour-day period;
• Promoting gradually the reduction of the night classes shift.
Secondary School
• Attend at least 50% the demand for secondary education within 5 years; • Attend 100% the demand for secondary education within 10 years; • Ensuring tertiary qualification for all the teachers, within 5 years;
• Ensuring schools with minimal of adequate infrastructure, within 5 years;
• Promote specific teachers qualification programs to attend the demand of teachers of secondary education, especially in the areas of Sciences and Mathematics.
Tertiary Education
• Providing, up to the end of the decade, access to at least 30% of the 18 to 24 year old population.
• Promote the annual increase in the number of masters and doctors graduates in at least 5%.
Adult Education
• Eliminating adult illiteracy within 10 years;
• Ensuring the offer of Adult Education for the 1st to the 4th grade of elementary school to 50% of
the population aged 15 and above, within 5 years;
• Ensuring the offer of Adult Education the 5th to 8th grade of elementary school for 100% of the
population aged 15 and above completing the 4th grade, within 10 years;
• Doubling the capacity to offer Adult Education for the secondary education level, within 5 years; • Expand four times the capacity to offer Adult Education for the secondary education level,
within 10 years;
• Implementing, in all prison units and in all the institutions treating troubled youth and law violators youngsters, programs of Adult Education for the Elementary and Secondary Levels, as well as qualifications aiming at the labor market.
Special Education
• Ensuring enrollment to all the students with special needs in Elementary School, within 10 years; • Ensuring adapted schools, with a minimal adequate infrastructure, within 5 years;
• Increasing funding destined to special education so that it may reach 5% of the resources entailed to education, within 10 years.
8.2. Ministry of Education Programs Established in the Pluriannual Plan 2004-2007
• Enhancement and qualification of the education personnel; • Enhancement and qualification of teachers;
• University of the 21st Century;
• Democratic Management for the Education Systems;
• Sustainability for the education: modern management and increased financing;
• The ideal basic school (enhancement of the implementation of the major education policies in selected municipalities throughout the country);
• A school open to the public promoting citizenship; • Education in Infancy;
• Modern school (renovation and pedagogical equipment for all levels of education); • Democratizing the access to the tertiary and to professional qualification;
• A literate Brazil; • An educated Brazil.
References*
BRAZIL. Ministry of Education, www.mec.gov.br
CARACTERIZAQAO fisica das escolas. Brasilia: Inep, 1999. PISA 2000: relatorio nacional. Brasilia: Inep, 2001.
QUALIDADE da educaçao: uma nova leitura do desempenho dos estudantes da 4a serie do ensino
fundamental. Brasilia: Inep, 2003.
SAMPAIO, Carlos Eduardo Moreno et al. Sincronismo idade/serie: urn indicador de produtividade do sistema educacional brasileiro. Brasilia: Inep, 2002. (Serie Documental. Relatos de Pesquisa. Texto para Discussao, n. 11).
*AII the publications mentioned in this work can be obtained at this address: www.inep.gov.br
Instituto National Ministerio de Estudos e Pesquisas