A Universidade do Porto no Performance Ranking of
Scientific Papers for World Universities –
National Taiwan University NTU Ranking 2015
Reitoria da Universidade do Porto >> Serviço de Melhoria Contínua. 15 de outubro de 2015 Versão 2_16 de outubro 2015 (A versão 2 acrescenta Notas adicionais, p. 5)
Sumário
1. Metodologia do NTU Ranking e participação da U.Porto ... 3
2. Evolução das posições da U.Porto no NTU Ranking ... 6
2.1 Overall Ranking ... 6 2.2 Rankings by Field ... 7 2.2.1 Agriculture ... 8 2.2.2 Engineering ... 9 2.2.3 Life Sciences ... 10 2.2.4 Natural Sciences ... 11 2.3 Rankings by Subject ... 12 2.3.1 Physics ... 13 2.3.2 Chemistry ... 13 2.3.3 Electrical Engineering ... 14 2.3.4 Computer Science ... 15 2.3.5 Mechanical Engineering ... 16 2.3.6 Chemical Engineering ... 17 2.3.7 Materials Science ... 18 2.3.8 Civil Engineering ... 19 2.3.9 Agricultural Sciences ... 20 2.3.10 Environment/Ecology ... 21
3. Posição das Universidades portuguesas no NTU Ranking ... 24 3.1 Overall Ranking ... 24 3.2 Rankings by Field ... 25 3.2.1 Agriculture ... 26 3.2.2 Engineering ... 26 3.2.3 Life Sciences ... 26 3.2.4 Natural Sciences ... 26 3.3 Rankings by Subject ... 27 3.3.1 Physics ... 28 3.3.2 Chemistry ... 28 3.3.3 Mathematics ... 28 3.3.4 Geosciences ... 29 3.3.5 Electrical Engineering ... 29 3.3.6 Computer Science ... 29 3.3.7 Mechanical Engineering ... 29 3.3.8 Chemical Engineering ... 29 3.3.9 Materials Science ... 30 3.3.10 Civil Engineering ... 30 3.3.11 Agricultural Sciences ... 30 3.3.12 Environment/Ecology ... 30
3.3.13 Plant & Animal Science ... 31
3.3.14 Pharmacology &Toxicology ... 31
Anexo 1 - Metodologia do NTU Ranking by Field ... 32
A Universidade do Porto no Performance Ranking of Scientific
Papers for World Universities – NTU Ranking 2015
http://nturanking.lis.ntu.edu.tw/
1. Metodologia do NTU Ranking e participação da U.Porto
“The “Performance Ranking of Scientific Papers for World Universities” is released by National Taiwan University, and is also known as NTU Ranking. NTU Ranking provides overall ranking, rankings by six fields, and rankings by 14 selected subjects.
[…]
Sample Selection
This ranking system employs bibliometric methods to analyze and rank the scientific paper performances of the world’s top 500 universities. The selection of the 500 universities for inclusion in this ranking system was based on information obtained from the Essential Science Indicators (ESI). Of more than 4,000 research institutions listed in ESI, this ranking system first selected the top 700 institutions based on the numbers of published journal articles and numbers of citations. Non-university institutions were then removed from the list, and the project staff compared the remaining universities to those included in other ranking programs such as ARWU, THE, QS, and U.S. News. This resulted in 924 universities for this ranking system. Data used to assess the performances of the universities was drawn from ISI’s ESI and Web of Science Core Collection (WOS), which includes SCI and SSCI, and Journal Citation Reports (JCR).
The concept of authority control was employed to retrieve data indexed under different forms of a university’s name in the aforementioned databases – i.e. the official name, the abbreviated name and other possible forms of the name. This ranking system also considered the merging and splitting of universities (or different campuses in a university system) and included publications by university-affiliated institutions such as research centers and university hospitals. This effort ensured the accuracy of each university’s number of published journal articles and the subsequent citation statistics.
Some university systems have several campuses. A few campuses within a particular university system may have been commonly perceived as individual institutions. However, they are indexed in ESI only by the university system name. For example, the University of Connecticut system includes a main campus in Storrs and five regional campuses throughout the state. Furthermore, it also contains the Schools of Medicine and Dental Medicine at UConn Health in Farmington. These are all indexed under “University of Connecticut” in ESI.
This ranking system corrected this flaw by manually searching SCI/SSCI in order to identify the actual number of articles and citations of these articles produced by each individual campus. Likewise, this ranking system employed the same manual searching procedures to ensure that the measurement of each university’s Highly Cited Papers fairly represented the research performance of each individual campus.
The reader may notice that the publications counting method for some institutions in ESI changed this past year, and some universities and their affiliated institutions are now considered as single
institutions where they were previously considered separate institutions. This led to an increase in the number of published journal articles. Moreover, journal articles are now indexed by publication year instead of database year. These two changes will affect our ranking results.
Indicators
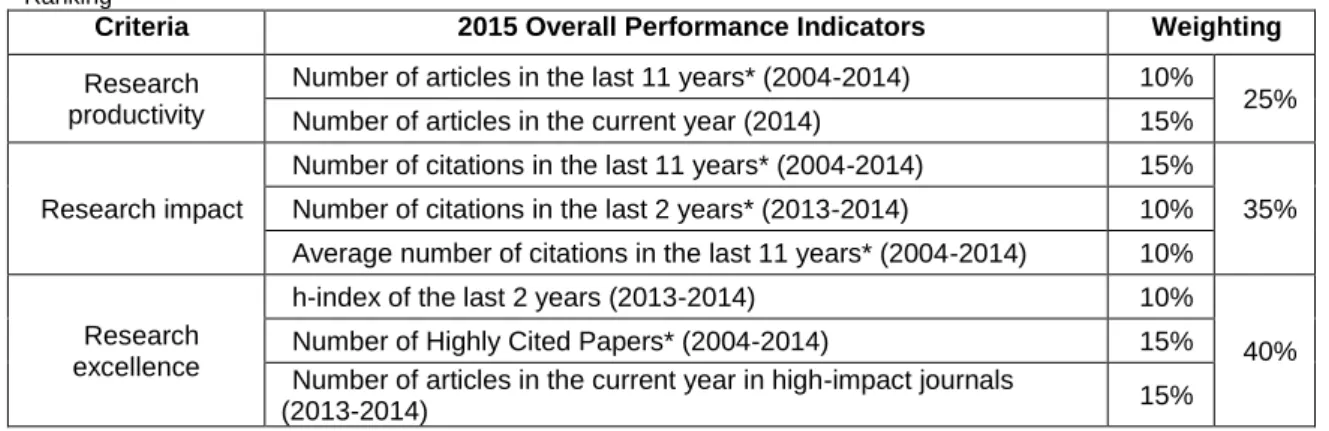
The 2015 performance measures are composed of eight indicators. These indicators together represent three different criteria of scientific paper performance: research productivity, research impact, and research excellence. Table 1 lists the indicators and shows the respective weightings for each indicator.
Table 1 The Criteria and Indicators, and Their Respective Weightings, Used for the Overall Performance-Based Ranking
Criteria 2015 Overall Performance Indicators Weighting
Research productivity
Number of articles in the last 11 years* (2004-2014) 10%
25% Number of articles in the current year (2014) 15%
Research impact
Number of citations in the last 11 years* (2004-2014) 15%
35% Number of citations in the last 2 years* (2013-2014) 10%
Average number of citations in the last 11 years* (2004-2014) 10%
Research excellence
h-index of the last 2 years (2013-2014) 10%
40% Number of Highly Cited Papers* (2004-2014) 15%
Number of articles in the current year in high-impact journals
(2013-2014) 15%
*Note: The timeframe of the three long-term indicators is consistent with that in ESI, providing cumulative data for the last 11 years.
Indicator Definition Research Productivity:
The number of articles published in peer-reviewed academic journals is frequently used to indicate the productivity of a research institution. To objectively represent a university’s current and on-going research productivity, this ranking system employs two indicators: the number of articles in the last 11 years (2004-2014), and the number of articles in the current year (2014).
“Number of articles in the last 11 years” draws data from ESI, which includes 2004-2014 statistics articles published in journals indexed by SCI and SSCI. “Number of articles in the current year” relies on the 2014 data obtained from SCI and SSCI, which were extracted in April, 2015. We used to extract data in every January, but after a yearly observation, we discovered that papers published in 2012 would continue to be indexed by the databases into early 2013. Accordingly, we decided to postpone the data extraction time to April so the data would be more complete.
Research Impact:
The number of citations of a particular academic article within a specific time frame is a commonly accepted indicator for that article’s impact. This ranking system considers both the long-term and short-term impact of a particular research and seeks to provide a fairer representation of a university’s research impact regardless of its size or faculty number. Thus, this ranking system measures research impact by the number of citations in the last 11 years, the number of citations in the last 2 years, and the average number of citations in the last 11 years.
“Number of citations in the last 11 years” draws 2004-2014 citation statistics from ESI. “Number of citations in the last 2 years” draws 2013-2014 citation statistics from SCI and SSCI in WOS, which include citation statistics updated to the dates of retrieval. “Average number of citations in the last 11 years” is the number of citations in the last 11 years divided by the number of articles in the last 11 years.
Research Excellence:
This ranking system assesses each university’s research excellence by the following indicators: the h-index of the last 2 years, the number of Highly Cited Papers from ESI, and the number of articles in the current year in high-impact journals (Hi-Impact journal articles). “h-index of the last 2 years” measures both the quantity and quality of a university’s research via the use of the 2013-2014 SCI and SSCI data. Employing Hirsch’s (2005) concept of h-index , a university has index h if h of its Np papers in the last two years have at least h citations each and the other (Np – h) papers have ≦h citations each.
“Number of Highly Cited Papers” utilizes data from ESI, which includes statistics of “Highly Cited Papers” from 2004 to 2014. ESI defines Highly Cited Papers as SCI/SSCI-indexed papers that are cited most (in the top 1% of the total papers indexed in the same year) within the last 11 years.
“Number of articles in the current year in high-impact journals” employs data from JCR, which supplies the impact factor of each journal in its subject field. The impact factor of a journal is the number of citations of the papers published in that particular journal within the previous two years divided by the number of that journal’s papers within the previous two years. A journal with a higher impact factor means that journal has articles more frequently cited by other journals, thus suggesting its higher scholarly value. This ranking system defines high-impact journals as those whose impact factors are ranked in the top 5% of the total journals within a specific subject category. With high-impact journal lists derived from JCR, this ranking system is able to count the numbers of each university’s articles published in high-impact journals by subject.
Reference Rankings
Adjusted reference ranking is presented to balance the overall ranking, which favors universities with greater number of faculty members. Four indicators significantly affected by university size are normalized by each university’s number of full-time faculty; these include the number of articles in the last 11 years, number of articles in the current year, number of citations in the last 11 years, and the number of citations in the last 2 years. This ranking system employs faculty numbers obtained from the following sources (listed by priority in usage): numbers of full-time faculty obtained from university official websites, numbers of faculty registered with each higher education administration, and numbers of academic staff of each university obtained from university websites.
Calculation Method
The procedures for data processing are as follows: First, the project staff conducted authority control on the various forms of a university name and inspected all the SCI/SSCI bibliographic records in which the address field contained a form of the university name. An accurate number of the total articles from a university was obtained after removing duplicate records containing different forms of that university’s name. Second, using SCI/SSCI this ranking system obtained the total number of citations by adding the number of citations of each article from that university, from the article’s inclusion in SCI/SSCI to the date of our retrieval.
Based on the measurement procedures, this ranking system calculated a university’s score for each of the eight indicators. From 2013, the indicator “h-index of the last 2 years” has been further adjusted and differentiated utilizing number of papers and cited times for the field-based and subject-based rankings, due to highly concentrated distribution of h-index. Then, all indicators are normalized using T-score to obtain finalized score. Finally, the ranking system calculates the final score of each university using the indicator weightings presented in Table 1 and sorts the universities by their final scores. Universities with the same scores are sorted alphabetically. It should be noted that many universities obtained similar scores, and the slight differences in the final scores must be interpreted carefully. A university having a slightly higher score than another may not necessarily suggest its superiority in scientific research, as the two universities might be in very close proximity in the ranking.”1
Notas adicionais:
A National Taiwan University não solicita informação às Universidades.
A National Taiwan University no Overall Ranking lista 500 Universidades.
Os Rankings by Field e by Subject listam 300 Universidades. Por razão de empate no
overall score, poderão ser mais.
2. Evolução
2das posições da U.Porto no NTU Ranking
2.1 Overall Ranking
2007 2008 2009 2010 2011 2012 2013 2014 2015 Ranking Mundial 459 375 332 328 320 318 296 279 269 Ranking Europeu 195 161 140 141 141 137 126 120 115 Ranking Ibero-americano 10 11 9 8 10 10 9 9 Ranking Nacional 1 1 1 1 1 1 1 2 2Scores 2014-2015
2014 2015 World Rank 279 269 Total Score 50,4 51,1 11 Years Articles 53,1 54,0 Current Articles 56,8 56,6 11 Years Citations 49,3 50,0 Current Citations 50,4 51,8 Ave. Citations 45,8 46,5 H-Index 48,7 49,2 HiCi Papers 48,2 48,5Hi-Impact Journal Articles 49,8 51,4
Ref. Rank (normalized by number of faculty) 266 251
2 Dados até 2013 retirados de “Evolução das posições da Universidade do Porto nos rankings universitários”, janeiro de
2014, in https://sigarra.up.pt/up/pt/conteudos_service.conteudos_cont?pct_id=20113&pv_cod=55GoHdmanvIq ; dados de 2014 e 2015 foram retirados de http://nturanking.lis.ntu.edu.tw respetivamente em 10 de outubro de 2014 e 12 de outubro de 2015.
2.2 Rankings by Field
Na edição de 2015, à semelhança de 2014, a U.Porto surge em 4 dos 6 Rankings by Field.
A metodologia dos Rankings by Field é apresentada no Anexo1.2008 2009 2010 2011 2012 2013 2014 2015 Agriculture World 253 199 181 159 147 119 117 106 Europe 102 72 67 61 56 42 42 35 Iberoam n/d n/d n/d n/d n/d n/d n/d 7 PT 1 1 1 1 1 1 2 2
Clinical Medicine World -- -- -- -- -- -- -- --
Engineering World -- 257 218 165 164 170 156 157 Europe 91 67 46 43 50 38 35 Iberoam n/d n/d n/d n/d n/d n/d 3 PT 3 3 2 1 2 2 2 Life Sciences World -- -- 283 290 296 262 226 226 Europe 118 125 125 110 97 99 Iberoam n/d n/d n/d n/d n/d 6 PT 1 1 1 1 1 1 Natural Sciences World -- -- 285 226 212 276 281 261 Europe 129 100 90 121 124 115 Iberoam n/d n/d n/d n/d n/d 11 PT 2 2 1 2 2 2
Social Sciences World -- -- -- -- -- -- -- --
2.2.1 Agriculture
2014 2015 Total Score 54,5 55,7 11 Years Articles 56,8 59,0 Current Articles 62,2 63,6 11 Years Citations 52,0 53,9 Current Citations 58,0 60,3 Ave. Citations 43,3 43,3 H-Index 55,2 52,9 HiCi Papers 50,5 52,1Hi-Impact Journal Articles 56, 58,3
2.2.2 Engineering
2014 2015 Total Score 51,5 51,9 11 Years Articles 51,8 52,3 Current Articles 54,6 53,2 11 Years Citations 50,2 51,5 Current Citations 54,3 53,6 Ave. Citations 46,4 47,6 H-Index 51,2 53,5 HiCi Papers 50,7 49,6Hi-Impact Journal Articles 51,8 54,0
2.2.3 Life Sciences
2014 2015 Total Score 48,9 49,0 11 Years Articles 49,1 49,8 Current Articles 55,8 55,5 11 Years Citations 46,9 47,1 Current Citations 49,4 50,8 Ave. Citations 42,2 41,8 H-Index 50,3 48,4 HiCi Papers 46,7 46,9Hi-Impact Journal Articles 49,5 49,9
2.2.4 Natural Sciences
2014 2015 Total Score 47,4 48,7 11 Years Articles 48,8 50,2 Current Articles 51,5 51,3 11 Years Citations 47,6 49,0 Current Citations 46,5 48,5 Ave. Citations 46,8 47,7 H-Index 47,2 47,5 HiCi Papers 45,2 45,6Hi-Impact Journal Articles 45,3 49,6
2.3 Rankings by Subject
Na edição de 2015, a U.Porto surge em 12 dos 14 Rankings by Subject (11 em 2014).
A metodologia dos Rankings by Subject é apresentada no Anexo 2.2010 2011 2012 2013 2014 2015 Physics World 243 225 251 -- -- 294 Europe 109 103 114 137 Iberoam n/d n/d n/d 18 PT 2 2 2 2 Chemistry World 242 179 124 150 151 162 Europe 103 70 37 48 49 54 Iberoam n/d n/d n/d n/d n/d 9 PT 2 1 1 1 2 2 Mathematics World -- -- -- -- -- -- Geosciences World -- -- -- -- -- -- Electrical Engineering World -- -- -- 209 209 234 Europe 62 63 70 Iberoam n/d n/d 11 PT 2 2 2 Computer Science World 297 299 215 250 215 209 Europe 112 117 75 91 65 66 Iberoam n/d n/d n/d n/d n/d 12 PT 1 2 2 2 2 2 Mechanical Engineering World 62 47 30 92 65 80 Europe 17 13 7 28 19 25 Iberoam n/d n/d n/d n/d n/d 2 PT 1 1 1 1 2 2 Chemical Engineering World 85 58 60 64 69 76 Europe 20 16 12 13 14 15 Iberoam n/d n/d n/d n/d n/d 3 PT 1 1 1 1 1 1 Materials Science World 255 239 291 226 218 195 Europe 90 80 97 66 62 50 Iberoam n/d n/d n/d n/d n/d 5 PT 3 3 3 3 3 3 Civil Engineering World 126 97 67 54 50 59 Europe 36 25 16 14 13 14 Iberoam n/d n/d n/d n/d n/d 3 PT 2 1 1 1 2 2 Agricultural Sciences World -- 66 57 47 69 62 Europe 24 19 15 24 19 Iberoam n/d n/d n/d n/d 5 PT 1 1 1 1 1 Environment/Ecology World -- 192 185 163 126 117 Europe 65 61 56 47 43 Iberoam n/d n/d n/d n/d 6 PT 1 1 1 2 2
Plant & Animal
World -- -- 277 196 160 138 Europe 127 86 68 57 Iberoam n/d n/d n/d 11 PT 2 1 2 2 Pharmacology &Toxicology World -- -- 206 149 87 99 Europe 79 54 32 38 Iberoam n/d n/d n/d 3 PT 1 1 1 1
2.3.1 Physics
2014 2015 Total Score 47,8 11 Years Articles 46,3 Current Articles 47,4 11 Years Citations 47,8 Current Citations 46,4 Ave. Citations 55,6 H-Index 47,9 HiCi Papers 46,0Hi-Impact Journal Articles 46,7
World Rank -- 294 -- não consta
2.3.2 Chemistry
2014 2015 Total Score 52,2 51,9 11 Years Articles 56,5 57,4 Current Articles 61,3 57 11 Years Citations 51,2 52,6 Current Citations 53,6 51,8 Ave. Citations 43,2 44 H-Index 53 49,5 HiCi Papers 46,7 47Hi-Impact Journal Articles 51,3 54,6
2.3.3 Electrical Engineering
2014 2015 Total Score 49,5 48,9 11 Years Articles 47,5 47,8 Current Articles 49,4 47,9 11 Years Citations 47,2 48,3 Current Citations 50,8 49,2 Ave. Citations 47,8 50,8 H-Index 57,1 47,8 HiCi Papers 46,1 47,3Hi-Impact Journal Articles 51,7 52,3
2.3.4 Computer Science
2014 2015 Total Score 49,1 49,2 11 Years Articles 48,9 49,3 Current Articles 51,4 54,1 11 Years Citations 47,1 47,5 Current Citations 51,1 48,6 Ave. Citations 47,2 46,9 H-Index 58,8 51,2 HiCi Papers 45,9 45,7Hi-Impact Journal Articles 45,6 50,3
2.3.5 Mechanical Engineering
2014 2015 Total Score 59,8 57,7 11 Years Articles 57,5 57,7 Current Articles 60,0 56,3 11 Years Citations 58,7 59,3 Current Citations 71,8 66,7 Ave. Citations 54,0 53,5 H-Index 68,1 64,6 HiCi Papers 53,5 53,3Hi-Impact Journal Articles 58,7 54,3
2.3.6 Chemical Engineering
2014 2015 Total Score 59,1 58,4 11 Years Articles 62,1 62,2 Current Articles 62,0 59,1 11 Years Citations 63,3 65,4 Current Citations 62,4 59,7 Ave. Citations 51,4 54,0 H-Index 61,4 57,5 HiCi Papers 55,9 52,6Hi-Impact Journal Articles 54,7 56,7
2.3.7 Materials Science
2014 2015 Total Score 49,0 49,5 11 Years Articles 49,9 49,9 Current Articles 50,4 49,4 11 Years Citations 48,6 48,6 Current Citations 48,9 49,5 Ave. Citations 46,5 46,5 H-Index 51,1 53,7 HiCi Papers 48,1 46,2Hi-Impact Journal Articles 48,4 52,7
2.3.8 Civil Engineering
2014 2015 Total Score 62,2 59,4 11 Years Articles 57,5 58,6 Current Articles 63,6 60,8 11 Years Citations 59,7 61,7 Current Citations 69,9 61,8 Ave. Citations 53,2 54,0 H-Index 60,8 58,8 HiCi Papers 65,7 57,9Hi-Impact Journal Articles 64,8 60,4
2.3.9 Agricultural Sciences
2014 2015 Total Score 58,6 59,8 11 Years Articles 57,3 58,2 Current Articles 60,9 60,8 11 Years Citations 59,0 60,6 Current Citations 61,9 63,9 Ave. Citations 49,4 49,1 H-Index 56,3 61,1 HiCi Papers 59,9 62,9Hi-Impact Journal Articles 61,1 59,3
2.3.10 Environment/Ecology
2014 2015 Total Score 54.0 55.1 11 Years Articles 57.7 60.8 Current Articles 61.3 64.5 11 Years Citations 50.9 52.8 Current Citations 55.6 56.4 Ave. Citations 43.2 43.1 H-Index 57.1 55.2 HiCi Papers 52.4 54.3Hi-Impact Journal Articles 53.3 52.3
2.3.11 Plant & Animal Science
2014 2015 Total Score 51,3 52,6 11 Years Articles 54,3 55,6 Current Articles 58,4 58,8 11 Years Citations 49,3 50,2 Current Citations 54,5 56,0 Ave. Citations 42,2 41,9 H-Index 55,1 52,5 HiCi Papers 45,5 45,5Hi-Impact Journal Articles 51,6 58,8
2.3.12 Pharmacology &Toxicology
2014 2015 Total Score 57,3 56,8 11 Years Articles 57,8 59,3 Current Articles 68,2 64,3 11 Years Citations 53,5 55,1 Current Citations 64,3 63,0 Ave. Citations 44,6 45,1 H-Index 68,1 59,0 HiCi Papers 49,9 53,2Hi-Impact Journal Articles 53,7 54,9
3. Posição
3das Universidades portuguesas no NTU Ranking
3.1 Overall Ranking
2007 2008 2009 2010 2011 2012 2013 2014 2015 University of Lisbon 480 411 224 207 University of Porto 459 375 332 328 320 328 296 279 269 University of Coimbra 487 478 433 478 387 368 392New University of Lisbon 477
Minho University 494 470 490
University of Aveiro 487
Universidade Tecnica de Lisboa 353 380 381 380 365
Scores 2015
Total Score 11 Years Articles Current Articles 11 Years Cita-tions Current Cita-tions Ave. Cita-tions H-Index HiCi Papers Hi-Impact Journal Articles Ref. Rank * World Rank Euro rank Ibero am rank PT Rank U.Lisboa 53,4 56,7 60,1 52,0 53,7 48,1 53,7 50,1 52,5 244 207 85 4 1 U.Porto 51,1 54,0 56,6 50,0 51,8 46,5 49,2 48,5 51,4 251 269 115 9 2 U.Coimbra 47,9 48,1 49,5 47,0 48,8 45,9 50,7 46,8 47,2 405 392 168 18 3 UNL 46,7 45,9 46,7 46,0 46,9 46,5 49,9 46,3 46,4 -- 477 199 28 4 U.Minho 46,6 45,5 46,7 46,0 46,7 47,6 47,7 46,5 46,7 -- 490 204 29 5 U.Aveiro 46,4 47,5 48,3 46,4 47,1 44,1 43,9 46,0 46,8 384 -- 212 33 6 #IES 500 222 33 6*(normalized by number of faculty) ; -- Não consta no top 500
3 Dados até 2013 retirados de “Evolução das posições da Universidade do Porto nos rankings universitários”, janeiro de
2014, in https://sigarra.up.pt/up/pt/conteudos_service.conteudos_cont?pct_id=20113&pv_cod=55GoHdmanvIq ; dados de 2014 e 2015 foram retirados de http://nturanking.lis.ntu.edu.tw respetivamente em 10 de outubro de 2014 e 12 de outubro de 2015.
3.2 Rankings by Field
Estão presentes Universidades portuguesas em 4 dos 6 Rankings by Field. A metodologia dos Rankings by Field é apresentada no Anexo1.
World Rank by FIELD 2008 2009 2010 2011 2012 2013 2014 2015 Agriculture U.Porto: 253 U.Porto: 199 UTL: 256 U.Aveiro: 299 U.Porto: 181 UTL: 277 U.Aveiro: 287 U.Porto: 159 U.Aveiro: 252 UTL: 288 U.Porto: 147 UTL: 264 U.Porto: 119 UTL: 201 U.Aveiro: 294 U.Lisboa: 103 U.Porto: 117 U.Aveiro:26 9 U.Lisboa: 95 U.Porto: 106 U.Aveiro:248 UNL: 291 Clinical Medicine - - - - Engineering U.Aveiro: 171 U.Aveiro: 137 UTL: 189 U.Porto: 257 U.Aveiro: 172 UTL: 183 U.Porto: 218 UTL: 157 U.Porto: 165 U.Aveiro: 168 U.Minho: 291 U.Porto: 164 UTL: 166 U.Aveiro: 180 U.Minho: 296 UTL: 136 U.Porto: 170 U.Aveiro: 173 U.Lisboa: 113 U.Porto: 156 U.Aveiro: 190 U.Minho: 273 U.Lisboa: 104 U.Porto: 157 U.Aveiro: 196 U.Minho: 272 Life Sciences - - U.Porto: 283 U.Porto: 290 U.Porto: 296 U.Porto: 262 U.Porto: 226 U.Porto: 226 U.Lisboa: 293 U.Coimbra: 297 Natural Sciences - UTL: 229 UTL: 230 U.Porto: 285 UTL: 224 U.Porto: 226 U.Porto: 212 UTL: 243 UTL: 229 U.Porto: 276 U.Lisboa: 123 U.Porto: 281 U.Lisboa: 102 U.Porto: 261 Social Sciences - - - -
3.2.1 Agriculture
Total Score 11 Years Articles Current Articles 11 Years Cita-tions Current Cita-tions Ave. Cita-tions H-Index HiCi Papers Hi-Impact Journal Articles World Rank Euro rank Ibero am rank PT Rank U.Lisboa 57,2 60,5 64,7 57,0 62,3 46,0 60,0 52,3 55,1 95 29 5 1 U.Porto 55,7 59,0 63,6 53,9 60,3 43,3 52,9 52,1 58,3 106 35 7 2 U.Aveiro 49,0 51,1 54,9 47,9 53,0 42,3 50,2 45,2 47,5 248 104 18 3 UNL 47,8 44,9 46,9 45,1 48,3 48,2 54,4 47,8 48,4 291 120 25 4 #IES 300 123 25 43.2.2 Engineering
Total Score 11 Years Articles Current Articles 11 Years Cita-tions Current Cita-tions Ave. Cita-tions H-Index HiCi Papers Hi-Impact Journal Articles World Rank Euro rank Ibero am rank PT Rank U.Lisboa 55,6 57,4 61,0 57,8 54,9 49,6 53,6 51,4 56,9 104 17 2 1 U.Porto 51,9 52,3 53,2 51,5 53,6 47,6 53,5 49,6 54,0 157 36 3 2 U.Aveiro 49,9 51,3 50,4 51,6 51,7 49,2 49,9 46,3 49,8 196 53 7 3 U.Minho 47,4 47,7 48,1 47,9 47,7 48,5 46,6 44,9 48,1 272 84 14 4 #IES 300 99 16 43.2.3 Life Sciences
Total Score 11 Years Articles Current Articles 11 Years Cita-tions Current Cita-tions Ave. Cita-tions H-Index HiCi Papers Hi-Impact Journal Articles World Rank Euro rank Ibero am rank PT Rank U.Porto 49,0 49,8 55,5 47,1 50,8 41,8 48,4 46,9 49,9 226 99 6 1 U.Lisboa 47,3 46,7 49,9 46,3 47,8 44,6 48,2 46,4 48,1 293 127 12 2 U.Coimbra 47,2 45,3 46,9 46,1 47,5 48,7 49,4 47,2 47,2 297 129 13 3 #IES 300 131 13 33.2.4 Natural Sciences
Total Score 11 Years Articles Current Articles 11 Years Cita-tions Current Cita-tions Ave. Cita-tions H-Index HiCi Papers Hi-Impact Journal Articles World Rank Euro rank Ibero am rank PT Rank U.Lisboa 56,0 61,6 64,4 56,0 55,8 46,1 53,9 51,8 56,3 102 35 3 1 U.Porto 48,7 50,2 51,3 49,0 48,5 47,7 47,5 45,6 49,6 261 115 11 2 #IES 300 136 14 23.3 Rankings by Subject
Estão presentes Universidades portuguesas em todos os Rankings by Subject. A metodologia dos Rankings by Subject é apresentada no Anexo 2.
World Rank by SUBJECT 2010 2011 2012 2013 2014 2015 Physics UTL: 189 U.Porto: 243 UTL: 198 U.Porto: 225 UTL: 226 U.Porto: 251 UTL: 230 U.Lisboa: 136 U.Lisboa: 134 U.Porto: 294 Chemistry UTL: 225 U.Porto: 242 U.Aveiro: 256 U.Porto: 179 UTL: 230 U.Aveiro: 253 U.Porto: 124 U.Porto: 150 U.Aveiro: 194 UTL: 229 UNL: 284 U.Lisboa: 148 U.Porto: 151 U.Aveiro: 198 UNL: 250 U.Lisboa: 122 U.Porto: 162 U.Aveiro: 189 UNL: 246 Mathematics UTL: 121 UTL: 148 U.Aveiro: 213 UTL: 120 U.Aveiro: 141 UTL: 135 U.Aveiro: 144 U.Lisboa: 75 U.Aveiro: 149 U.Lisboa: 44 U.Aveiro: 257
Geosciences - - UL: 218 UL: 211 U.Lisboa: 126 U.Lisboa: 98
Electrical Engineering UTL: 198 U.Minho: 204 U.Minho: 166 UTL: 189 U.Coimbra: 293 UTL: 160 UTL:132 U.Porto: 209 UMinho: 284 U.Lisboa: 126 U.Porto: 209 U.Coimbra: 274 UMinho: 287 U.Lisboa: 127 U.Porto: 234 U.Coimbra: 273 Computer Science U.Porto: 297 UTL: 300 UTL: 191 U.Porto: 299 UTL: 142 U.Porto: 215 UTL: 126 U.Porto: 250 U.Lisboa: 104 U.Porto: 215 U.Lisboa: 104 U.Porto: 209 Mechanical Engineering U.Porto: 62 UTL: 132 U.Aveiro: 138 U.Porto: 47 UTL: 132 U.Aveiro: 152 U.Minho: 223 U.Coimbra: 255 U.Porto: 30 UTL: 107 U.Aveiro: 126 U.Coimbra: 241 U.Porto: 92 UTL: 94 U.Aveiro: 131 U.Coimbra: 264 UMinho:298 U.Lisboa: 59 U.Porto: 65 U.Aveiro: 158 U.Coimbra: 205 U.Lisboa: 47 U.Porto: 80 U.Aveiro: 151 U.Coimbra: 234 Chemical Engineering U.Porto: 85 UTL: 140 U.Aveiro: 181 U.Minho: 250 U.Coimbra: 275 U.Porto: 58 UTL: 136 U.Aveiro: 174 U.Minho: 178 U.Coimbra: 299 U.Porto: 60 U.Aveiro: 150 UTL: 151 U.Minho: 183 U.Porto: 64 UTL: 145 U.Aveiro: 161 U.Minho: 175 UC:263 U.Porto: 69 U.Lisboa: 129 U.Aveiro: 175 U.Minho: 201 U.Coimbra: 250 U.Porto: 76 U.Lisboa: 132 U.Aveiro: 145 U.Minho: 187 U.Coimbra: 256 Materials Science U.Aveiro: 102 U.Minho: 246 U.Porto: 255 UTL: 276 U.Aveiro: 120 U.Minho: 221 U.Porto: 239 UTL: 279 U.Aveiro: 131 U.Minho: 214 U.Porto: 291 U.Aveiro: 114 U.Minho: 215 U.Porto: 226 U.Aveiro: 122 U.Lisboa: 207 U.Porto: 218 U.Minho: 218 U.Aveiro: 147 U.Lisboa: 191 U.Porto: 195 U.Minho: 214 Civil Engineering UTL: 109 U.Porto: 126 U.Minho: 278 U.Porto: 97 UTL: 115 U.Aveiro: 227 U.Minho: 240 UNL: 247 U.Porto: 67 UTL: 90 U.Minho: 241 U.Coimbra: 248 UNL: 253 U.Aveiro: 295 U.Porto: 54 UTL: 67 U.Minho: 217 U.Coimbra: 246 U.Aveiro:269 U.Lisboa: 47 U.Porto: 50 U.Minho: 187 U.Coimbra: 224 U.Aveiro: 261 UNL:300 U.Lisboa: 36 U.Porto: 59 U.Minho: 209 U.Aveiro: 228 U.Coimbra: 241
World Rank by SUBJECT 2010 2011 2012 2013 2014 2015 Agricultural Sciences U.Porto: 66 UTL: 162 U.Aveiro: 249 U.Lisboa: 299 U.Porto: 57 U.Minho: 209 UTL: 223 U.Aveiro: 261 U.Porto:47 UTL:125 U.Minho:204 U.Aveiro: 247 U.Porto: 69 U.Lisboa: 87 U.Porto:62 U.Lisboa:83 U.Minho:155 Environment/Ecology U.Porto: 192 U.Aveiro: 193 UTL: 261 U.Lisboa: 281 U.Coimbra: 294 U.Porto: 185 U.Aveiro: 212 UTL: 262 U.Coimbra: 266 U.Porto: 163 UTL: 198 U.Aveiro:223 U.Coimbra: 273 Lisboa: 290 U.Lisboa: 118 U.Porto: 126 U.Aveiro: 206 U.Lisboa: 103 U.Porto: 117 U.Aveiro: 178 U.Évora: 185 U.Coimbra: 292
Plant & Animal Science U.Lisboa: 296 U.Lisboa: 242 U.Porto: 277 U.Porto: 196 U.Lisboa. 250 UAlgarve: 280 UTL: 282 U.Lisboa: 95 U.Porto: 160 UAlgarve: 280 U.Lisboa: 87 U.Porto: 138 UNL:204 U.Aveiro:266 UAlgarve: 292 Pharmacology &Toxicology U.Porto: 206 U.Coimbra: 237 U.Porto:149 UCoimbra:237 U.Porto: 87 U.Coimbra: 267 U.Porto: 99 U.Coimbra: 202
3.3.1 Physics
Total Score 11 Years Articles Current Articles 11 Years Cita-tions Current Cita-tions Ave. Cita-tions H-Index HiCi Papers Hi-Impact Journal Articles World Rank Euro rank Ibero am rank PT Rank U.Lisboa 53,8 57,4 59,7 54,0 53,4 48,5 54,3 51,3 51,0 134 52 5 1 U.Porto 47,8 46,3 47,4 47,8 46,4 55,6 47,9 46,0 46,7 294 137 18 2 #IES 304 141 20 23.3.2 Chemistry
Total Score 11 Years Articles Current Articles 11 Years Cita-tions Current Cita-tions Ave. Cita-tions H-Index HiCi Papers Hi-Impact Journal Articles World Rank Euro rank Ibero am rank PT Rank U.Lisboa 53,8 59,9 60,5 56,5 52,8 46,9 51,0 49,4 51,8 122 31 5 1 U.Porto 51,9 57,4 57,0 52,6 51,8 44,0 49,5 47,0 54,6 162 54 9 2 U.Aveiro 50,5 52,3 55,5 50,3 51,3 46,6 49,5 48,8 49,2 189 65 10 3 UNL 48,8 49,6 49,6 49,1 48,5 48,8 49,3 48,8 47,1 246 99 17 4 #IES 302 121 19 43.3.3 Mathematics
Total Score 11 Years Articles Current Articles 11 Years Cita-tions Current Cita-tions Ave. Cita-tions H-Index HiCi Papers Hi-Impact Journal Articles World Rank Euro rank Ibero am rank PT Rank U.Lisboa 61,6 72,7 71,9 64,0 59,8 45,3 55,8 50,1 69,1 44 10 2 1 U.Aveiro 48,6 48,9 47,6 48,9 47,7 49,7 46,5 51,0 48,3 257 108 19 2 #IES 300 129 21 23.3.4 Geosciences
Total Score 11 Years Articles Current Articles 11 Years Cita-tions Current Cita-tions Ave. Cita-tions H-Index HiCi Papers Hi-Impact Journal Articles World Rank Euro rank Ibero am rank PT Rank U.Lisboa 55,3 54,6 63,3 51,4 57,5 47,5 60,0 52,3 55,5 98 36 2 1 #IES 300 137 12 13.3.5 Electrical Engineering
Total Score 11 Years Articles Current Articles 11 Years Cita-tions Current Cita-tions Ave. Cita-tions H-Index HiCi Papers Hi-Impact Journal Articles World Rank Euro rank Ibero am rank PT Rank U.Lisboa 53,4 57,1 58,2 54,6 52,9 47,7 51,1 54,1 49,6 127 27 2 1 U.Porto 48,9 47,8 47,9 48,3 49,2 50,8 47,8 47,3 52,3 234 70 11 2 U.Coimbra 47,7 45,9 47,2 45,5 51,5 45,8 56,7 44,2 47,6 273 89 16 3 #IES 301 100 16 33.3.6 Computer Science
Total Score 11 Years Articles Current Articles 11 Years Cita-tions Current Cita-tions Ave. Cita-tions H-Index HiCi Papers Hi-Impact Journal Articles World Rank Euro rank Ibero am rank PT Rank U.Lisboa 55,0 57,9 60,1 53,9 55,0 48,5 55,9 53,0 54,9 104 21 4 1 U.Porto 49,2 49,3 54,1 47,5 48,6 46,9 51,2 45,7 50,3 209 66 12 2 #IES 300 115 19 23.3.7 Mechanical Engineering
Total Score 11 Years Articles Current Articles 11 Years Cita-tions Current Cita-tions Ave. Cita-tions H-Index HiCi Papers Hi-Impact Journal Articles World Rank Euro rank Ibero am rank PT Rank U.Lisboa 62,6 63,2 64,6 59,5 70,5 46,5 68,5 56,7 71,0 47 12 1 1 U.Porto 57,7 57,7 56,3 59,3 66,7 53,5 64,6 53,3 54,3 80 25 2 2 U.Aveiro 52,3 48,0 47,1 53,0 51,7 67,5 56,1 49,9 50,0 151 48 8 3 U.Coimbra 48,9 48,4 49,7 47,8 51,1 47,3 56,0 44,8 48,3 234 75 11 4 #IES 302 104 12 43.3.8 Chemical Engineering
Total Score 11 Years Articles Current Articles 11 Years Cita-tions Current Cita-tions Ave. Cita-tions H-Index HiCi Papers Hi-Impact Journal Articles World Rank Euro rank Ibero am rank PT Rank U.Porto 58,4 62,2 59,1 65,4 59,7 54,0 57,5 52,6 56,7 76 15 3 1 U.Lisboa 53,8 57,5 56,9 55,2 52,9 45,8 55,0 50,3 55,6 132 31 5 2 U.Aveiro 53,1 51,0 54,0 52,9 55,4 54,5 59,4 48,0 52,5 145 37 6 3 U.Minho 50,8 52,6 50,6 51,8 50,5 47,8 52,3 46,9 53,8 187 57 14 4 U.Coimbra 48,4 48,6 49,7 47,3 48,3 45,2 52,1 45,8 50,4 256 81 18 5 #IES 303 101 20 53.3.9 Materials Science
Total Score 11 Years Articles Current Articles 11 Years Cita-tions Current Cita-tions Ave. Cita-tions H-Index HiCi Papers Hi-Impact Journal Articles World Rank Euro rank Ibero am rank PT Rank U.Aveiro 51,7 58,5 52 54,9 50,8 46,3 50,6 48,4 51,9 147 30 1 1 U.Lisboa 49,6 52,7 53,6 48,9 49,5 43,3 47,2 46,7 53,3 191 47 4 2 U.Porto 49,5 49,9 49,4 48,6 49,5 46,5 53,7 46,2 52,7 195 50 5 3 U.Minho 49,1 52,2 51,2 49,7 49,4 45,3 48,8 45,4 50,8 214 60 7 4 #IES 301 95 15 43.3.10 Civil Engineering
Total Score 11 Years Articles Current Articles 11 Years Cita-tions Current Cita-tions Ave. Cita-tions H-Index HiCi Papers Hi-Impact Journal Articles World Rank Euro rank Ibero am rank PT Rank U.Lisboa 64,6 73,6 78,8 63,9 73,8 43,7 59,6 57,9 63,0 36 8 1 1 U.Porto 59,4 58,6 60,8 61,7 61,8 54,0 58,8 57,9 60,4 59 14 3 2 U.Minho 50,8 51,5 52,7 51,9 51,5 50,4 55,0 47,8 47,6 209 67 12 3 U.Aveiro 50,0 50,1 54,4 47,3 55,1 43,2 55,4 47,8 48,0 228 78 17 4 U.Coimbra 49,3 52,6 53,8 48,1 51,4 41,6 51,5 50,3 45,1 241 84 18 5 #IES 302 108 23 53.3.11 Agricultural Sciences
Total Score 11 Years Articles Current Articles 11 Years Cita-tions Current Cita-tions Ave. Cita-tions H-Index HiCi Papers Hi-Impact Journal Articles World Rank Euro rank Ibero am rank PT Rank U.Porto 59,8 58,2 60,8 60,6 63,9 49,1 61,1 62,9 59,3 62 19 5 1 U.Lisboa 56,4 56,1 53,6 59,4 57,2 50,9 60,6 57,5 55,5 83 27 8 2 U.Minho 51,8 46,6 49,3 47,4 53,4 50,5 60,2 57,5 50,7 155 68 26 3 #IES 306 130 44 33.3.12 Environment/Ecology
Total Score 11 Years Articles Current Articles 11 Years Cita-tions Current Cita-tions Ave. Cita-tions H-Index HiCi Papers Hi-Impact Journal Articles World Rank Euro rank Ibero am rank PT Rank U.Lisboa 56,6 62,4 70,5 53,9 63,7 43,4 55,6 49,6 53,1 103 36 3 1 U.Porto 55,1 60,8 64,5 52,8 56,4 43,1 55,2 54,3 52,3 117 43 6 2 U.Aveiro 51,4 60,7 62,0 50,1 54,8 39,1 52,8 45,4 46,8 178 64 7 3 U.Évora 51,2 44,0 43,3 49,5 47 78,7 52,1 53,7 46,8 185 67 8 4 U.Coimbra 47,6 50,6 51,2 46,5 49,7 41,2 52,4 45,4 44,7 292 117 16 5 #IES 302 123 18 53.3.13 Plant & Animal Science
Total Score 11 Years Articles Current Articles 11 Years Cita-tions Current Cita-tions Ave. Cita-tions H-Index HiCi Papers Hi-Impact Journal Articles World Rank Euro rank Ibero am rank PT Rank U.Lisboa 56,0 58,7 62,9 56,2 58,6 47,0 58,9 50,9 54,5 87 31 6 1 U.Porto 52,6 55,6 58,8 50,2 56,0 41,9 52,5 45,5 58,8 138 57 11 2 UNL 50,0 44,5 46,1 46,3 51,8 56,1 58,4 50,5 49,9 204 92 17 3 U.Aveiro 48,3 47,1 52,5 45,9 51,8 44,4 52,1 45,1 48,0 266 122 24 4 U.Algarve 47,6 49,1 50,2 47,6 50,5 45,2 55 43,5 42,6 292 135 25 5 #IES 300 140 27 53.3.14 Pharmacology &Toxicology
Total Score 11 Years Articles Current Articles 11 Years Cita-tions Current Cita-tions Ave. Cita-tions H-Index HiCi Papers Hi-Impact Journal Articles World Rank Euro rank Ibero am rank PT Rank U.Porto 56,8 59,3 64,3 55,1 63,0 45,1 59,0 53,2 54,9 99 38 3 1 U.Coimbra 50,1 49,1 51,3 49,1 50,0 49,3 52,8 50,4 49,0 202 78 8 2 #IES 301 119 20 2Anexo 1
-
Metodologia do NTU Ranking by Field
Field Categories4
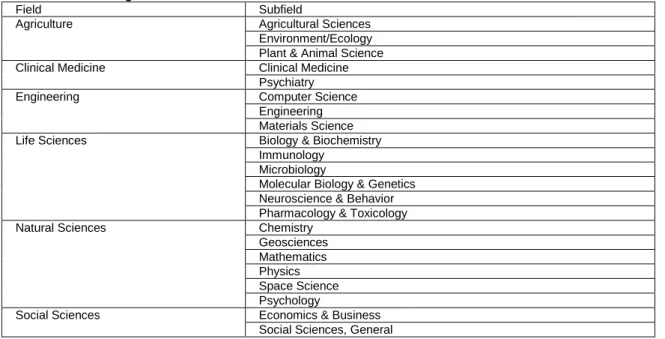
“The National Taiwan University Ranking (NTU Ranking) categorizes subfields into six fields, namely Agriculture, Clinical Medicine, Engineering, Life Sciences, Natural Sciences and Social Sciences. Table 1 shows the six fields and the respective subfields. Tables 2-7 list the detailed subject categories of each subfield. “
Table 1 Field Categories
Field Subfield
Agriculture Agricultural Sciences
Environment/Ecology Plant & Animal Science
Clinical Medicine Clinical Medicine
Psychiatry
Engineering Computer Science
Engineering Materials Science
Life Sciences Biology & Biochemistry
Immunology Microbiology
Molecular Biology & Genetics Neuroscience & Behavior Pharmacology & Toxicology
Natural Sciences Chemistry
Geosciences Mathematics Physics Space Science Psychology
Social Sciences Economics & Business
Social Sciences, General
Table 2 Agriculture Subfields
Field Subfield
Agricultural Sciences Agricultural Economics & Policy Agricultural Engineering
Agriculture, Dairy & Animal Science Agriculture, Multidisciplinary Agriculture, Soil Science Agronomy
Food Science & Technology Horticulture
Nutrition & Dietetics
Environment/Ecology Biodiversity Conservation
Ecology
Environmental Sciences Water Resources
Plant & Animal Science Entomology
Fisheries Forestry
Marine & Freshwater Biology Mycology Ornithology Plant Sciences Veterinary Sciences Zoology
4
http://nturanking.lis.ntu.edu.tw/BackgroundMethodology/FieldCategories-enus.aspx
Acedido
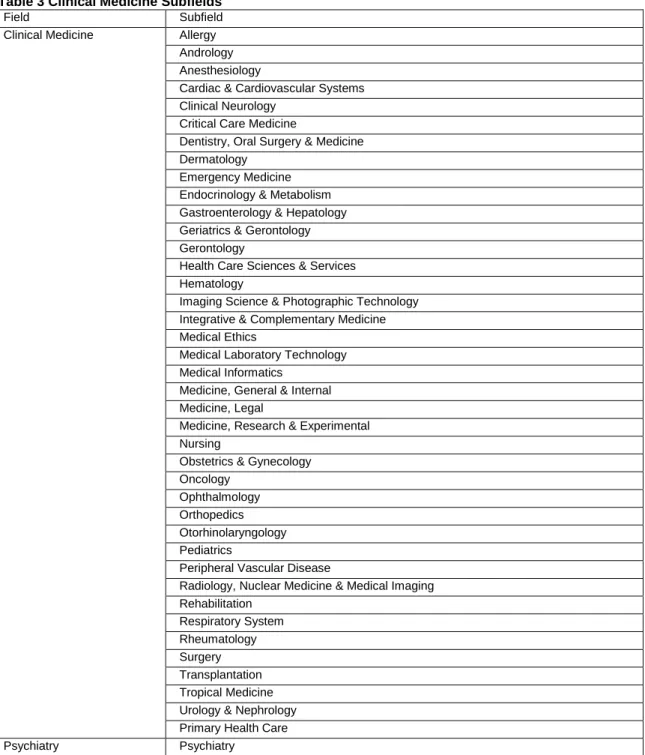
12 de outubro de 2015.Table 3 Clinical Medicine Subfields
Field Subfield
Clinical Medicine Allergy
Andrology Anesthesiology
Cardiac & Cardiovascular Systems Clinical Neurology
Critical Care Medicine
Dentistry, Oral Surgery & Medicine Dermatology
Emergency Medicine Endocrinology & Metabolism Gastroenterology & Hepatology Geriatrics & Gerontology Gerontology
Health Care Sciences & Services Hematology
Imaging Science & Photographic Technology Integrative & Complementary Medicine Medical Ethics
Medical Laboratory Technology Medical Informatics
Medicine, General & Internal Medicine, Legal
Medicine, Research & Experimental Nursing
Obstetrics & Gynecology Oncology
Ophthalmology Orthopedics Otorhinolaryngology Pediatrics
Peripheral Vascular Disease
Radiology, Nuclear Medicine & Medical Imaging Rehabilitation Respiratory System Rheumatology Surgery Transplantation Tropical Medicine Urology & Nephrology Primary Health Care
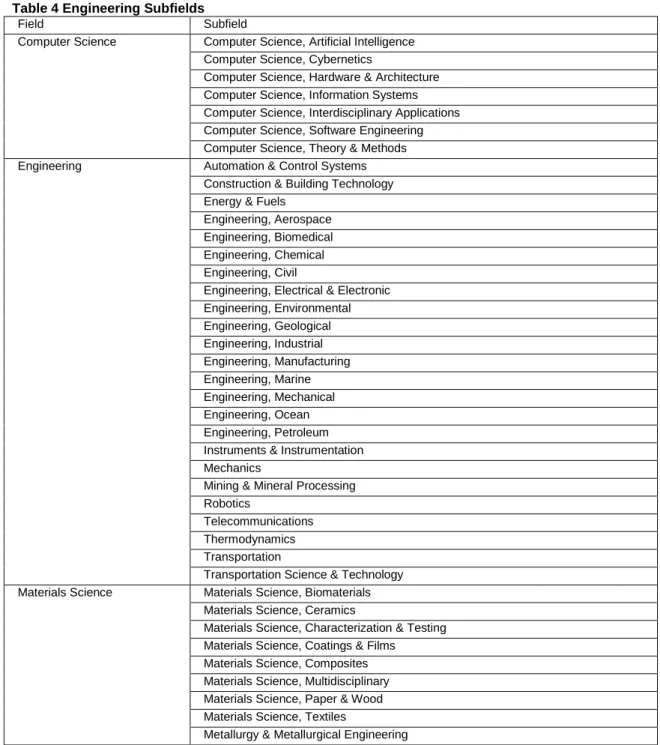
Table 4 Engineering Subfields
Field Subfield
Computer Science Computer Science, Artificial Intelligence Computer Science, Cybernetics
Computer Science, Hardware & Architecture Computer Science, Information Systems Computer Science, Interdisciplinary Applications Computer Science, Software Engineering Computer Science, Theory & Methods Engineering Automation & Control Systems
Construction & Building Technology Energy & Fuels
Engineering, Aerospace Engineering, Biomedical Engineering, Chemical Engineering, Civil
Engineering, Electrical & Electronic Engineering, Environmental Engineering, Geological Engineering, Industrial Engineering, Manufacturing Engineering, Marine Engineering, Mechanical Engineering, Ocean Engineering, Petroleum Instruments & Instrumentation Mechanics
Mining & Mineral Processing Robotics
Telecommunications Thermodynamics Transportation
Transportation Science & Technology Materials Science Materials Science, Biomaterials
Materials Science, Ceramics
Materials Science, Characterization & Testing Materials Science, Coatings & Films
Materials Science, Composites Materials Science, Multidisciplinary Materials Science, Paper & Wood Materials Science, Textiles
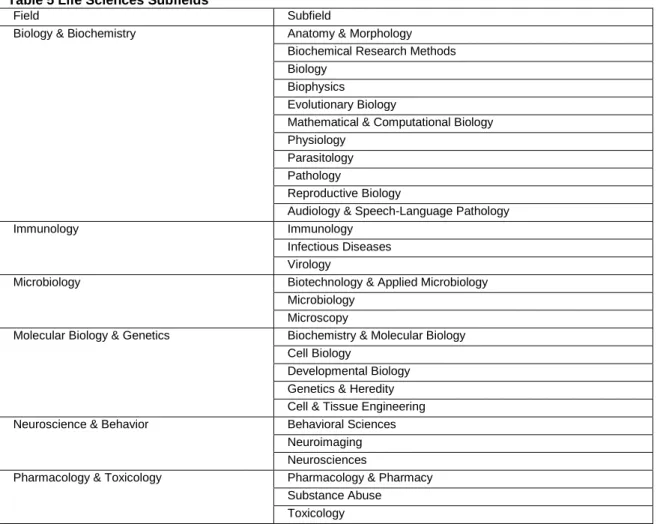
Table 5 Life Sciences Subfields
Field Subfield
Biology & Biochemistry Anatomy & Morphology Biochemical Research Methods Biology
Biophysics
Evolutionary Biology
Mathematical & Computational Biology Physiology
Parasitology Pathology
Reproductive Biology
Audiology & Speech-Language Pathology
Immunology Immunology
Infectious Diseases Virology
Microbiology Biotechnology & Applied Microbiology
Microbiology Microscopy
Molecular Biology & Genetics Biochemistry & Molecular Biology Cell Biology
Developmental Biology Genetics & Heredity Cell & Tissue Engineering
Neuroscience & Behavior Behavioral Sciences
Neuroimaging Neurosciences
Pharmacology & Toxicology Pharmacology & Pharmacy Substance Abuse
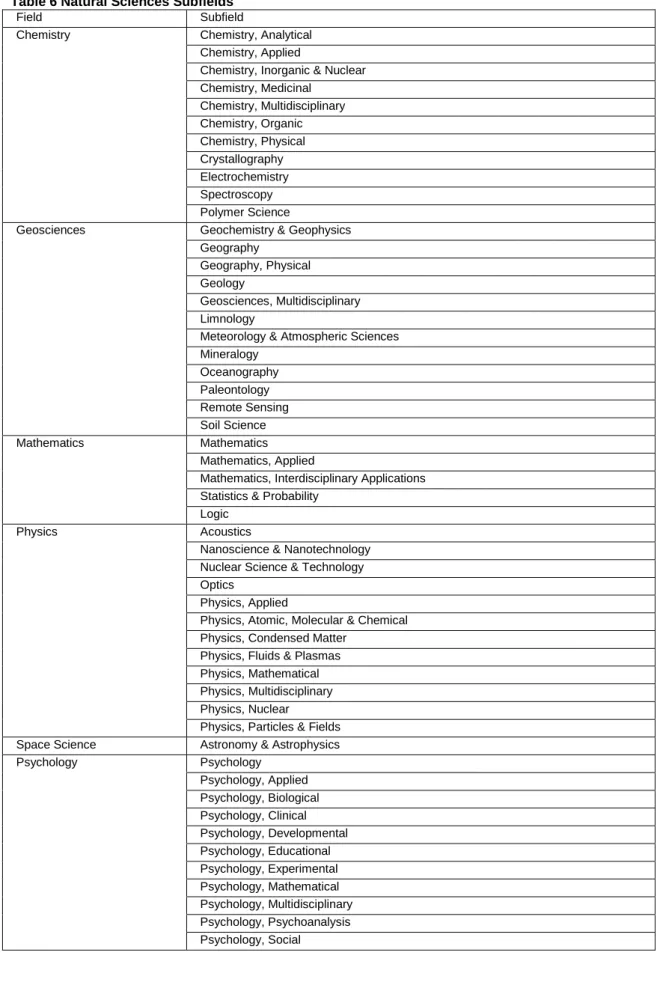
Table 6 Natural Sciences Subfields
Field Subfield
Chemistry Chemistry, Analytical
Chemistry, Applied
Chemistry, Inorganic & Nuclear Chemistry, Medicinal Chemistry, Multidisciplinary Chemistry, Organic Chemistry, Physical Crystallography Electrochemistry Spectroscopy Polymer Science
Geosciences Geochemistry & Geophysics Geography
Geography, Physical Geology
Geosciences, Multidisciplinary Limnology
Meteorology & Atmospheric Sciences Mineralogy Oceanography Paleontology Remote Sensing Soil Science Mathematics Mathematics Mathematics, Applied
Mathematics, Interdisciplinary Applications Statistics & Probability
Logic
Physics Acoustics
Nanoscience & Nanotechnology Nuclear Science & Technology Optics
Physics, Applied
Physics, Atomic, Molecular & Chemical Physics, Condensed Matter
Physics, Fluids & Plasmas Physics, Mathematical Physics, Multidisciplinary Physics, Nuclear
Physics, Particles & Fields Space Science Astronomy & Astrophysics
Psychology Psychology Psychology, Applied Psychology, Biological Psychology, Clinical Psychology, Developmental Psychology, Educational Psychology, Experimental Psychology, Mathematical Psychology, Multidisciplinary Psychology, Psychoanalysis Psychology, Social
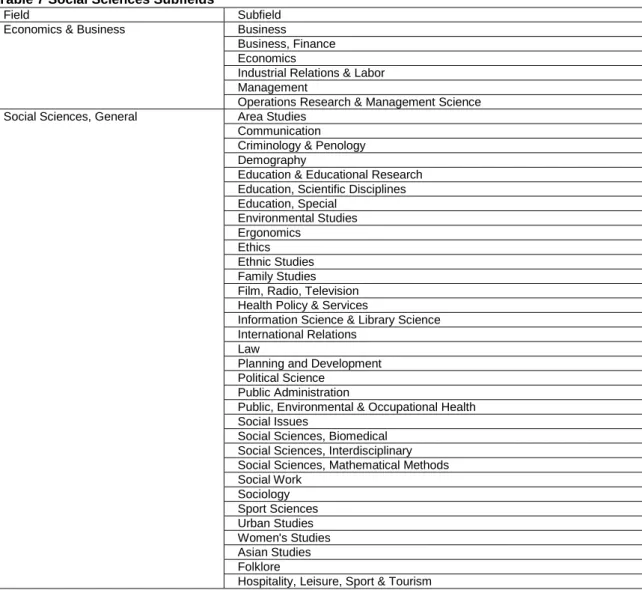
Table 7 Social Sciences Subfields
Field Subfield
Economics & Business Business
Business, Finance Economics
Industrial Relations & Labor Management
Operations Research & Management Science Social Sciences, General Area Studies
Communication Criminology & Penology Demography
Education & Educational Research Education, Scientific Disciplines Education, Special Environmental Studies Ergonomics Ethics Ethnic Studies Family Studies Film, Radio, Television Health Policy & Services
Information Science & Library Science International Relations
Law
Planning and Development Political Science
Public Administration
Public, Environmental & Occupational Health Social Issues
Social Sciences, Biomedical Social Sciences, Interdisciplinary Social Sciences, Mathematical Methods Social Work Sociology Sport Sciences Urban Studies Women's Studies Asian Studies Folklore
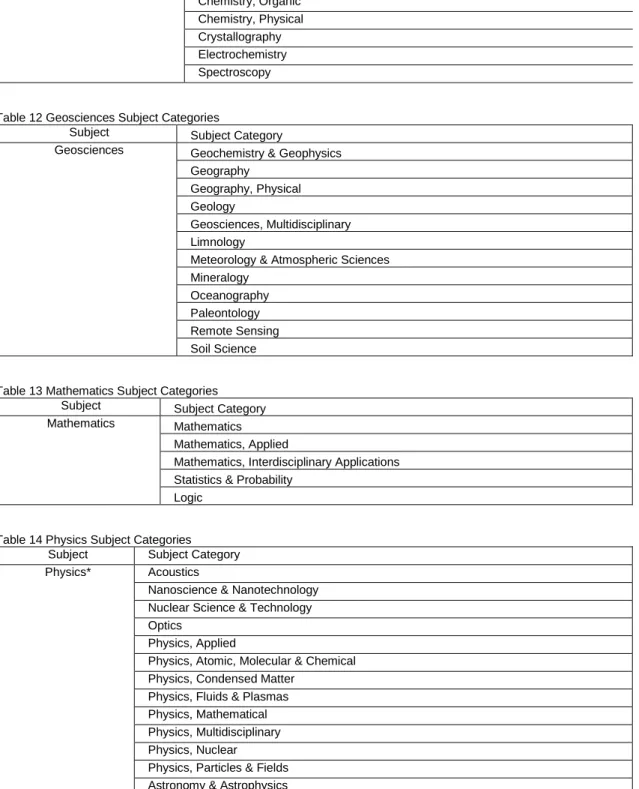
Anexo 2 - Metodologia do NTU Ranking by Subject
Subject Categories
5“The National Taiwan University Ranking (NTU Ranking) ranks each university by 14 subjects, namely Agricultural Sciences, Environment/Ecology, Plant & Animal Science, Computer Science, Chemical Engineering (including Energy & Fuels), Civil Engineering (including Environmental Engineering), Electrical Engineering, Mechanical Engineering, Materials Science, Pharmacology & Toxicology, Chemistry, Geosciences, Mathematics, and Physics. Tables 1-14 list the detailed subject categories.”
Table 1 Agricultural Sciences Subject Categories
Subject Subject Category
Agricultural Sciences Agricultural Economics & Policy Agricultural Engineering
Agriculture, Dairy & Animal Science Agriculture, Multidisciplinary Agriculture, Soil Science Agronomy
Food Science & Technology Nutrition & Dietetics Horticulture Table 2 Environment/Ecology Subject Categories
Subject Subject Category
Environment/Ecology Biodiversity Conservation Ecology
Environmental Sciences Water Resources Table 3 Plant & Animal Science Subject Categories
Subject Subject Category
Plant & Animal Science Entomology Fisheries Forestry
Marine & Freshwater Biology Mycology
Ornithology Plant Sciences Veterinary Sciences Zoology
Table 4 Computer Science Subject Categories
Subject Subject Category
Computer Science Computer Science, Artificial Intelligence Computer Science, Cybernetics
Computer Science, Hardware & Architecture Computer Science, Information Systems Computer Science, Interdisciplinary Applications Computer Science, Software Engineering Computer Science, Theory & Methods
5
http://nturanking.lis.ntu.edu.tw/BackgroundMethodology/SubjectCategories-enus.aspx
acedido 12 de
outubro de 2015.
Table 5 Chemical Engineering Subject Categories
Subject Subject Category
Chemical Engineering, including Energy & Fuels Energy & Fuels Engineering, Chemical Engineering, Petroleum Polymer Science Table 6 Civil Engineering Subject Categories
Subject Subject Category
Civil Engineering, including Environmental Engineering Construction & Building Technology Engineering, Civil
Engineering, Environmental Engineering, Geological Engineering, Ocean Transportation
Transportation Science & Technology
Table 7 Electrical Engineering Subject Categories
Subject Subject Category
Electrical Engineering Automation & Control Systems Engineering, Biomedical
Engineering, Electrical & Electronic Instruments & Instrumentation Telecommunications Table 8 Mechanical Engineering Subject Categories
Subject Subject Category
Mechanical Engineering Engineering, Aerospace Engineering, Manufacturing Engineering, Marine Engineering, Mechanical Mining & Mineral Processing Mechanics
Robotics Thermodynamics Engineering, Industrial Table 9 Materials Science Subject Categories
Subject Subject Category
Materials Science Materials Science, Biomaterials Materials Science, Ceramics
Materials Science, Characterization & Testing Materials Science, Coatings & Films
Materials Science, Composites Materials Science, Multidisciplinary Materials Science, Paper & Wood Materials Science, Textiles
Metallurgy & Metallurgical Engineering Table 10 Pharmacology & Toxicology Subject Categories
Subject Subject Category
Pharmacology & Toxicology Pharmacology & Pharmacy Substance Abuse
Table 11 Chemistry Subject Categories
Subject Subject Category
Chemistry Chemistry, Analytical Chemistry, Applied
Chemistry, Inorganic & Nuclear Chemistry, Medicinal Chemistry, Multidisciplinary Chemistry, Organic Chemistry, Physical Crystallography Electrochemistry Spectroscopy Table 12 Geosciences Subject Categories
Subject Subject Category
Geosciences Geochemistry & Geophysics Geography
Geography, Physical Geology
Geosciences, Multidisciplinary Limnology
Meteorology & Atmospheric Sciences Mineralogy
Oceanography Paleontology Remote Sensing Soil Science Table 13 Mathematics Subject Categories
Subject Subject Category Mathematics Mathematics
Mathematics, Applied
Mathematics, Interdisciplinary Applications Statistics & Probability
Logic Table 14 Physics Subject Categories
Subject Subject Category
Physics* Acoustics
Nanoscience & Nanotechnology Nuclear Science & Technology Optics
Physics, Applied
Physics, Atomic, Molecular & Chemical Physics, Condensed Matter
Physics, Fluids & Plasmas Physics, Mathematical Physics, Multidisciplinary Physics, Nuclear
Physics, Particles & Fields Astronomy & Astrophysics Note: *Physics includes Space Science.