Experimental bending tests of partially encased beams at
elevated temperatures
Paulo A.G. Piloto
a,*, Ana B. Ramos-Gavil
an
b, Carlos Gonçalves
a, Luís M.R. Mesquita
a aLAETA-INEGI, Department of Applied Mechanics, Polytechnic Institute of Bragança, PortugalbDepartment of Mechanical Engineering, EPSZ, University of Salamanca, Spain
A R T I C L E I N F O Keywords:
Partially encased beams Composite steel and concrete Bending resistance Elevated temperature Experimental tests Lateral torsional buckling
A B S T R A C T
This paper presents the result of an experimental research about the lateral torsional buckling instability during bending tests of Partially Encased Beams (PEB) at elevated temperature. A set of twenty seven four-point bending tests, grouped in ten series, were carried out to analyse the influence of relative slenderness, beam temperature and the shear bond conditions between concrete and steel in bending. In addition, this study compares the behaviour of PEB and bare steel beam under bending at room temperature.
PEB specimens are based on IPE100 steel profiles, with two different lengths 2.4 m (medium series) and 3.9 m (large series), tested in bending using simple supporting conditions and exposed to different temperatures levels of 200C, 400C, and 600C.
Two different shear bond conditions, between steel profile and lateral concrete, were analysed at 400C: one series with connectors formed by welded stirrups to the web and another series with natural adherence between steel and concrete, not welded stirrups.
PEB attained lateral torsional buckling as deformed failure mode at the ultimate limit state, except for the case of PEB tested at 600C that results in a plastic hinge failure. The bending resistance was determined for the maximum load event (Fu) and for the displacement limit corresponding to L/30 (FL/30) and compared with the results of the Eurocode 3 part 1–2 simple calculation method, considering an adaptation of its formulae to PEB. The expected reduction in bending resistance at elevated temperature is in good agreement with the experimental reduction factor, when the deformation criterion is used.
1. Introduction
Partially Encased Beams (PEB) are composite steel and concrete ele-ments in which the web of the steel section is encased by reinforced concrete. PEB have been used in different types of building structures, such as commercial centres, hospitals and hotels. This solution increases the bending and torsional stiffness, and therefore bearing capacity, and
improves thefire resistance of steel beams without increasing the overall
dimension of the bare steel cross section. The concreting of the beams is done prior to the hoisting and placement, without the need of formwork. The exposed steel surfaces facilitate the joints between them. This solu-tion also improves the seismic behaviour of the bare steel beam, by increasing the stiffness, keeping their ductile behaviour. PEB is an interesting solution for long spans 12–15 m without additional protection measures, in which reinforced concrete is not viable, and where pre-stressing may suffer from explosive spalling.
The bending resistance requires full shear connection between the structural steel section and the encased concrete, according to Eurocode 4 part 1-1. The design solution of stirrups welded (W) to the web of the
steel profile provides shear connection between the reinforced concrete
and the steel profile, and increases concrete confinement. The
improve-ment of thefire resistance of PEB is based on the reduction of the exposed
steel surface area to elevated temperatures and the introduction of a low
thermal conductivity material (concrete), as verified by the authors[1].
Piloto et al.[1]tested a set of PEB underfire conditions (small series)
using three-point bending test, demonstrating the dependence of fire
resistance on load level, giving particular emphasis to the critical tem-perature of this section.
Until this research, only a small number of experiments underfire
conditions were reported. In 1987, J. B. Schleich[2]was the project
leader of an experimental and numerical campaign developed to test and analyse the behaviour of Partially Encased Columns (PEC) and PEB with
* Corresponding author. Campus Santa Apolonia, ap. 1134, 5301-857, Portugal.
E-mail address:[email protected](P.A.G. Piloto).
Contents lists available atScienceDirect
Fire Safety Journal
j o u r n a l h o m e p a g e :w w w . e l s e v i e r . c o m / l o c a t e / fi r e s a f
http://dx.doi.org/10.1016/j.firesaf.2017.05.014
Received 16 November 2015; Received in revised form 19 March 2017; Accepted 22 May 2017 Available online 31 May 2017
Notation and symbols
Latin lower case letters
a Distance between load and support
b Width of the profile cross section
b1 Width of the encased concrete in the half profile
b Average width of the profile specimen
epl Neutral axis depth at room temperature
epl;θ Neutral axis depth at elevated temperature
er Vertical position of reinforcement
f Modification factor
fck Characteristic compressive cylinder strength of concrete at
28 days
fyk Characteristic value of the yield strength of steel
fsk Characteristic value of the yield strength of reinforcement
h1 depth of the of the encased concrete
h Average depth of the profile specimen
kc Correction factor for moment distribution
kc;θ Reduction factor of the compressive strength of concrete at
elevated temperature
ks;θ Reduction factor of the reinforcement at elevated
temperature
kE;θ Reduction factor of the elastic modulus at the steel
temperature
ky;θ Reduction factor for the yield strength of steel at the steel
temperature
tf flange thickness
tf Averageflange thickness of the profile specimen
tw web thickness
tw Average web thickness of the profile specimen
yr Horizontal position of reinforcement
Latin upper case scalars
Ar,As Cross sectional area of reinforcement
At Percentage total extension at fracture - total extension at
the moment of fracture, during material testing
Ea;θ,Es;θ Elastic modulus of steel at elevated temperature
Es,Ea Elastic modulus of steel
Ec Elastic modulus of concrete
Ec;θ Elastic modulus of concrete at elevated temperature
Es;θ Elastic modulus of the reinforcement at elevated
temperature
FL=30 Force corresponding to a vertical displacement of L/30 at
mid span
FMpl Force corresponding to the plastic moment of the
cross section
Fp Force corresponding to proportional limit of the specimen
Fu Maximum force applied to the specimen during test
Fy Force corresponding to yielding of the specimen
Gs,Ga Shear modulus of the steel
Ga;θ Shear modulus of steel at elevated temperature
Gc Shear modulus of concrete
Gc;θ Shear modulus of concrete at elevated temperature
It Torsion constant of PEB section
It;c Torsion constant of concrete
It;s Torsion constant of the steel profile
Iw Warping constant of the homogenised section
Iw;a Warping constant of the steel section
Iy;Iz Second moment of area of the homogenised section with
respect to both axes
Iza IzsSecond moment of area of the steel profile with respect to
z axis
Izc Second moment of area of concrete with respect to z axis
L;Lt Beam length of the specimen
Lf Beam length exposed to elevated temperature
Ll Length between loading points
Ls Length between supports
Mb;fi;t;Rd Design buckling resistance moment at time t, underfire
conditions
Mb;Rd Design buckling resistance moment
Mb;Rk Characteristic buckling resistance moment to
lateral-torsional buckling
Mcr Elastic critical moment for lateral-torsional buckling
Mcr;θ Elastic critical moment for lateral-torsional buckling at
elevated temperature
Mb;fi;t;Rk Characteristic buckling resistance moment underfire at
time t
Mb;fi;t;Rd Design buckling resistance moment underfire at time t
Mpl;Rk Characteristic value of resistance to bending moment about
y-y axis at room temperature
Mpl;θ;Rk Characteristic value of resistance to bending moment about
y-y axis at elevated temperature
ReH Upper yield strength - Maximum value of stress prior to the
first decrease in force during material test, usually consider
the yield stress
ReL Lower yield strength - lowest value of stress during plastic
yielding, ignoring any initial transient effects
Rm Tensile strength - stress corresponding to the maximum
force during material testing
Rp:0:2% Strength of steel corresponding to 0.2% strain during material test
Tsi Average temperature of the section Si weighted to the area
Wpl;y Plastic section modulus of steel profile about y-y axis
XFi Average value of the force type i
YG Lateral displacement of the centre of gravity of the
PEB section
ZG Vertical displacement of the centre of gravity of the
PEB section
Scalar lower case letter using Greek symbols
α Imperfection factor underfire conditions
αLT The imperfection factor
β Value to determine the reduction factor for
lateral-torsional buckling
ε Axial strain measurement
εy Axial strain corresponding to yielding of the steel profile
λLT Non dimensional slenderness for lateral-torsional buckling
λLT;0 Plateau length of the lateral-torsional buckling curves for
rolled sections
λLT;θ;com Non dimensional slenderness for lateral-torsional buckling
at the temperature of the compressedfibre
ΦLT Value to determine the reduction factor for
lateral-torsional buckling
ΦLT;θ;com Value to determine the reduction factor for lateral-torsional
buckling at the temperature of the compressedfibre
χLT Reduction factor for lateral-torsional buckling
χLT;fi Reduction factor for lateral-torsional buckling in thefire
design situation
χLT;mod Modified reduction factor for lateral-torsional buckling
χLT;fi;mod Modified reduction factor for lateral-torsional buckling at
and without connection to the slab. This project demonstrated the ability
of the computer code CEFICOSS to cover most structuralfire applications.
Karl Kordina[3]presented tables with minimum dimensions to be used
in thefire design of composite columns, including PEC, based on
ex-periments. These results were verified in PEC and PEB, for different
de-grees of utilization, supporting conditions and materials. Kindmean et al.
[4], performed thirteen tests on PEB with and without concrete slabs,
showing the importance of the reinforced concrete betweenflanges for
the ultimate bending moment. This research caused the revision of Eurocode 4 (pre-standard) for the design of partially encased composite beams to include the encased material contribution in the load bearing
resistance and deflection. Hosser et al.[5], carried out four experimental
tests on simply supported composite PEB connected to reinforced
con-crete slabs underfire conditions. Temperature evolution was registered
at different locations, including in the PEB cross section. The authors also
presented results from finite element analysis, concluding that the
effective width of the slab depends on the transversal longitudinal shear
reinforcement. Lindner et al. [6]investigated the lateral instability of
PEB at room temperature using two different steel sections, introducing a new design proposal to lateral torsional buckling, taking into
consider-ation the torsional stiffness of concrete. Maquoi et al.[7], worked on
lateral torsional buckling of PEB and improved design rules that were not well covered by the existing standards, using experimental tests with numerical validation, revising and improving the elastic critical moment
and the ultimate lateral torsional buckling moment. Assi et al. [8],
developed a theoretical background and an experimental study on the ultimate moment capacity of PEB, performing twelve bending tests on specimens with four different IPE cross sections. They studied the contribution of different types of concrete and concluded that
encase-ment of concrete significantly enhances the load carrying capacity of bare
steel sections. Makamura et al.[9], tested three Partially Encased Girders
(PEG) with longitudinal and transversal rebars (welded and not welded
toflanges), showing that the bending strength of the PEG was almost two
times higher than conventional bare steel girders and that the specimen
with rebar not welded to flanges presented a decrease of 15% for
maximum load bearing when compared to the one with welded rebars.
More recently, Kodaira et al.[10], determined thefire resistance of eight
PEB, with and without concrete slabs, demonstrating that the
rein-forcement is effective during a fire. In 2008, Elghazouli et. Al. [11]
performed ten full scale tests on PEB, assessing the inelastic performance and discussing several parameters (strain hardening of steel, concrete
confinement, extension of section yielding) related to capacity and
ductility with relevance to design. Nardin and El Debs[12], studied the
static behaviour of three composite PEB underflexural loading at room
temperature, testing some alternative positions for shear studs,
con-firming that studs are responsible for the composite action and for
increasing the bending strength. Authors also presented a new analytical method to estimate the bending capacity of PEB.
According to EN1994-1-2[13], the bending resistance underfire can
be determined by tabulated data, by a simple calculation method or by an advanced calculation method. Tabulated method can only be used for
beams with simple supported conditions exposed to standardfire. The
simple calculation method, for the design of composite beams, is only
applied to simple support conditions and standard fire exposure from
three sides, and takes into account the reduction of dimensions of the parts composing the cross section (geometry) and the reduction of the mechanical properties of materials, to represent the effect of temperature on material characteristics, without considering lateral torsional buck-ling as deformed failure mode. This method may be applied to PEB, assuming no mechanical resistance of the concrete slab. Advanced calculation method can also be used to calculate bending resistance at elevated temperatures through an uncoupled thermal and mechanical
analysis. Test results may also be used to assess thefire behaviour of
structural members, sub-assemblies or entire structures if they come from tests adequately performed.
The experimental study presented herein aims to analyse the lateral
torsional buckling resistance of PEB at elevated temperature by means of four-point bending tests. Specimens were heated between loading points,
from two sides (top and bottomflanges) and load was increased step by
step, after stabilizing the temperature of the test (200C, 400C, and
600C). The experimental tests were defined to be developed at constant
temperature level with increasing mechanical load. This purpose helps to verify or suggest prescriptive designing formulas and guarantees that
failure is achieved at specific temperature level (not before or after
maximum temperature level, as could be the case of naturalfire). The test
set-up was conceived to approximate the load of the specimen to an almost constant bending moment, being the results only valid to this load and support condition, either PEB is considered as main or secondary beam. Lateral torsional buckling should be consider a potential failure mode at room and elevated temperature for unrestrained PEB, when compressive stresses are responsible for the existing of an out-of-plane bending moment and lateral displacement. The bending resistance of PEB is also compared with bare steel beams at room temperature. Two different beam lengths were considered (medium and large series), using one type of cross section (IPE100). Two different shear bond conditions
between concrete and steel profile were analysed at 400C: with
con-nectors formed by stirrups welded to the web profile and with natural
adherence without welded stirrups.
This research allows to determine the lateral torsional buckling resistance of PEB at elevated temperatures, to propose an adaptation of
the simple calculation method from EN1993 1–2[14]to composite steel
and concrete structures. This investigation also demonstrates that lateral torsional buckling is a potential failure mode to be consider in partially
encased beams underfire conditions, especially when these elements are
not connected to the slab. This research also provides data to calibrate and validate the new simple calculation method and advanced calcula-tion method.
2. Specimens and loading conditions
Specimens are formed by hot rolled profile IPE100 with steel grade
S275, laterally encased by reinforced concrete C20. The longitudinal reinforcement consists of four rebars of steel B500 with 8 mm on diam-eter. The transversal reinforcement is formed by open stirrups of steel rebars B500 with the diameter of 6 mm, spaced every 167 mm in
lon-gitudinal direction. IPE 100 steel bare section is classified as class 1, with
depth width ratio of 1.8. The non-dimensional slenderness of bare steel beams to be tested are between 1.0 and 1.4, at room temperature, which enhances lateral torsional buckling as a potential mode of instability. This cross section was elected to prone beam to a global instability mode,
minimizing the difficulties associated with experimental tests. The
con-clusions of this investigation are applied only to this composite section, due to the limited number of tests developed on PEB.
Two different shear condition between concrete and steel were used: with stirrups welded to the web (W) and non-welded stirrups (NW), both
represented inFig. 1. According to EN1994-1-1[15], this composite steel
and concrete section is classified as class 1.
Stirrups were also partially welded to the longitudinal steel
rein-forcement, as represented inFig. 1.
The plastic neutral axis is referenced to“epl”, being the reinforced
concrete block dimensions represented by“b1”and“h1”, while“er”and
“yr”represent the relative position for longitudinal reinforcement.
Specimens were tested using a steel portal frame, seeFig. 2, using two
fork supports (restraining axial rotation, lateral and vertical displace-ment) and two-point load (restraining axial rotation but allowing for lateral displacement). Room temperature tests were developed in one single stage, using small increments of displacement (2.4 mm/min),
while elevated temperature tests were developed in two stages. Thefirst
stage was used for heating the beam along the length exposed to high
temperature“Lf”, using a constant heating rate and a dwell time for
(2.4 mm/min) until the attainment of the ultimate limit state. This investigation aims to test PEB at almost constant temperature level using incremental load. This setup will provide a set of bending resistance (load domain) for a set of temperature levels. Four different load events were
identified during tests to characterize the limit of proportionality
be-tween load and vertical displacement, the yielding of the cross section, the maximum load recorded and the load corresponding to L/30.
3. Bending resistance of PEB–simple calculation method
Experimental bending resistance of PEB at room and elevated tem-perature was compared with the plastic resistance moment of the com-posite section using the characteristic material properties. The plastic resistance moment of PEB was calculated in accordance with EN
1994-1-1[15], which assumes that: there is full interaction between structural
steel and concrete; the effective area of the steel profile is stressed to its
yield strengthfyk; the effective area of longitudinal reinforcementAr is
stressed to its yield strengthfsk; and the effective area of concrete in
compression resists a stress of 0:85fck, constant over the whole depth
between the plastic neutral axis and the most compressed fibre of
concrete. fck represents the characteristic value of concrete cylinder
compressive strength. The plastic stress distribution is represented inFig. 3.
The characteristic plastic resistance moment at room temperature,
Mpl,Rk, may be determined according to Eq.(1).
Fig. 2. Testing conditions and identification of the main cross sections.
Mpl;Rk¼Wpl;y⋅fyk 2⋅fyk⋅tw⋅
h12 epl
22 þ
2⋅0:85⋅fck⋅b1⋅epl⋅
h1
2 epl
2 þ
2⋅Ar⋅ðfsk 0:85fckÞ⋅ðh 2⋅erÞ
(1)
The characteristic plastic moment resistance, Mpl;θ;Rk, at elevated
temperature may be calculated, adapting the characteristic mechanical
properties of each material, as shown in Eq.(2).
Mpl;θ;Rk¼Wpl;y⋅fyk⋅kyθ 2⋅fyk:⋅kyθ⋅tw⋅
h1
2 epl;θ 2
2þ
2⋅0:85⋅fck⋅kcθ⋅b1⋅epl;θ⋅
h1
2 epl;θ
2 þ
2⋅Ar⋅ðfsk⋅ksθ 0:85⋅fck⋅kcθÞ⋅ðh 2⋅erÞ
(2)
The shear resistance was also analysed at room temperature. The contribution of web encasement to shear may be taken into account if stirrups are fully welded to the web, as is the case for almost specimens.
The influence to the total shear resistance from steel and reinforced
concrete may be assumed to be in the same proportion as it is for bending
resistance[15]. At room temperature, the steel profile contribution to the
bending resistance of PEB represents about 80%, while the contribution of reinforced concrete is about 20%.
The characteristic buckling resistance moment of unrestrained PEB at room temperature can be determined in accordance with EN 1994-1-1
[15], Eq(3), that adapts the simple calculation method presented in EN
1993-1-1[16], using the characteristic strength of the materials.
Mb;Rk¼χLT;mod Mpl;Rk (3)
The modified buckling reduction coefficientχLT;moddepends on the
non-dimensional slendernessλLTand on theΦfactor which depends on
the imperfection factorαLT. Eqs.(4)–(8).
χLT;mod¼min
1;1 λ2
LT; χLT=f
(4)
χLT ¼1
ΦLTþ
ffiffiffiffiffiffiffiffiffiffiffiffiffiffiffiffiffiffiffiffiffiffiffiffi Φ2
LT β λ
2
LT
q
;χLT1 ∧χLT1
.
λ2LT (5)
ΦLT¼0:5
1þαLT
λLT λLT;0þβλ 2
LT
(6)
λLT¼
ffiffiffiffiffiffiffiffiffiffiffiffiffiffiffiffiffiffiffiffiffi
Mpl;Rk
Mcr
q
(7)
f ¼1 0:5 ð1 kcÞ
1 2
λLT 0:8
2
(8)
The recommended values proposed by EN1993-1-1 [16] are: the
maximum value for the plateau lengthλLT;0¼0:4 and the minimum value
for the correction factor β¼ 0:75. Curve “c” is proposed for lateral
torsional buckling of partially encased beams, based on the buckling
curves of columns in EN1994-1-1[15], which corresponds to an
imper-fection factorαLT¼0:49.
The elastic critical momentMcris determined according to Eq.(9),
based on gross cross sectional properties and takes into account the loading conditions, the real moment distribution and the restraints at supports and loading points (lateral displacement and axial rotation). This expression was calculated using the Ritz method, assuming the
stationarity of the total potential energy[17], using the restraints of the
experimental setup (four-point bending test with lateral displacement and axial rotation restraint at the supports and axial rotation restraint at the loading points).
Mcr¼30L
2
s
ðLs 2aÞ
ffiffiffiffiffiffiffiffiffiffiffiffiffiffiffiffiffiffiffiffiffiffiffiffiffiffiffiffiffiffiffiffiffiffiffiffiffiffiffiffiffiffiffiffiffiffiffiffiffiffiffiffiffiffiffiffiffiffiffiffiffiffiffiffiffiffiffiffiffiffiffiffiffiffiffiffiffiffiffiffiffiffiffiffiffiffiffiffiffiffiffiffiffiffiffiffiffi
2EIz
L3
s
GIt=105ðLs 2aÞ þ2EIw=
5ðLs 2aÞ
3 q
(9)
Lsrepresents the length between supports andLl¼Ls 2athe length
between loading points, see Fig. 2. The lateral torsional buckling
resistance moment of PEB is determined by the homogenized steel
sec-tion, so thatEandGin Eq.(9)represents elastic modulus and the shear
modulus of steel. The second order moment of area with respect to the
weak axis is represented byIz, the torsion constant byItand the warping
constant byIw, relatively to the homogenised steel section [6]. It is
assumed that only the 10% of the value corresponding to the total area of concrete, with their full depth as a whole, is considered in the torsion
constant of the homogenized section[15]and no concrete is considered
to the warping constant of the homogenised section, see Eqs. (10)
and (11).
Iz¼IzsþEc=EsIzc (10)
It¼Itsþ10%Gc=GsItc (11)
Eurocode EN1994-1-2[13]does not consider lateral torsional
buck-ling as a potential failure mode to PEB without concrete slab underfire.
To determine the characteristic buckling resistance moment at time t,
Mb;fi;t;Rk, the simplified formulae of Eurocode EN1993-1-2[14]may be
adapted for composite sections, using Eq.(12).
Mb;fi;t;Rk¼χLT;fi Mpl;θ;Rk (12)
The buckling reduction coefficient at elevated temperatures χLT;fi
depends on the non-dimensional slendernessλLT;θ;comand on theΦLT;θ;com
factor, which depends on the imperfection factorαunderfire conditions.
Eqs.(13) and (14).
χLT;fi¼1=
ΦLT;θ;comþ
ffiffiffiffiffiffiffiffiffiffiffiffiffiffiffiffiffiffiffiffiffiffiffiffiffiffiffiffiffiffiffiffiffiffiffiffiffiffiffiffiffiffiffiffiffiffiffiffi ðΦLT;θ;comÞ
2
ðλLT;θ;comÞ
2
q
(13)
ΦLT;θ;com¼0:5
1þα λLT;θ;comþ ðλLT;θ;comÞ
2
(14)
The non-dimensional slenderness at elevated temperature λLT;θ;com
depends on the ratio between the characteristic plastic moment resis-tance of PEB section and the elastic critical moment, both calculated at
elevated temperature (temperature assumed constant between
the supports).
λLT;θ;com¼
ffiffiffiffiffiffiffiffiffiffiffiffiffiffiffiffiffiffiffiffiffiffiffiffiffiffi
Mpl;θ;Rk
Mcr;θ q
(15)
The elastic critical moment depends on the load and support condi-tions, being the geometric properties of PEB section approximated by Eqs.(16) and (17), according to the characteristics of the homogenised
section, affecting the material properties by their reduction factors,Ea;θ¼
KE;θEa andGa;θ¼KE;θGa for structural steel, Ec;θ¼KE;θEc and Gc;θ¼
KE;θGcfor concrete, andEs;θ¼KE;θEsfor reinforced steel. The warping
constant of the homogenised steel section,Iw, is approached by the
warping constant of the steel section,Iwa, as specified for room
temper-ature analysis.
Iz¼IzaþEc;θ
Ea;θ⋅ðb twÞ
3
h 2tf
12þ ðEs;θ Ec;θÞ
Ea;θAsy2r
(16)
It¼It;aþ0;1⋅Gc;θ
Ga;θ1=3
1 0:63
b
h 2tf
h 2tf
b3
(17)
The imperfection factorαdepends on the steel gradefyof the material
being used, EN1993-1-2[14], Eq.(18).
α¼0:65
ffiffiffiffiffiffiffiffiffiffiffiffiffi
235
fy q
(18)
Vila Real et al.[18] proposed a new formulae to be used in fire
conditions, using the same approach for lateral torsional buckling design, taking into account the moment distribution between the lateral
re-straints. The reduction factor should be modified toχLT;fi;mod, according to
χLT;fi;mod¼χLT;fi
f ;χLT;fi;mod1 (19)
The factorf depends on the load type, using a correction factorkc,
according to Eq.(20). This approach makes factorfequal to 1.0, because
kc also equals 1.0, when considering four-point bending configuration,
beingχLT;fi;mod¼χLT;fiin this case.
f ¼1 0:5ð1 kcÞ (20)
4. Bending resistance - experimental tests
Twenty seven specimens were tested, divided into ten series. Two or three tests were considered for repeatability in each series and the results agree very well. Specimens were tested using a steel reaction portal
frame, with two fork supports, seeFig. 2.
Tests developed at elevated temperature, used electro-ceramic re-sistances to increase and maintain elevated temperature during loading. The control unit read, in real time, the temperature of two and four
control points (on the top and bottom of theflanges), for medium and
large test series respectively. Five different cross sections were defined to
measure temperature (S1, S1A, S2, S3A and S3), and one cross section
(SM) was defined to measure axial strain and displacements (verticalZG,
lateralYG).
Four-point bending test configuration was used to evaluate the
bending performance of laterally unrestrained PEB at elevated and room
temperature, seeTable 1. The bending resistance was also compared to
bare steel beams.
Two series (3–8) were prepared to analyse the behaviour of stirrups not welded to the web, four series (1,2,6,7) were prepared for testing the behaviour of PEB at elevated temperature using welded stirrups and four series (4,5,9,10) were prepared to be tested at room temperature. Two slenderness ratio were considered, using beams with total length Lt equal to 2.5 m and 4.0 m.
Some important load events were recorded for each test. The
pro-portional limit force Fp, the force Fy that results from the intersection
method between two straight lines drawn from linear and non-linear interaction of the vertical displacement; the load event for the displace-ment limit FL=30; and the maximum load level for the asymptotic behaviour of lateral displacement Pu.
4.1. Specimens and materials
PEB were casted in the laboratory, without the need of formwork.
Specimens were tested after more than 60 days, with respect to thefirst
casting phase, to ensure normal bond adhesion. The second casting phase
was performed one week after thefirst. This time delay did not influence
the behaviour of PEB, because the second casting used the same concrete composition and the same environmental conditions. Both casting phases
had sufficient cure time and concrete presented the same resistance in
both stages.
The surface of materials had no special treatment and were used as delivered by manufacturers. Steel elements were cut from long steel beams, using traditional machinery and stirrups were welded to the web
of steel profile using a MIG/MAG welding system. Reinforcement was
spot welded to stirrups in the case of PEB with welded stirrups and tied with wire rope in the case of PEB without welded stirrups.
The geometric imperfection was also characterized by the laser method, measuring the distance between a perfect line (laser beam) and
the lateral imperfection of geometry, spaced every 0.5 m, seeTable 1for
the maximum lateral imperfection. The characteristic geometry of every IPE100 was also measured and the average dimensions of the main
components were determined (mm) and took into account: tw¼4:5, tf¼
5:8, h¼102:4 and b¼54:8.
The steel was characterized according to international standards[19]
for hot rolled and cold formed, seeTable 2. Three samples were collected
from the web of the hot rolled steel profile and two more samples were
collected from steel reinforcement. The elastic modulus E, the proof
strength for 0.2% strain Rp:0:2%, the upper yield strength ReH, the lower
yield strength ReL, the tensile strength Rmand the total extension at the
moment of fracture At are presented in this table.
Concrete was made with Portland cement, sand and siliceous aggre-gates. The compressive strength of concrete was determined according to
Table 1
List of tested beams (specimens) and main force events.
Series Specimen Length
Ls [m]
Stirrups [W/NW]
Temp. [C]
Max. Imp. Abs. [mm]
FMpl [N]
(Eq.(1)) (Eq.(2)) Fp [N]
Fy [N]
FL=30 [N]
Pu [N]
1 B/2.4–01 2 11910 18890 24932 38864
B/2.4–02 2.4 W 400 2 32013 13627 21760 26583 31533
B/2.4–03 2 12540 19920 24878 33568
2 B/2.4–04 1 24770 31430 34060 36875
B/2.4–05 2.4 W 200 2 32388 26030 30350 32953 39042
B/2.4–06 1 26580 31380 33930 34712
3 B/2.4–07 1 13050 20610 24898 29000
B/2.4–08 2.4 NW 400 1 32013 12960 19270 25135 40861
B/2.4–09 1 11920 20850 25722 33246
4 B/2.4–10 2 27050 34966 35000 35015
B/2.4–11 2.4 W room 0.5 32584 25960 35410 36360 37624
B/2.4–12 3 26600 34600 35962 39246
5 B/2.4–11A 2.4 – room 1 26273 16107 – – 29627
B/2.4–12A 2 15530 – – 28477
6 B/3.9–01 2 11190 16370 22126 30204
B/3.9–02 3.9 W 400 5 32013 11920 16360 22715 27290
B/3.9–03 3 11700 14850 22573 28337
7 B/3.9–04 2 4110 9620 12641 22456
B/3.9–05 3.9 W 600 2 14949 4360 9750 12996 21662
B/3.9–06 5 4090 9110 12025 22770
8 B/3.9–07 5 11170 15260 22665 23591
B/3.9–08 3.9 NW 400 5 32013 13160 16540 24237 32642
B/3.9–09 2 10720 15400 23200 24815
9 B/3.9–11 3.9 W room 2 32584 26500 31350 35405 38718
B/3.9–12 5 29020 32010 36159 36264
10 B/3.9–11A 3.9 – room 1 26273 15023 – – 19436
the European standard[20], using 3 samples for cubic and cylindrical
geometry and the results are presented inTable 3. The mixture of 1 [m3]
of concrete presented a mass of sand equal to 1322.7 [kg], the mass of aggregates was equal to 451.1 [kg] and the volume of water was 198 [l]. The mass of cement was 466.7 [kg], which gave a water/cement ratio of 45%. The aggregates (gravel and sand) were characterized by the sieving
method and tested according to the European standard[21]to determine
the particle size distribution. Due to the small size of the steel section and considering the offset dimension for the concrete cover of the stirrups, the concrete used small-sized aggregates. The percentage of aggregates with diameters between 4 and 6 mm was 90%, while the percentage of sand with diameters between 0.063 and 0.5 mm was 80%. The aggregate dimensions limit the value of the compressive resistance of concrete, as
concluded by Keru et al.,[22]. The high level of permeability at elevated
temperature was responsible for the pore pressure decrease, justifying the absence of explosive spalling.
PEB were prepared to be tested at room temperature, measuring
strain in central section (SM), over steelflange and web, in hot rolled
section (SM-FS and SM-WS) and over concrete (SM-RS1 and SM-RS2). Whereas perfect bond was assumed between concrete and
reinforce-ment, concrete strain was measured on steel reinforcement. Allfive strain
gauges were protected with gloss and special viscous putty against aggression of moisture, water and mechanical damage.
PEB were also prepared to be tested at elevated temperatures, using
thermocouples type K, positioned infive sections along the length of the
beam. Some thermocouples were also welded to a small steel washer and wrapped in concrete for its temperature measurements, at positions Si-IC and Si-OC.
4.2. Experimental set-up and test procedure
Tests developed at room temperature used quasi-static load in-crements, based on four load cell readings. Load was applied with two synchronized hydraulic jacks. Strain, displacement and cross section rotation were determined at central section (SM).
Tests developed at elevated temperature used electro-ceramic heating unit to increase and maintain elevated temperature during the
mechan-ical loading. A heating rate of 800C/hour was applied on the top and
bottomflanges of the beams, which lead to heating periods of 15, 30 and
45 min to attain 200C, 400C, and 600C. A ceramic mat insulation
was used around the beams to increase the heating efficiency. Supports
were adjusted and load was applied after temperature stabilization over the cross section (60, 90 and 120 min after the start of heating). The vertical and lateral displacement and the cross section rotation were measured in the central section. Load events and temperature measure-ments were also recorded in the main cross sections.
Two fork supports were materialized as simple supports. Restraint
against Y and Z displacement and restraint against X rotation were applied at each support. A contact steel interface was developed to apply the vertical load, introducing a level of restraint against X rotation but
allowing for lateral displacement Y, using Teflon to reduce friction
be-tween the steel interface and the hydraulic jack.
The length of specimens to be heated (Lf¼1300 mm for series 1–5
and Lf¼2700 mm for series 6–10) was shorter than the length between
loading points (Ll¼1500 mm for series 1–5 and Ll¼3000 mm for series
6–10). The distance between load and support was kept constant for all series (450 mm). Free thermal elongation was allowed before adjusting both supports and the start of loading in each test.
Vertical and lateral displacements (ZG,YG) as well as cross section
rotationθGwere calculated on the basis of the measurement of three wire
potentiometric displacement transducer.
The two-point load and reactions were measured by load cells, being the load averaged to draw force displacement results.
4.3. Results at room temperature
The bending performance of PEB was compared with the perfor-mance of bare steel beam at room temperature (series 4–5 and series
9–10), using the same steel profile. This comparison can be used to
un-derstand the lateral torsional buckling behaviour at elevated
tempera-tures. The load deflection behaviour is different in particular during post
buckling (see vertical displacement after achieving the proportional limit force), although both attained the lateral torsional buckling as deformed
mode shape. Theflexural stiffness of PEB is 15% higher than bare steel
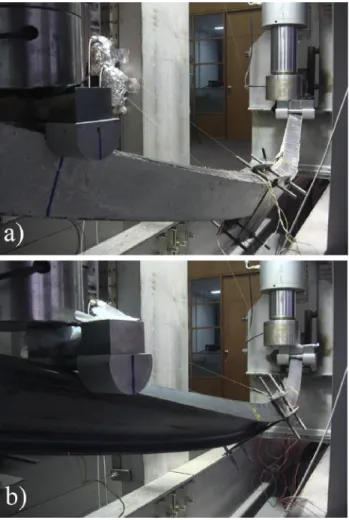
beam (for both length series).Fig. 4shows the deformed mode shape for
the last load step of each beam (PEB and bare steel).
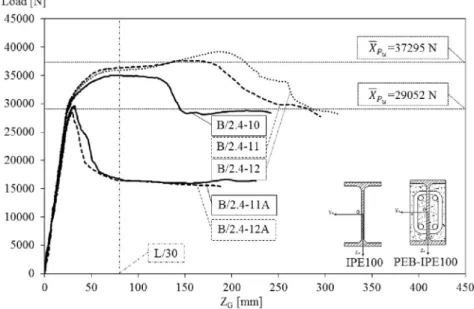
Figs. 5–6present the vertical or transversal displacement history for Table 2
Tensile tests for hot rolled and cold formed steel.
Properties Steel profile Steel reinforcement
Average±S. D. Average±S. D.
E [GPa] 197.9±2.9 203.3±2.1
Rp.0.2%[MPa] 300.7±6.7 525.0±3.5
ReH [MPa] (fyk) (fsk) 302.4±5.7 531.5±7.9
ReL [MPa] 300.8±4.0 520.8±4.1
Rm [MPa] (fu) 431.2±5.0 626.6±11.5
At [%] 41.6±0.2 25.2±0.5
Table 3
Compressive test results for concrete.
Properties Cure [days] Average±S. D.
fck,cube[MPa] 29 21.4±1.0
fck[MPa] 29 20.4±0.3
each length series. The encased reinforced concrete between theflanges causes, in specimens exposed to room temperature, an increase in
ulti-mate load Puof 28.4% and 84.2% for PEB series 4 and 9 with respect to
IPE bare steel series 5 and 10, respectively.
The main load events are also compared between PEB and bare steel
beam. Due to different load deflection behaviour, only the ultimate load,
Pu, is able to be compared, seeTable 4. This load eventXPucorresponds to
the average of the maximum load of each series. Both length series
confirmed that post buckling is quite different between PEB and bare
steel I beams. After the bifurcation point, load decreased in bare steel beams, as expected.
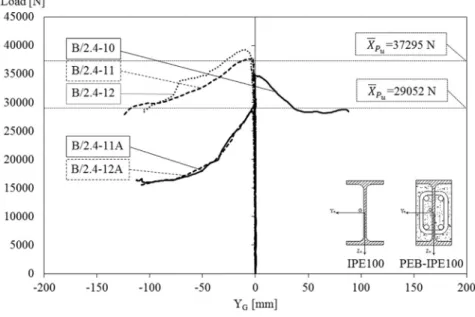
Lateral displacement exhibits similar behaviour in both PEB and bare
steel beams, seeFigs. 7–8. The increase in lateral displacement is
fol-lowed by a decrease of load, after reaching the bifurcation point. The positive or negative value of displacement depends mainly on the geo-metric imperfection of each beam. At the end of some tests, during the
post buckling stage, the increase of load may be justified by the
restraining forces of the supports, due to the high level of displacement (vertical and lateral).
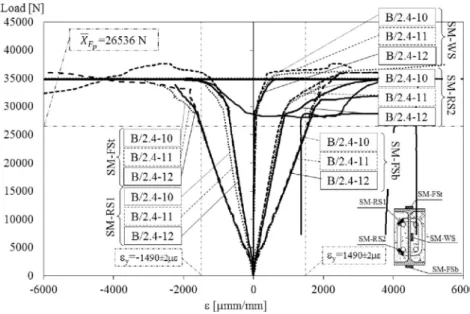
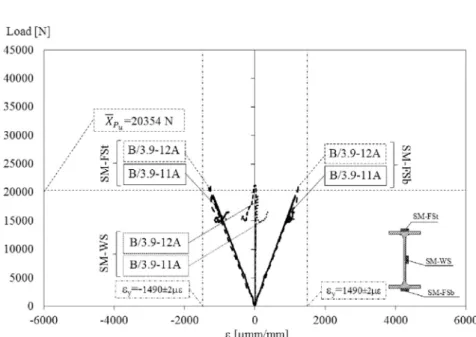
PEB and bare steel beams behaved on the elastic and plastic region for
the case of medium series 4–5, as verified by the strain records, see
Figs. 9–10. The average value for the load limit of proportionality,XFp, is
also represented in the graph for comparison with strain measurements,
being this load event coincident with the yielding limit of theflanges. The
elastic limit for strain over steel is also depicted on both graphs. The strain is initially linear proportional to load, changing its behaviour after Fig. 5.Vertical displacement for medium series 4–5.
Fig. 6.Vertical displacement for large series 9–10.
Table 4
Main load events to bending resistance on PEB series 4–5 and 9–10.
Series XPu[N] XFL=30[N] XFy[N] XFp[N]
4 37295 36161 35008 26537
5 29052 – – –
9 37491 35782 31680 27760
reaching the yielding limit of the material.
The large PEB series (9) behaved in elastic and plastic region, while bare steel beam, series 10, with same length did not reach the yielding
limit seeFigs. 11 and 12. The decrease of the load in bare steel beam,
after bifurcation point, also produced a decrease in strain, following the same curve used before reaching that point.
4.4. Results at elevated temperature
The bending performance of PEB was compared for different
tem-perature levels (200C, 400C, and 600C), corresponding to bending
tests (1–2) of medium series and to the bending test of large series (6–7).
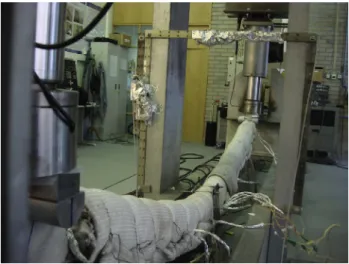
The deformed failure modes of PEB are represented inFigs. 13–15, as an
example of each test series. Lateral torsional buckling mode was verified
for all tested beam series between 200 and 400 C and for all beam
length. For the higher testing temperature (600C), and for the large
specimen series, all tested beams revealed the formation of a plastic
hinge without any significant lateral displacement. Due to high
magni-tude of vertical displacement and also due to effect of plasticity, the
deformed failure mode for all tests of series 7 (PEB at 600C) is
domi-nated by plastic hinge formation (PH), rather than by LTB. No significant
lateral displacement was determined, seeFig. 28. This emphasises the
main difference behaviour in LTB between PEB and bare steel beams. The
same bare steel beam was already submitted to 600C and attained LTB
as deformed failure mode[23]. More tests should be developed at this
temperature level using different PEB lengths.
Temperature was recorded in several cross sections along each beam
length.Figs. 16–18provide an example of the heating performance of
PEB tested at 200C, 400C, and 600C, respectively for test of
spec-imen B/2.4–04, B/3.9–01 and B/3.9–05. The increase of temperature
follows the heating rate of 800C/h, revealing the moisture effect near
100C. The average temperature on the cross section (S2) converges to
the specified temperature of each test. Due to high temperature of the test
series 7 (600C), a higher difference between maximum and minimum
Fig. 7. Lateral displacement of test series 4–5.
temperature was detected in this cross section, mainly justified by
insufficient insulation.
Both stages of experiment are identified, corresponding to the
in-crease of the temperature of the beam (stage 1) and later by the inin-crease of the mechanical load (stage 2. Temperature evolution were also
ob-tained in the other sections (S1, S1A, S3, S3A)[24].
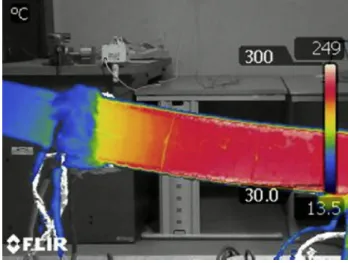
Figs. 19–21 show the infrared thermography of three specimens immediately after removing the insulation, representative of each
tem-perature test (200C, 400C, and 600C). The temperature gradient
along X axis is verified near the extremities of heated length (section
S3A), proving the existence of the heatflow along the beam axis. Similar
gradient was verified in sectionS1A. The heatflow was also verified from
the inside of the beam to the outside. The maximum temperature on the
external surface of the insulation blanket was 80, 200 and 270C, for
specimens B/2.4–04, B/3.9–01 and B/3.9–05, during tests.
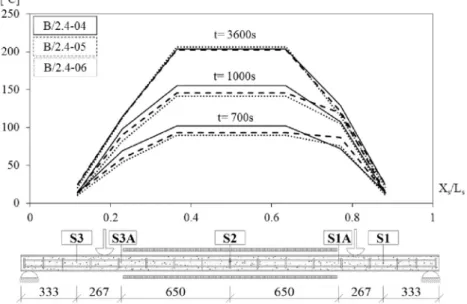
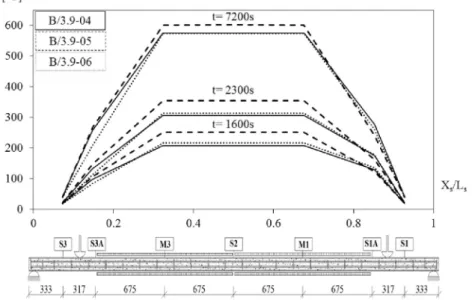
The temperature profile along the beam length was also calculated by
the average values of the temperatures measured in each cross section S1, S1A, S2, S3A, and the thermocouples of the heating device. The average
temperature in sectionS3Ais smaller than temperature of the test, due to
boundary condition effect (heatflow along the beam to the extremities,
confirmed by results of infrared thermography). For each test, only three
time instants are depicted onFigs. 22–24. Two intermediate time instants
were considered during the heating phase and the last is close to the start of the incremental load (t1). All other tested revealed similar perfor-mance, being the results of series 2-6-7 representative of the tests
developed at 200C, 400C, and 600C. Test results of series 7 show an
important temperature gradient near the extremities of the heating
length of approximately 0.455C/mm, being higher than temperature
gradient of series 2 and 6 (0.286C/mm and 0.306C/mm, respectively).
This temperature gradient is of some importance when doing the com-parison of the results, because it represents an extra amount of resistance that is not consider in the simple calculation method. The simple calcu-lation method assumes constant temperature over the length Lf.
Fig. 25represents the results of vertical displacement for medium series 1-2-4, used to analyse the temperature effect on bending resistance for the case of beams with welded stirrups. The measured load versus Fig. 9.Strain records, for series 4.
Fig. 11.Strain records, for series 9.
Fig. 12.Strain records, for series 10.
vertical displacement is represented, sowing similar behaviour for different temperature level. Results agree very well for the specimens of
the same series, with exception to the ultimate loads Fu (very large
displacements). All tested beams reached lateral torsional buckling (LTB) as deformed failure mode.
Fig. 26shows the results of the vertical displacement for large series 6-7-9, also used to analyse the temperature effect on the bending resis-tance of the large PEB series.
Table 5presents the main load events for the medium and large series,
with welded stirrups. PEB exposed to 200C present a reduction of 1.1%
in Furelative to PEB at room temperature, 7% in the load event for the
displacement limit FL=30, 11.3% in the load event Fyand 2.8% in the load
limit Fp. Although PEB subjected to 400C just present a 7% reduction in
the value of the ultimate load Puwith respect to room temperature, there
is a big difference in the other load events: the load for the displacement
limit FL=30was reduced by 29.5%, the yield force Fyfell 42.3% and the
load at the proportional limit Fpdecreased 52.1%. The large series of PEB
submitted to 400C present a reduction of 23.7% in Purelative to PEB at
room temperature, 37.2% in the load event for the displacement limit
FL=30, 49.9% in the load event Fyand 58.2% in the load limit Fp.
The deformed mode shape for PEB submitted to 400C was lateral
torsional buckling.
PEB subjected to 600C present a 40.5% reduction in the value of the
ultimate load Pu, 64.9% reduction in the load event for the displacement
limit FL=30, 70% reduction on the yield force Fyand 84.9% reduction on
the proportional limit force Fp. The deformed failure mode occurred with Fig. 15.Deformed failure mode for test specimen B/3.9–05, tested at 600C.
Fig. 16.Temperature evolution on section S2, for beam test B/2.4–04.
the formation of a plastic hinge.
Typical load versus lateral displacement of PEB at elevated
temper-ature are depicted inFigs. 27 and 28. Both series present similar results
with exception to those tested at 600C. The specimens of series 7 do not
present significant lateral displacement. All other series present signifi
-cant lateral displacement followed by a decrease of load, after reaching the ultimate load Pu. The average of the ultimate load is also presented on both graphs.
The shear effect of stirrups into the bending resistance of PEB was also analysed. Two series were dedicated to evaluate the shear effect of stir-rups, considering stirrups welded to the web of the steel beam (W) and stirrups not welded (NW). Both tests were developed into different beam
lengths (medium and large series) and performed at 400C. The
tem-perature evolution is very similar to other specimens. The type of connection between stirrups and the web (W versus NW) does not affect the temperature performance of the beam and the temperature evolution
in all cross sections, as already shown in a previous work[24].
The vertical displacement is represented inFigs. 29 and 30for both
length series. The beams with stirrups not welded to the web of the beam
present similar load event FL=30 when compared to beams with welded
stirrups. The same type of behaviour was verified for both length series
(medium and large). Fig. 18.Temperature evolution on section S2, for beam test B/3.9–05.
Fig. 19.Temperature gradient near section S3A, for specimen B/2.4–04.
Fig. 20.Temperature gradient near section S3A, for specimen B/3.9–01.
There is no significant difference in bending resistance and stiffness.
The high degree of confinement of the concrete and the dimension of the
cross section (IPE100) promotes the steel-concrete bond contact, which is responsible for this similar behaviour.
Table 6represents the main load events during tests. For the medium length series the maximum difference in any load event is smaller than 1%, while for the large length series the maximum difference is smaller than 5.6%.
All tested beam with welded and not welded stirrups attained the same deformed mode shape (LTB), generating similar graphical results for lateral displacement and cross section rotation. The ultimate load is similar for both conditions and for medium and large series.
5. Analysis of results: comparison with simple calculation method
The experimental results under incremental load show that PEB will
first deflect downwards, and when the load exceeds a specific value, it
moves sideways and rotate about the longitudinal axis due to instability
of the compressionflange. This behaviour is in some extent different
from bare steel beam, because in this case beams deflect and twist out of
the plane of loading from the early beginning of the loaded beam. The main characteristic of LTB is that the entire cross section rotates as a rigid cross section without distortion. Concrete reached failure by cracking and crushing, due to the applied bending moment. Similar crack patterns were observed in all tested PEB. The pattern of cracks associated with the low heating rate and the high permeability of the concrete, justify the absence of explosive concrete spalling. Local buckling of the reinforce-ment was also observed for the medium length specimens.
The reduction of the bending resistance of PEB series 1, 6 and 7,
Mb;fi;t;Rd=Mb;Rd(specimens submitted to 400C and 600C) based on the
simplified method, adapted from Eurocode EN1993-1-2[14], are
prop-erly adjusted to the experimental reduction factorXFL=30;θ=XFL=30, when
considering the load event for the displacement limit FL=30. The reduction
of the bending resistance at 200 C on series 2, using Eurocode
Fig. 22.Temperature profile of the beam tests series 2.
Fig. 25.Vertical displacement on PEB series 1-2-4.
underestimates the bending resistance when using any of the load events
Pu, FL=30, Fyor Fp, seeTable 7.
Figs. 31 and 32 represents the comparison between experimental
results and the simplified calculation method adapted from Eurocode
EN1993-1-2[14]. The analytical reduction factor for the bending
resis-tance of PEB at elevated temperature is properly adjusted to the experi-mental reduction factor of the tests, when considering the main load
event Fyduring experiments.
6. Conclusions
This paper has presented the bending performance of twenty seven
beams at different temperature levels (room, 200C, 400C, and 600C),
using the setup of four-point bending test. Tests consider only one cross section type (one steel section and one type of concrete), two beam lengths and two different shear conditions for stirrups. The performance of PEB was also compared to bare steel I beam, at room temperature.
Experimental measurements confirmed that temperature is not
con-stant over the heating length, presenting strong gradients at the ex-tremities of the heating length. This can explain an over prediction of experimental bending resistance in comparison to the simple calculation method, adapted from Eurocode.
Progressive damage of concrete occurred during experiments. Normal cracks due to tensile stress were the most visible ones, while crushing of concrete occurred due to developing of compressive stress and failure mode shape.
The bending resistance of the PEB, at room temperature, is higher than the bending resistance of bare steel beam. The reduction on bending Table 5
Main load events to bending resistance on PEB series 1-2-4 and 6-7-9.
Series Temperature XPu[N] XFL=30[N] XFy[N] XFp[N]
1 400C 34655 25464 20190 12692
2 200C 36876 33648 31053 25793
4 Room 37295 36161 35008 26537
6 400C 28610 22471 15860 11603
7 600C 22296 12554 9493 4187
9 Room 37491 35782 31680 27760
Fig. 27.Lateral displacement on PEB series 1-2-4.
resistance of PEB is not directly proportional to the increase of
temper-ature. The bending behaviour of PEB at 200C is quite similar to the
behaviour at room temperature. An increase of temperature from 200C
to 400C caused a reduction of 24% on the load event FL=30for medium
series, while an increase of temperature from room to 400 C and to
600C caused a reduction of 37% and 64% on the load event of FL=30,
respectively. Although the strength of PEB is not proportional to the
strength of material, the reduction coefficient of the yielding stress of
steel is reduced by 53% at 600C.
The deformed failure mode was identified as lateral torsional
buck-ling for all tested PEB and bare steel beams, with exception to those
tested at 600C, presenting plastic hinge formation, with no
suscepti-bility to lateral torsional buckling.
The bending stiffness of PEB, at room temperature, is 15% higher
than the bending stiffness of bare steel beam, verified for both, medium
and large series.
The post buckling deformation of bare steel beams is quite different from PEB. Bare steel beams presented a decrease of load after reaching the ultimate load and a bigger cross section rotation.
The bending behaviour of PEB without welded stirrups (NW) is very similar to the behaviour of PEB with welded stirrups (W), due to the dimension of the cross section of the specimens.
The concrete is responsible to an increase of 20% and 75% in the lateral torsional buckling resistance of PEB with respect to bare steel beam, as demonstrated at room temperature conditions.
Fig. 29.Vertical displacement on PEB series 1 and 3.
Fig. 30.Vertical displacement on PEB series 6 and 8.
Table 6
Main load events to average bending resistance on PEB series 1,3,6 and 8.
Series Temperature Stirrups XPu[N] XFL=30[N] XFy[N] XFp[N]
1 400C W 34655 25464 20190 12692
3 400C NW 34369 25251 20243 12643
6 400C W 28610 22471 15860 11603
Eurocode 4, part 1.2 [13] doesn't assumes the lateral torsional buckling failure mode of Partially Encased Beams. This research proves that this requirement should be included for the structural design of
composite steel and concrete buildings exposed tofire.
Experimental results were compared with the results of the simple
calculation method, adapted from Eurocode EN1993-1-2 [14],
concluding that this standard presents conservative results in the ma-jority of the cases and unsafe results in very few cases (series 1).
Further work may be required to generalize thefindings, using other
PEB cross sections, lengths and temperature levels. More tests are
required to verify the behaviour of different cross sections and slender-ness of PEB. Also a numerical validation in on going and future de-velopments are expected.
Acknowledgements
Authors acknowledge material support to the following companies
and institutions: Arcelor–Mittal (Spain), J. Soares Correia (Portugal),
Fepronor (Portugal), Hierros Furquet (Spain) and D. Samuel Solorzano Barruso Memorial Foundation-University of Salamanca (Spain). Table 7
Bending resistance on PEB series 1-2-6-7 at elevated temperature with reduction factors to room temperature.
Series Temperature XPu;θ=XPu
(experimental)
XFL=30;θ=XFL=30 (experimental)
XFy;θ=XFy
(experimental)
XFp;θ=XFp
(experimental)
Mb;fi;t;Rd=Mb;Rd
(Simplified method)
2 200 [C] 0.99 0.93 0.89 0.97 0.72
1 400 [C] 0.93 0.70 0.58 0.48 0.64
6 400 [C] 0.76 0.63 0.50 0.42 0.49
7 600 [C] 0.60 0.35 0.30 0.15 0.20
Fig. 31.Comparison between experimental results (FL=30) and Eurocode.
References
[1] Paulo A.G. Piloto, Ana B.R. Gavilan, Marco Zipponi, Alberto Marini, Luís M.R. Mesquita, Giovanni Plizzari, Experimental investigation of thefire resistance of partially encased beams, J. Constr. Steel Res. 80 (2013) 121–137.
[2] J.B. Schleich, Computer Assisted Analysis of the Fire Resistance of Steel and Composite Concrete-steel Structures (REFAO-cafir), Commission of the European Communities, Luxembourg, 1987.
[3] K. Kordina, Behaviour of composite columns and girders infire, in: Fire Safety Science-proceedings of the Second International Symposium, International Association for Fire Safety Science, Tokyo, Japan, 1989.
[4] R. Kindmann, R. Bergmann, L.-G. Cajot, J.B. Scleich, Effect of reinforced concrete between theflanges of the steel profile of partially encased composite beam, J. Constr. Steel Res. 27 (1993) 107–122.
[5] D. Hosser, T. Dorn, O. El-Nesr, Experimental and numerical studies of composite beams exposed tofire, J. Struct. Eng. 120 (10) (1994) 2871–2892.
[6] Lindner Joachim, Budassis Nikos, Lateral torsional buckling of partially encased composite beams without concrete slab, in: Composite Construction in Steel and Concrete IV, 2000, pp. 117–128. Conference Proceedings, May 28th to June 2nd, Banff, Alberta, Canada.
[7] R. Maquoi, C. Heck, V. Ville de Goyet, Lateral Torsional Buckling in Steel and Composite Beams. Book 1, 2 and 3, Technical Steel Research Final Report EUR 20888 EN. European Commission 92-894-6414-3, August 2002.
[8] I.M. Assi, S.M. Abed, Y.M. Hunaiti, Flexural strength of composite beams partially encased in lightweight concrete, Pak J. Appl. Sci. 2 (3) (2002) 320–323. [9] S. Nakamura, N. Narita, Bending and shear strengths of partially encased composite
I-girders, J. Constr. Steel Res. 59 (2003) 1435–1453.
[10] Kodaira Akio, Fujinaka Hideo, Ohashi Hirokazu, Nishimura Toshihiko, Fire resistance of composite beams composed of rolled steel profile concreted between flanges, Fire Sci. Technol. 23 (3) (2004) 192–208.
[11] A.Y. Elghazouli, J. Treadway, Inelastic behaviour of composite members under combined bending and axial loading, J. Constr. Steel Res. 64 (2008) 1008–1019. [12] de Nardin Silvana, H.C. El Debs Ana Lucia, Study of partially encased composite
beams with innovative position of stud bolts, J. Constr. Steel Res. 65 (2) (February 2009) 342–350.
[13] CEN EN 199412, Eurocode 4: Design of Composite Steel and Concrete Structures -Part 1–2: General Rules—structural Fire Design, CEN (European Committee for Standardization), Brussels, August 2005.
[14] CEN EN 199312, Eurocode 3: Design of Steel Structures Part 12: General Rules -Structural Fire Design, CEN (European Committee for Standardization), Brussels, April 2005.
[15] CEN EN 199411, Eurocode 4: Design of Composite Steel and Concrete Structures -Part 1–1: General Rules and Rules for Buildings, CEN (European Committee for Standardization), Brussels, December 2004.
[16] CEN- EN 1993-1-1, Eurocode 3: Design of Steel Structures - Part 1-1: General Rules and Rules for Buildings, CEN (European Committee for Standardization), Brussels, May 2005.
[17] N. Trahair, Flexural-torsinoal Buckling of Structures, E&FN Spon, 1993. [18] P.M.M. Vila Real, N. Lopes, L. Sim~oes da Silva, J.-M. Franssen, Lateral-torsional
buckling of unrestrained steel beams underfire conditions: improvement of EC3 proposal, Comput. Struct. 82 (20–21) (2004) 1737–1744.
[19] ISO TC 164, ISO 6892–1, Metallic Materials–Tensile Testing–Part 1: Method of Test at Room Temperature, International Standard, Switzerland, 2009. [20] IPQ (Instituto Portugu^es da Qualidade), NP EN 12390–3, Ensaios do bet~ao
endurecido. Parte 3: Resist^enciaa compress~ao de provetes, 2003 (in Portuguese). [21] IPQ (Instituto Portugu^es da Qualidade), NP EN 933–1, Tests for Geometrical
Properties of Aggregates—Part 1; Determination of Particle Size Distribution, Sieving Method, 2000 (in Portuguese).
[22] Wu Keru, Chen Bing, Yao Wu, Study of the influence of aggregate size distribution on mechanical properties of concrete by acoustic emission technique, Cem. Concr. Res. 31 (6) (May 2001) 919–923.
[23] P.M.M. Vila Real, P.A.G. Piloto, J.-M. Franssen, A new proposal of a simple model for the lateral-torsional buckling of unrestrained steel I-beams in case offire: experimental and numerical validation, J. Constr. Steel Res. 59 (2) (February 2003) 179–199.