The Brazilian Atlantic Forest: How much is left, and how is the remaining
forest distributed? Implications for conservation
Milton Cezar Ribeiro
a,*, Jean Paul Metzger
a, Alexandre Camargo Martensen
a, Flávio Jorge Ponzoni
b,
Márcia Makiko Hirota
caDepartamento de Ecologia, Instituto de Biociências, Universidade de São Paulo, Rua do Matão, 321, Travessa 14, 05508-900 São Paulo, SP, Brazil
bDepartamento de Sensoriamento Remoto, Instituto Nacional de Pesquisas Espaciais (INPE), Avenida dos Astronautas, 1758, 12227-010, São José dos Campos, SP, Brazil cFundação SOS Mata Atlântica, Rua Manoel da Nóbrega, 456, 04001-001 São Paulo, SP, Brazil
a r t i c l e
i n f o
Article history:
Received 17 September 2008
Received in revised form 10 February 2009 Accepted 14 February 2009
Available online 24 March 2009
Keywords:
Atlantic Forest Conservation Landscape ecology Fragment size Connectivity Matrix influence Edge effects Core area
a b s t r a c t
The neotropical Atlantic Forest supports one of the highest degrees of species richness and rates of ende-mism on the planet, but has also undergone a huge forest loss. However, there exists no broad-scale infor-mation about the spatial distribution of its remnants that could guide conservation actions, especially when systematic biodiversity data are not available. In this context, our objectives were to quantify how much of the forest still remains, and analyze its spatial distribution. We considered the entire Brazilian Atlantic Forest, and eight sub-regions, defined according to species distribution. The results revealed a serious situation: more than 80% of the fragments are <50 ha, almost half the remaining forest is <100 m from its edges, the average distance between fragments is large (1440 m), and nature reserves protect only 9% of the remaining forest and 1% of the original forest. On the other hand, our estimates of existing Atlantic Forest cover were higher than previous ones (7–8%), ranging from 11.4% to 16%. The dif-ferences among estimates are mainly related to our inclusion of intermediate secondary forests and small fragments (<100 ha), which correspond to approximately 32–40% of what remains. We suggest some guidelines for conservation: (i) large mature forest fragments should be a conservation priority; (ii) smal-ler fragments can be managed in order to maintain functionally linked mosaics; (iii) the matrix surround-ing fragments should be managed so as to minimize edge effects and improve connectivity; and (iv) restoration actions should be taken, particularly in certain key areas. The clear differences in the amount remaining and its spatial distribution within each sub-region must be considered when planning for bio-diversity conservation.
Ó2009 Elsevier Ltd. All rights reserved.
1. Introduction
Landscape structure parameters have been recognized as useful biodiversity surrogates, and are used in different steps of conserva-tion planning (Williams et al., 2002; Lindenmayer et al., 2008). Some rules of thumb are employed within a landscape perspective, such as the conservation of large fragments with high structural connectivity, whether provided by corridors, stepping stones, or high permeability of the surrounding matrix (Umetsu and Pardini, 2007; Umetsu et al., 2008; Uezu et al., 2008; Fonseca et al., 2009; Pardini et al., 2009; Vieira et al., 2009); as well as targeting the preservation of as much as possible of all natural landscape heter-ogeneity (Forman and Collinge, 1997; Haila, 2002; Fischer et al., 2006; Lindenmayer et al., 2006; Metzger, 2006). Although they have some limitations, such as not considering how different species perceive features of the landscape (e.g., functional
connectivity), landscape structure parameters can be particularly useful to establish general guidelines for conservation planning where broad-scale species inventories and biodiversity distribu-tion patterns are still unavailable (Fairbanks et al., 2001; see Ueha-ra-Prado et al., 2009for a example of ecological indicators), which is the case for most tropical areas.
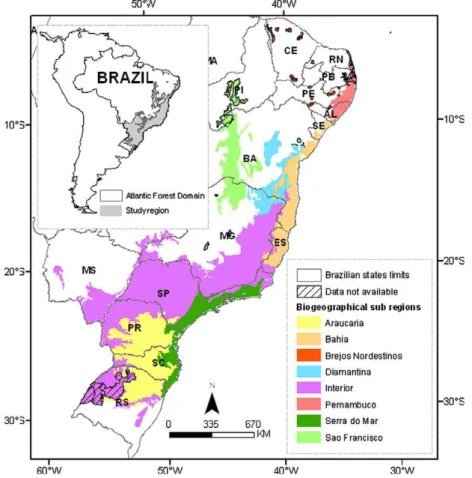
The Atlantic Forest was one of the largest rainforests of the Americas, originally covering around 150 million ha (Fig. 1), in highly heterogeneous environmental conditions. Its latitudinal range is around 29°, extending into tropical and subtropical
re-gions. The wide longitudinal range is also important in producing differences in forest composition, because of the decreased rainfall away from the coasts. Coastal areas receive large amounts of rain year-round, reaching more than 4000 mm, while inland forests re-ceive around 1000 mm/year (Câmara, 2003). These geographical characteristics, combined with the large altitudinal range, have fa-vored high diversity and endemism, including more than 20,000 species of plants, 261 species of mammals, 688 species of birds, 200 species of reptiles, 280 species of amphibians, and many more
0006-3207/$ - see front matterÓ2009 Elsevier Ltd. All rights reserved.
doi:10.1016/j.biocon.2009.02.021
* Corresponding author. Tel.: +55 12 39227496; fax: +55 11 30918096.
E-mail addresses:[email protected],[email protected](M.C. Ribeiro).
Contents lists available atScienceDirect
Biological Conservation
species that still require scientific description (Goerck, 1997; Mit-termeier et al., 1999; Silva and Casteleti, 2003). The Atlantic Forest flora and fauna may include 1–8% of the world’s total species (Silva and Casteleti, 2003).
Most of the remaining Atlantic Forest exists in small fragments (<100 ha;Ranta et al., 1998) that are isolated from each other and are composed by second-growth forests in early to medium stages of succession (Viana et al., 1997; Metzger, 2000; Metzger et al., 2009). The few large fragments survived in locations where the steep terrain made human occupation particularly difficult (Silva et al., 2007). This present-day fragmentation has led to a large pro-portion of the forest’s vast biodiversity being threatened to extinc-tion; for example more than 70% of the 199 endemic bird species are threatened or endangered (Parker et al., 1996; Stotz et al., 1996; Goerck, 1997).
In these heterogeneous and highly diverse forests, which still hold many still-unknown species (Lewinsohn and Prado, 2005), biodiversity inventories are complex, expensive and time-consum-ing (Gardner et al., 2008; but seeUehara-Prado et al., 2009). De-spite the large amount of biological data generated in the Atlantic Forest region in recent decades (Silva et al., 2004; Silva and Casteleti, 2003), the lack of standardized inventory protocols and sampling efforts with poor spatial distribution have resulted in significant geographical data gaps, making it particularly diffi-cult to use this information for conservation planning by the usual methods (seeMargules and Pressey, 2000; Groves et al., 2002). At local scales, enough biological data is available for some areas to support conservation plans, but great difficulties arise in planning conservation actions for large regions. Moreover, most of the data are insufficient to properly support conservation planning, and
thus, abiotic surrogates such as landscape structure parameters are in most cases the only alternative (Metzger et al., 2008). In this context, the amount of habitat and fragmentation, which are key factors for biodiversity conservation (Wilcox and Murphy, 1985; Fahrig, 2003), are important variables to be considered in land-scape planning and management for biodiversity conservation.
Despite the potential of using landscape structure parameters in conservation planning, information on landscape structure in the Atlantic Forest is only available for small regions (<300,000 ha,
Jorge and Garcia, 1997; Viana et al., 1997; Ranta et al., 1998). The only data available for the entire Atlantic Forest region is the percentage of the remaining forest, but even in this case there are huge discrepancies among the different methods employed (e.g., 7–8% of the forest remains according toSOS Mata Atlântica/ INPE, 1993, 2000 and Galindo-Leal and Câmara, 2003; 10.6% according toSOS Mata Atlântica/INPE, 2008; and 27% according toIESB et al., 2007; Cruz and Vicens, in press).
We analyzed for the first time the spatial distribution of all the remaining Brazilian Atlantic Forest, in order to provide precise information about how much forest is left and how this forest is spatially arranged. We calculated parameters such as fragment size, amount of edge area, isolation, structural connectivity, and distance to conservation reserves of all existing fragments of the Brazilian Atlantic Forest region (ca. 245,000 fragments). These spatial analy-ses were performed on a multi-scale approach (Urban, 2005), in or-der to facilitate the biological interpretation of the landscape indices (within a perspective ofecologically scaled landscape indices; followingVos et al., 2001). This approach ensures a variety of bio-logical behaviors, considering for example a wide range of sensitiv-ity to gap-crossing abilities and to edge distance influences.
Additionally, to refine our understanding about the Atlantic Forest spatial structure, considering its different regional contexts, we performed the same analyses dividing the region by biogeographi-cal sub-regions (BSRs). The implications of the observed spatial pat-terns are discussed with regard to future conservation and restoration priorities for the entire Atlantic Forest in Brazil.
2. Methods
2.1. Study region and biogeographical sub-regions (BSRs)
The Atlantic Forest originally extended from 3°S to 31°S, and
from 35°W to 60°W, covering 148,194,638 ha (Fig. 1), mainly
extending along the Brazilian coast (92%), but also reaching into Paraguay (Cartes and Yanosky, 2003; Huang et al., 2007) and Argentina (Giraudo, 2003). The forest encompasses 17 Brazilian states, and is narrow in the north and wider in the south. It has complex boundaries with other types of formations such as the pampas in the south and the drier inland formations, such as the Bolivian Chaco and the Pantanal (west–southwest), the Cerrado (South American savanna, west) and the Caatinga (northwest).
We analyzed 139,584,893 ha (94%) of the original Brazilian
Atlantic Forest region, based on the extent defined in Brazilian leg-islation (Federal Decree No. 750/93 and Atlantic Forest law No. 11 428, of December 22, 2006), and slightly expanded according to the delimitation of BSRs bySilva and Casteleti (2003). The geographi-cal, historical and relief complexities observed in the Atlantic For-est region generate a scenario in which species are not homogeneously distributed, but rather are grouped in different BSRs (Silva et al., 2004; Silva and Casteleti, 2003). In order to prop-erly approach this complexity, we chose to conduct our analyses at two different geographical scales: (i) the entire Atlantic Forest; and (ii) by the BSRs proposed by Silva and Casteleti (2003). These authors defined five centers of endemism (Bahia, Brejos Nordesti-nos, Pernambuco, Diamantina and Serra do Mar) and three transi-tional regions (São Francisco, Araucaria and Interior Forests), based on bird, butterfly and primate distributions (Fig. 1). For general descriptions we used all eight BSRs. For structural landscape anal-yses, the Brejos Nordestinos sub-region (1,251,783 ha) was ex-cluded because of its naturally scattered distribution and relatively small area (<1% of the area studied). A detailed spatial analysis is thus provided for seven different BSRs (Table 1). Within these regions, the Interior is the largest (49%), followed by the Araucaria (17%), and then by the Bahia, Serra do Mar and São Fran-cisco regions with about 8–9% each.
2.2. Forest cover
Forest cover analyses were based on an Atlantic Forest vegetation map (reference year 2005; www.sosma.org.br and
www.inpe.br) produced by the SOS Mata Atlântica/INPE (2008). The map was projected to the Albers projection and the South America 1969 datum to assure accurate area calculation for large regions such as this one. These institutions have been mapping the Atlantic Forest cover since 1986, at 5-year intervals (SOS Mata Atlântica/INPE, 2000 and 2008). The map used for the analysis was constructed by visual interpretation of TM/Landsat-5 (TM) and CCD/CBERS-2 (CCD) images from 2005 (with a few images from 2004 when cloud cover did not allow image acquisition in 2005), viewed as color compositions on a digital orbital image mosaic with bands TM3 (red region in the blue filter), TM4 (near infrared, NIR, in the red filter) and TM5 (short wavelength infrared, SWIR, in the green filter) for Landsat-5, CCD-2 (green in blue filter), CCD-3 (red in green filter) and CCD-4 (NIR in red filter) for CBERS-2. This map shows three main vegetation classes, grouping several physi-ognomically and floristically distinct forests: mangroves, ‘‘rest-inga” (lowland forests on sandy soils near the coast) and forests (including coastal forests,Araucariamixed forests, and semi-decid-uous forests; Oliveira-Filho and Fontes, 2000). The three classes were included in the forest cover analysis, but mangroves and res-tingas were not considered in the configuration analyses because of their small spatial extent (4% of the remaining area) and
bio-logical differences. The mapping scale was 1:50,000 in vector for-mat, which was then converted to raster, with a 50 m spatial resolution (60,00048,000 cells), in order to improve metrics
computation.
The ‘‘forest” class included secondary forests in intermediate to advanced successional stages. The distinction between old growth and secondary forest is particularly difficult for the entire Atlantic Forest region because information about forest age is very scarce and available only at local scales. The old history of disturbances in the region ended in a lack of good age estimation, especially for old forests which regenerated before the 1970’, when satellite images started to be available. We are aware that forest definition could originate differences in forest cover and configuration results, and thus we opted to consider as forest areas which have an arbo-real structure as seen by TM and CCD orbital images. This definition corresponds to forests >15 years of regeneration, with dense arbo-real vegetation and canopy height >10 m (Teixeira et al., 2009).
2.3. Map quality
At the end of the visual classification procedure, the preliminary thematic map was reviewed by vegetation experts from each Bra-zilian state located in the Atlantic Forest region. Fieldwork was also conducted in order to resolve questions of interpretation.
To assess the accuracy of the final map, we superposed the SOS Mata Atlântica map on 10 reference cover maps (Table 1S), which were produced with high spatial accuracy (scales ranging from 1:10,000 to 1:50,000) and extensive field checking. Of these maps,
Table 1
Extent of the Atlantic Forest in the biogeographical sub-regions (BSRs, as proposed bySilva and Casteleti, 2003), and area mapped bySOS Mata Atlântica/INPE (2008). BSR Abbreviation Atlantic Forest domain Mapped bySOS Mata Atlântica/INPE (2008)
Area (ha) Area (ha) % mapped % of total mappeda
Araucaria arauc 25,379,316 25,379,316 100 17
Bahia bahia 12,241,168 12,241,168 100 8
Brejos Nordestinos brejo 1,251,783 85,249 7 1
Diamantina diama 8,289,516 8,200,259 99 6
Interior inter 72,784,790 68,417,731 94 49
Pernambuco perna 3,893,730 3,132,167 80 3
Serra do Mar semar 11,413,471 11,413,471 100 8
São Francisco sfran 12,940,866 10,715,533 83 9
Total 148,194,638 139,584,893 94 100
eight were available for the state of São Paulo (covering areas from 10,400 to 24,800,000 ha), one for the state of Minas Gerais (143,900 ha), and another for the state of Paraná (748,500 ha). The 10 selected regions have very different reliefs and climates, but were limited to the forest pattern observed in southeast Brazil. As a consequence, our accuracy analysis may be biased towards the patterns that occur in this area. We estimated the Kappa (Landis and Kock, 1977) and theG(percentage of pixels correctly classi-fied) statistics to check map accuracy (Table 1S). The Kappa values ranged from 0.167 to 0.818 (mean = 0.486). The SOS Mata Atlântica map showed low accuracy for only the region of one reference map. For the other nine reference maps the analyzed map was clas-sified as acceptable (n= 3), intermediate (n= 4), high (n= 1) and very high (n= 1) accuracy (according to the categories defined by
Landis and Kock, 1977). To arrive at an overall statistic, we calcu-lated a Kappa value weighted for the area of the reference maps, and obtainedK= 0.4 (i.e., acceptable accordingLandis and Kock, 1977classification).
We also estimated the errors of commission and omission, to capture the bias of our map. The commission error ranged from 0.2% to 8% (mean = 3%), with an area weighted mean of 2.9%. The omission error ranged from 3% to 89% (mean = 49%), with an area weighted mean of 37%. These results indicate that the map used for the analysis tends to underestimate the actual remaining vege-tation. This underestimation may occur because (1) early succes-sional stages are poorly mapped and (2) it is difficult to correctly map the small fragments (<30 ha). We also noticed that for some regions, the map does not accurately show remnants on slopes, which resulted in some confusion between ‘‘forest” andEucalyptus
ssp.plantations or early successional vegetation stages. Riparian forests were also poorly mapped, either because of their narrow shape or their overall small area. Despite these errors, the overall accuracy (G) ranged between 76% and 97%, which is an acceptable rate for maps at this large regional scale.
2.4. Forest configuration indices
Forest cover and configuration metrics were computed for the entire study region and for each of the different BSRs using GRASS 6.3 (Neteler and Mitasova, 2008;http://www.grass-gis.org), with some procedures done on ArcGis 9.2 (Esri, 2007) and Erdas 9.1 (Leica, 2006). The R language version 2.7.1 (R Development Core Team, 2008) was used for all data processing. We selected five con-figuration metrics that could be easily employed in conservation planning: fragment size, edge area, connectivity, isolation and dis-tance to nature reserves (Table 2). For edge area (and core area), connectivity and isolation, we performed a multi-scale approach (Urban, 2005) in order to consider different species’ perception of landscape structure.
Fragment size distributions allowed us to account the forest amount and number of fragments for different classes of size ( Ta-ble 2). Edge area was computed as the amount and percentage of forest area submitted to edge effects for different edge widths. All forest pixels with distances higher than an edge width level ( Ta-ble 2) were classified as core area.
Connectivity metrics were computed based on the graph the-ory (Urban and Keitt, 2001; O’Brien et al., 2006; Minor and Ur-ban, 2007; Fall et al., 2007), which is a method of measuring the functionally connected clump of fragments based on some simple linkage rules (Urban and Keitt, 2001). As linkage rules for our analysis we considered the distance among fragments reflecting different gap-crossing capacities (Martensen et al., 2008; Boscolo et al., 2008; Awade and Metzger, 2008; Table 2). The connectivity index was then calculated as the sum of the areas of clumped fragments, which can be interpreted as the functional available area (Martensen et al., 2008; Metzger et al., 2009). After generating connectivity maps, we computed the ex-pected cluster size as the mean clump size for each functional distance. The highest cluster size was also identified for the en-tire study region, as well as for each sub-region and for each functional distance.
To estimate mean isolation, we proposed an index adapted from the ‘‘Empty Space Function”, which is a spatial point pattern analysis (Baddeley and Turner, 2005; Fortin and Dale, 2005), that represents the mean isolation of a given random pixel from any forested one. We randomized 1,000,000 points over the entire Atlantic Forest region, and a distance map was generated for all fragments. We then successively removed the smaller fragments in several steps (Table 2) and computed the distance to the near-est fornear-est in each step. These values represent the isolation of for-est areas, but are particularly useful in providing insights about the importance of the smaller fragments (or the capacity of the species to use these small fragments as stepping stones; Uezu et al., 2008).
To assess the amount of Atlantic Forest protected by the Brazil-ian Protected Area network, we superposed on the remnants map, a map ofNature Reserves(strictly protected areas classified as ‘‘
pro-teção integral”; MMA, 2007), which comprises 249 reserves
(2,260,350 ha). The distance from nature reserves was also calcu-lated for each forest pixel (seeTable 2for classes of distance from reserves).
3. Results
3.1. Forest cover
Of the total mapped area (139,584,893 ha), 15,719,337 ha of forest (11.26%) and 658,135 ha (0.47%) of restinga and mangrove
Table 2
Landscape metrics used to analyze the Atlantic Forest configuration.
Index Explanation Classes or rules
Fragment size distribution
Number of fragments and percentage of forest cover for different size classes Fragment size classes (ha): <50, 50–100, 100–250, 250–500, 500– 1000, 1000–2500, 2500–5000, 5000–10,000, 10,000–25,000, 25,000–50,000, 50,000–100,000, 100,000–250,000, 250,000– 500,000 and 500,000–1200,000
Edge area Percentage of area submitted to edge effects for different edge widths Edge widths (m): <50, 50–100, 100–250, 250–500, 500–1000, 1000–2500, 2500–5000 and 5000–12,000
Connectivity Area of functionally connected fragments considering different distance rules for fragment linkage
Linkage distances (m): 0, 100, 200, 300, 400, 500, 1000 and 1500 Mean isolation Mean isolation of random points to the nearest forest fragment. To analyze the
effect of small fragments in estimating isolation, the smallest fragments were successively removed.
Size of the small fragments removed (ha): 0 (i.e., no fragment removed), <50, <100, <150, <200, <350 and <500
Distance from Nature Reserves
vegetation (Table 3) still remain. Thus, 88.27% of the original Atlan-tic Forest has been lost, and only 11.73% of the original vegetation (16,377,472 ha) remains (Fig. 2andFig. 1S[a–g]). Considering the estimated commission and omission errors for the map analyzed (Table 1S; seeMap quality section for details), we consider that the actual remaining vegetation might range from 11.4% to 16.0% in the entire Atlantic Forest region.
The best-preserved BSR is the Serra do Mar, which holds 36.5% of its original vegetation, followed by the Bahia (17.7%) and Brejos Nordestinos (16%) regions. In contrast, the São Francisco region has only 4.7% of forest cover, and the Interior Forest, 7.1% (Table 3). However, in absolute terms, more than half of the remaining forest is located in the Serra do Mar and Interior Forest regions, whereas less than 15% is located in the Diamantina, São Francisco, Brejos Nordestinos and Pernambuco regions (Table 3).
3.2. Number of fragments and size distribution
The Atlantic Forest is currently distributed in 245,173 forest fragments. The largest fragment is located in the Serra do Mar, mainly along the coastal mountains of the state of São Paulo, and extends from the state’s southern border northwards into the southern part of the state of Rio de Janeiro. This single fragment contains 1,109,546 ha of continuous forests, which represents 7% of what remains (Fig. 2andFig. 1S-f). The second- and third-largest fragments are also located in the Serra do Mar, and contain 508,571 ha (coastal zone of Paraná state) and 382,422 ha (coastal zone of Santa Catarina state). Altogether, the three largest frag-ments account for more than 2 million ha, i.e., more than 13% of the remaining forest. In contrast, 83.4% of the Atlantic Forest frag-ments (204,469 fragfrag-ments) are smaller than 50 ha, and together
Table 3
Remaining Atlantic Forest in each biogeographical sub-region (BSR), with its area in ha and percentage. Data were obtained by superposing the map generated bySOS Mata Atlântica/INPE (2008)and the boundaries of BSRs adapted fromSilva and Casteleti (2003).
BSR Remaining forest Remaining restinga/mangrove Total remaining Atlantic Forest Area (ha) %a Area (ha) %a Area (ha) %a
Araucaria 3,202,134 12.6 3,202,134 12.6
Bahia 2,047,228 16.7 115,059 0.9 2,162,287 17.7
Brejos Nordestinos 13,656 16.0 13,656 16.0
Diamantina 1,109,727 13.5 1,109,727 13.5
Interior 4,807,737 7.0 32,451 4,840,188 7.1
Pernambuco 360,455 11.5 19,363 0.6 379,818 12.1
Serra do Mar 3,678,534 32.2 491,263 4.3 4,169,797 36.5
São Francisco 499,866 4.7 499,866 4.7
Total 15,719,337 11.26 658,135 0.47 16,377,472 11.73
a Percentages are in relation to the BSR area.
they account for 20.2% of the total forest remnants (ca. 3,178,030 ha;Fig. 3) according to our estimates. Fragments smaller than 250 ha represented more than 97% of the total number, and accounted for almost 42% of the total forest area. In contrast, only 0.03% (77 fragments) are larger than 10,000 ha, and together these include almost 4 million ha.
Small fragments (<50 ha) are, by far, the largest part of the number of remnants in all BSRs. The distribution of fragments according to their size followed an inverted ‘‘J” shape (Fig. 2S). However, the Serra do Mar region, in addition to having many small fragments (79% of the fragments is <50 ha), has much of
the forest existing as large fragments (>50,000 ha), which repre-sent more than 50% of the forest cover in the region. This region is the only one with a fragment larger than 1 million ha in size, which is located along the coastal mountains of São Paulo. The other regions do not contain any fragment larger than 250,000 ha, and only the Araucaria Forest (n= 4) and the Interior Forest (n= 1) have forest fragments larger than 50,000 ha (Fig. 2S): the inland forests of Santa Catarina, including the São Joa-quim National Park, and the Iguaçú National Park, respectively. In the Bahia region, the largest fragment covers approximately 29,000 ha, while in the São Francisco and the Pernambuco regions, none exceeds 10,000 ha (see Fig. 2S[a–g] for detail); and in the Diamantina, none is larger than 25,000 ha.
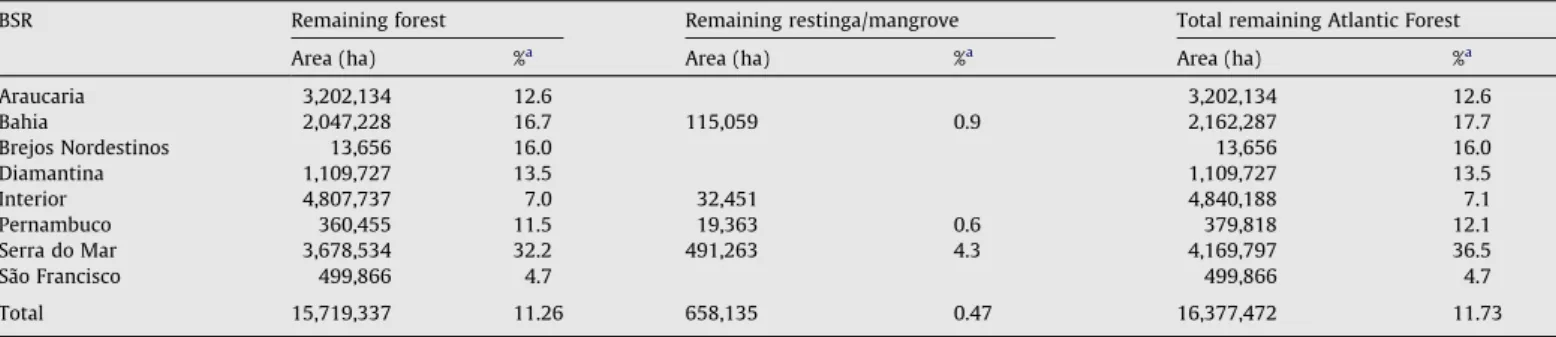
3.3. Core and edge area
Of the total forest area remaining, 73% is located less than 250 m from any non-forest area, and 46% is less than 100 m distant from edge (Fig. 4). Only 7.7% is located farther than 1000 m from any edge, and 12 km is the maximum distance from any non-for-ested area in the Atlantic Forest region.
A similar pattern was observed for the BSRs, where most of the forest area is less than 250 m from non-forest areas (Fig. 3S). In the Interior and Pernambuco regions, approximately 60% of the forest is less than 100 m from any edge, while São Francisco, Araucaria, Bahia and Diamantina have between 40% and 50% of their forests within 100 m from any edge. Only the Serra do Mar region showed a different pattern, where only 25% of the remaining forest is lo-cated less than 100 m from any edge. This is reflected in the high-est percentage of core-area forhigh-est in this BSR, with 256,040 ha at least 2.5 km from the edges, and 56,993 ha at least 5 km from the edges. In addition to the large fragments of the Serra do Mar
region, the Iguaçu National Park is the only one that also has areas of forest that are 12 km distant from any edge.
3.4. Connectivity
For species that are not able to cross open areas, the average functionally connected area is 64 ha (Fig. 5), while for those that are able to cross 300 m it is 131 ha. The largest functionally con-nected cluster of fragments for species that are able to cross 100 m, is comprised of the Serra do Mar and the nearby functionally connected fragments, which encompass more than 2,803,000 ha (18% of the remaining forest,Fig. 6) and stretches from the state of Rio de Janeiro all the way south to the state of Rio Grande do Sul. In the Bahia region, species that are able to make short cross-ings between fragments, such as 100 m, can reach a forest area of more than 50,000 ha (17% of the remaining forest in the region); whereas in Diamantina the gap that needs to be crossed to reach a functionally connected area of this size is 200 m (Fig. 4S-c). Longer distances separate fragments in the other regions, such as 400 m to reach 50,000 ha in the São Francisco (Fig. 4S-g) BSR, and more than 500 m in the Pernambuco to reach the same area (Fig. 4S-e).
3.5. Mean isolation
The mean isolation for the entire Atlantic Forest region was 1441 m, with values ranging from a few meters to dozens of kilome-ters. The small fragments were particularly important in reducing isolation (Fig. 7). When we exclude the fragments <50 ha, the mean isolation increases to 3532 m. If fragments smaller than 200 ha were lost, the mean isolation would reach more than 8000 m.
Fig. 3.Distribution of remaining forest fragment sizes in the full extent of the Atlantic Forest region. %A: percentage of total area; %NP: percentage of number of fragments.
0 5 10 15 20 25 30
250- 500 1000
1000-2500
2500-5000
5000-12000
Edge Distance (m)
%
Edge Distance (m)
Cumulative area (%)
25
50
75
100
50 100 250 500 1000 2500 5000 12000
0-50 50-100 100- 250
500-A
B
Small fragments were important in reducing isolation in all re-gions. However, a gradient of importance could be seen, with the Interior and São Francisco BSRs being particularly affected by the exclusion of these small fragments, whereas in the Serra do Mar a relatively low isolation is maintained, since the remaining forest exists as larger pieces (Fig. 7). The isolation in the São Francisco BSR is the most-affected by the exclusion of small fragments, since isolation increases from 3.6 to 14.5 km when excluding fragments smaller than 200 ha. The second most-affected BSR is the Interior, where the mean isolation increases from 1344 m (without frag-ment removal) to 9112 m if we remove fragfrag-ments <200 ha. For other regions, exclusion of fragments of this size results in an iso-lation that ranges from 4182 m (in the Serra do Mar) to 7048 m (in the Araucaria BSR).
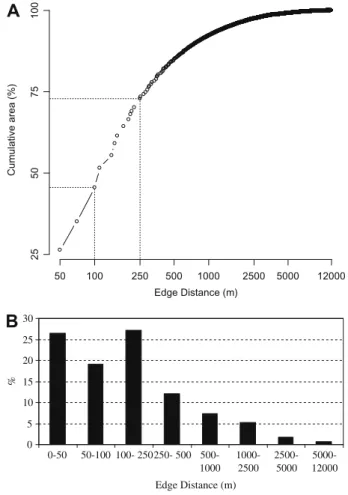
3.6. Nature reserve cover and proximity
The total protected area within the Atlantic Forest region is approximately 2.26 million ha, or 1.62% of the region (Table 4,
Fig. 8). Nature reserves represent 14.4% of the remaining forest
cover, but they protect only 9.3% (Table 4) of this remaining forest, since other types of vegetation or land cover also occur within these reserves. All regions have a small percentage (Fig. 5S[a-g]) of their areas covered by nature reserves. However, the Serra do Mar has 25.2% of its remaining forest under protection, followed by the Interior (6.8%) and the Bahia (4.2%). All other regions have less than 4% of their small amount of remaining forest under pro-tection (Table 4;Fig. 5S[a-g]). Given these facts, the Serra do Mar accounts for 63% of the total remaining forest under protection, fol-lowed by the Interior BSR (22%). Moreover, only 1.05% of the origi-nal forest cover is protected, and in most regions (except Serra do Mar and Bahia) this percentage is <0.5%.
Some reserves are contiguous, and thus we could identify seven large protected regions with areas of about 100,000 ha. Five are in the Serra do Mar region: (1) Serra do Mar State Park and Bocaina National Park; (2) Jacupiranga State Park and Superagui National Park; (3) Paranapiacaba [Petar State Park, Intervales State Park, Xituê Ecological Station and Carlos Botelho State Park]; (4) Serra do Tabuleiro State Park and (5) Jureia [Banhados de Iguape Ecolog-ical Station, Jureia-Itatins EcologEcolog-ical Station, Itinguçu State Park and Prelado State Park]. The other two regions are in the Interior (Iguaçú National Park) and the Diamantina (Chapada da Diamanti-na State Park) regions. Together they have a total area of 1,212,800 ha, which encompasses 53.6% of the protected areas. Seventeen reserves range in size from 20,000 ha to 60,000 ha (in total 585,120 ha; 26% of the protected areas); six of them are in the Interior, five in the Serra do Mar, three in the Bahia, two in the Araucaria, and one in the São Francisco BSRs.
Only 22.6% of the remaining forest is located within 10 km of nature reserves, whereas 61% is farther than 25 km (Fig. 9). Most BSRs have a small amount of forests close (<10 km) to nature re-serves, whereas a large amount is more distant (>50 km,Table 4;
Fig. 5S[a–g]). A different pattern is encountered in the Serra do Mar, where 59% (2,163,163 ha) of the remaining forest is less than 10 km, and 41% (1,515,371 ha) is farther away.
4. Discussion
Our results showed that: (i) there is more forest left than previously estimated; (ii) most fragments are very small, less
Fig. 5.Expected cluster size (mean functional size; ha) for functionally connected forest fragments estimated across varying functional linkage distances (m), for the Brazilian Atlantic Forest region.
Fig. 6.Highest functionally connected forest cluster (% of total remaining forest) estimated across varying functional distances (m), for the Brazilian Atlantic Forest region.
than 50 ha (ca. 83% of the total number of fragments); (iii) much of the remaining forest is close to forest edges (ca. 45% <100 m of the edges), indicating that matrix influences may have strong effects on many forest ecological processes (Umetsu and Pardini, 2007; Umetsu et al., 2008; Uezu et al., 2008; Fonseca et al., 2009; Pardini et al., 2009; Vieira et al., 2009); (iv) short gap-crossings (<100 m) through the matrix can be highly effective to increase the functionally connected area for forest species (Boscolo et al., 2008; Martensen et al., 2008); (v) small fragments (<200 ha) play a crucial role in reducing fragment isolation among larger fragments, suggesting that they are highly important as stepping stones; and (vi) nature re-serves protect a small amount of the remaining forest in all the BSRs (except in the Serra do Mar), and most of the remain-ing forest is distant (>25 km) from the existremain-ing nature reserves (61%; 9,564,900 ha).
Table 4
Protected area and forest under protection for the Atlantic Forest domain, and within seven biogeographical sub-regions (all BSRs except ‘‘Brejos Nordestinos”) adapted fromSilva and Casteleti (2003).
BSR Area of sub-region (a) (ha)
Protected area Remaining forest (c) ha
Protected remaining forest (d) ha
Protected forest in relation to remaining forest within sub-regions (d)/(c) %
Protected forest between sub-regions
(di)/S(d) %
Protected forest in relation to original forest within sub-regions (d)/(a) %
(b) (ha)
(b)/(a) %
Araucaria 25,379,316 164,651 0.65 3,202,134 98,121 3.1 6.7 0.39 Bahia 12,241,168 113,447 0.93 2,047,228 86,053 4.2 5.9 0.70 Diamantina 8,200,259 151,412 1.85 1,109,727 12,451 1.1 0.9 0.15 Interior 68,417,731 561,381 0.82 4,807,737 325,261 6.8 22.2 0.48 Pernambuco 3,132,167 4314 0.14 360,455 3731 1.0 0.3 0.12 Serra do Mar 11,413,471 1,201,848 10.53 3,678,534 926,184 25.2 63.3 8.11 São Francisco 10,715,533 63,297 0.59 499,866 11,823 2.4 0.8 0.11 Total 139,499,644 2,260,350 1.62 15,705,681 1,463,622 9.3 100.0 1.05
Fig. 8.Nature reserves in the Brazilian Atlantic Forest region (source:MMA, 2007).
10000 100000 1000000 10000000
NR <200 20
0-600
600-1000
1000 -200
0
20 00-5000
5000-10000
10000 -2500
0
2500 0-5
0000 >500
00
Distance from Nature Reserves (m)
Area (ha in log scale)
9.3%
0.5% 0.8% 0.7% 1.5%
4.0% 5.9%
16.5% 19.3% 41.6%
4.1. How much forest is left?
Our study exposed the extreme degradation of the Atlantic For-est, where only 11.7% of the original vegetation remains (15,719,337 ha). This proportion might range from 11.4% to 16.0% if we consider errors of commission and omission. This estimated area is larger than the usual total given for the Atlantic Forest (7–8%; SOS Mata Atlântica/INPE, 1993, and 2000; Galindo-Leal and Câmara, 2003), but below the recent estimate of 27% byIESB et al. (2007) andCruz and Vicens (in press). Differences among these estimates could be caused by several factors, including map-ping errors. However, our field survey demonstrated that the map quality is acceptable for regional analyses. Apparently, one of the main factors causing these discrepancies in estimating the Atlantic Forest cover is related to the criteria used to include secondary for-ests and small fragments.
IESB et al. (2007), Cruz and Vicens (in press)included very early stages of succession, even without a forest structure present (veg-etation <2 m high; Cruz, personal communication). The initial eval-uations by the SOS Mata Atlântica Foundation (1986–2000) did not consider regrowth; i.e., once mapped as deforested in a recent past (50 years), an area was never again considered as forest (SOS Mata Atlântica/INPE, 2008). They also did not consider forest frag-ments smaller than 100 ha. On their new report, when considering fragments >3 ha and forests at an intermediate stage of regenera-tion, they obtained an estimation of the remaining forest cover similar to ours (10.6%;SOS Mata Atlântica/INPE, 2008). Thus, the difference between previous estimates bySOS Mata Atlântica/INPE (1993,2000) and the present estimate is basically composed of intermediate secondary forests and/or small fragments, which cor-respond to approximately 32–40% of the total mapped vegetation (considering 8% and 7% of the forest cover previously mapped by SOS Mata Atlântica, respectively). The small difference between our estimates and that reported by SOS Mata Atlântica/INPE (2008) may be related to differences on the analyzed extent (slightly larger in our case to include the delimitations of BSRs by
Silva and Casteleti, 2003) and because we did not excluded any fragment from the analyses.
The Atlantic forest presents a highly dynamic forest cover dy-namic (Teixeira et al., 2009) and an old history of disturbance, where even the mature remnants were selective logged in a distant past, sometimes in pre-European time (Dean, 1996;Câmara, 2003). This critical scenario of the Atlantic Forest with large areas of sec-ondary forests and small disturbed fragments is the usual pattern in most tropical regions, where 50% of them are secondary or dis-turbed (Wright, 2005). The implications for species conservation are huge. Even if secondary forests can sustain a significant amount of biodiversity (Viana and Tabanez, 1996; Develey and Martensen, 2006), many species need more pristine forest and large fragments to survive (Aleixo, 1999; Harris and Pimm, 2004; Develey and Mar-tensen, 2006; Laurance, 2007; Gardner et al., 2007; Barlow et al., 2007a,b), and the replacement of mature forests by secondary ones may lead to the extinction of many species (Metzger et al., 2009). In this landscape-structure scenario, several general guidelines can be suggested to improve or stimulate forest-species conserva-tion in the Atlantic Forest region, particularly: (i) large mature forest fragments should be assigned a high conservation priority; (ii) smal-ler fragments could be used to form functionally linked mosaics; (iii) the matrix surrounding the fragments should be adequately man-aged to minimize edge effects; and (iv) restoration actions should be put into practice, particularly in some key structural conditions.
4.2. Protecting large mature forest fragments
Particular attention should be paid to the protection of the lar-ger remnants, especially for their capacity to maintain larlar-ger
pop-ulations and for their better prospects of sustaining species over the long term (Brooks et al., 1999; Lindborg and Eriksson, 2004). Only large fragments with mature forests are capable of preserving sensitive species, especially those with large area requirements (Ferraz et al., 2007) or with strict habitat requirements, whose sur-vival is particularly problematic in the present fragmented state (Aleixo, 1999). Old-growth forests (Laurance, 2007; Gardner et al., 2007) are especially important because, even in excellent regeneration conditions, this process requires several decades to restore a species composition comparable to a mature stage (Dunn, 2004; Barlow et al., 2007a,b; Liebsch et al., 2008; Rodrigues et al., 2009). Moreover, the early stages of succession on abandoned lands are not protected by Brazilian environmental laws (Metzger et al., 2009), and their suppression is common and part of the rapid dynamic of the landscapes.
In the present extremely fragmented and dynamic scenario of the Atlantic Forest, the importance of the last large forest remnants increases exponentially, and their management should be cau-tiously designed and their transformation into nature reserves should be carefully considered. New conservation areas are most urgently needed in Pernambuco, Diamantina and São Francisco, where nature reserves protect less than 3% of the remaining forest, even if the largest fragments are not so large (e.g., <10,000 ha). Pro-tection of at least 10% of the original habitat is recommended as a global strategy for conservation (Secretariat of the Convention on Biological Diversity, 2002), but even the Serra do Mar region does not at present fulfill this condition (8.1% of its original cover is pro-tected in nature reserves). This kind of conservation target is sub-jective, and the degree of protection should vary according to the sensitivity of the system (which may differ among regions), but it is clear that the proportion of forest cover under legal protection is very low in all the BSRs, and must be enhanced.
Moreover, the largest fragments promote conservation of core areas, which are particularly uncommon since more than 70% of the remaining forest is located less than 250 m from open land, and is thus subject to edge effects. Furthermore, large mature for-est fragments are vital for supporting seeds and allowing recoloni-zation of the small surrounding fragments, and can act as source areas for restoration programs (Rodrigues et al., 2009). The dis-tance (>25 km) of most of the remaining Atlantic Forest fragments from the existing nature reserves reduces their influence as stable sources of individuals and species for the surrounding smaller frag-ments. Forest regeneration in areas around nature reserves should be stimulated because of their natural regrowth potential, increas-ing forest cover in these regions, and reducincreas-ing the present unbal-anced distribution of forest cover in relation to the proximity to nature reserves.
Protecting the last largest blocks of forests of all BSRs should definitely be a conservation priority. However, only in the Arau-caria, Bahia, and especially the Serra do Mar regions can large frag-ments still be found. The Interior Forest also has a few large fragments, which together with the large tracts of forests still existing in Argentina (Giraudo, 2003) and Paraguay (Cartes and Yanosky, 2003; Huang et al., 2007) constitute a better conservation prospect for this BSR. All the other BSRs lack large fragments, which may severely compromise species conservation (Silva and Casteleti, 2003). In these regions, alternative conservation prac-tices should be implemented for the existing remnants.
4.3. Creating functionally linked mosaics
This is a considerable separation for most forest species (Laurance and Gómez, 2005), which avoid edge areas (Hansbauer et al., 2008; Lopes et al., 2009) and in some cases do not even cross roads or small gaps in the canopy (Develey and Stouffer, 2001; Laurance, 2004; Laurance and Gómez, 2005). As the distances between frag-ments increase, connectivity decreases, and individual crosses be-came less frequent (Hanski, 1994; Haddad, 1999). However, clusters of neighboring fragments (<200 m) that form large tracts of forest (>50,000 ha) are common (n= 12; 4,992,700 ha; 32% of the total remaining forest), and should be considered in conserva-tion policies as important potential mosaics for conservaconserva-tion. They can play an important role in animal movement through land-scapes, either functioning as stepping stones (Castellón and Siev-ing, 2005; Sekercioglu et al., 2006; Uezu et al., 2008; Boscolo et al., 2008), or forming networks of functionally connected areas, which could allow species to persist in disturbed landscapes ( Mar-tensen et al., 2008). They can also act as stable sources of seeds and individuals for nearby, smaller fragments.
Especially in cases where no large fragment is left, one option is to consider functionally linked mosaics of smaller fragments (Uezu et al., 2005; Martensen et al., 2008). This is especially the case in the Pernambuco, Diamantina and São Francisco BSRs. These BSRs are naturally fragmented (Fig. 1), and the advanced forest destruc-tion intensified this pattern, increasing the number of small frag-ments, reducing the forest cover to <15% and thus threatening the biodiversity that depends on this forest.
Matrix permeability is a key connectivity component (Fonseca et al., 2009). Different regions of the Atlantic Forest have suffered for centuries under poor soil management and extensive destruc-tion and simplificadestruc-tion of the forests, which has intensified in re-cent decades (Fig. 6S), with agricultural mechanization and the use of pesticides and herbicides (Brannstrom, 2001; Durigan et al., 2007). Recent expansions ofEucalyptus(Bacha and Barros, 2004; Baptista and Rudel, 2006; Fig. 6S) and sugar-cane planta-tions (Rudorff and Sugawara, 2007,Nassar et al., 2008; Fig. 6S) have caused huge social, economical and environmental impacts, and their influences in reducing patch connectivity have been sug-gested and need to be better understood (Fonseca et al., 2009).
Matrix management is especially important in a scenario where short movements through the matrix can promote fragment con-nections. Increasing matrix permeability can allow species to per-sist in fragmented situations and can be an interesting option for conservation of some species (Ricketts, 2001; Baum et al., 2004; Antongiovanni and Metzger, 2005; Umetsu et al., 2008; Uezu et al., 2008; Pardini et al., 2009; Vieira et al., 2009). Matrix man-agement could be employed in the Araucaria Forest, where func-tionally connected areas increase stability through improved gap-crossing abilities; and in the Bahia region, where a large net-work of fragments are functionally linked by distances of 100 m of open areas. In all these cases, inter-forest management can im-prove connectivity. The implementation of forested pastures, where trees are scattered in different densities, or disposed in lines along fences, has been suggested as one easy option to improve connectivity in traditional pasture areas, while also promoting additional economical gains to the landowner, as well as work in wind blocking (Harvey et al., 2004). The establishment of small agroforest patches, with the presence of trees dispersed in agricul-tural fields is also suggested as important to improve landscape connectivity (Uezu et al., 2008). Moreover, sugar cane has been expanding over former pastures, where scattered trees were com-mon (Nassar et al., 2008). The suppression of these trees should be avoided, because they can have a disproportional effect in biodi-versity conservation (Harvey et al., 2004). Finally, different man-agement options in the plantations of exotic trees are also pointed out as vital to enhance connectivity, as well as in harbor-ing some extremely demandharbor-ing species, what could be severely
limited with traditional forest management practices (Fonseca et al., 2009).
4.4. Reducing edge effects
Because the remaining Atlantic Forest is severely fragmented in small patches edge effects increase in importance. Tropical species, particularly the strictly forest ones, are well known to be highly sensitive to edge alterations, especially because of their high niche specialization (Kapos, 1989; Murcia, 1995; Hansbauer et al., 2008; Lopes et al., 2009).Kapos (1989), Laurance et al. (2007), Laurance (2008)showed that some edge effects in the Amazon Forest can extend as far as 300–400 m into the forest. In the Atlantic Forest, almost half of the remaining forest is located less than 100 m from open areas, and more than 70% of the remaining forest is located less than 250 m from open land, i.e., is subject to strong edge-effect influences.
Because most of the present forest is directly influenced by nearby land use, matrix influences should also be particularly investigated and their management carefully conducted (Umetsu and Pardini, 2007; Umetsu et al., 2008; Uezu et al., 2008; Fonseca et al., 2009; Pardini et al., 2009; Vieira et al., 2009). Forested or agroforestry matrixes are suggested as efficient in reducing micro-climate changes caused by edge conditions (Didham and Lawton, 1999), and thus, to reduce edge-effect influences (Cullen Junior et al., 2004). In some cases, strip of trees are planted forming a buf-fer around the remaining patches in order to reduce edge effects (Cullen Junior and Fenimore, 2002; Cullen Junior et al., 2004).
4.5. Stimulating restoration actions in key structural conditions
The present small amount of remaining forest generates a sce-nario where rapid restoration actions should be undertaken to al-low species conservation in the near future (Rodrigues et al., 2009). In this case, careful site selection is necessary in order to maximize restoration achievements. Priority should be given to the bottlenecks of the large clusters of fragments. In the Serra do Mar region, for example, small disruptions (<100 m) break apart a potential larger fragment of more than 2.8 million ha, and resto-ration of these connections should be a conservation priority. In this region, roads are also a key element in breaking apart large fragments, and mitigation policies should be analyzed and em-ployed to restore connectivity. Complementarily, efforts should be allocated to create new reserves between the large fragments of the Serra do Mar, enhancing reserve sizes and width, especially in areas where forest areas are relatively narrow and disruption of these fragments could occur in the future.
Another key characteristic of the Serra do Mar region is the presence of large fragments that extend into the Interior and Arau-caria regions. Maintenance or linkage restoration of these inter-re-gion fragments is also vital to maintain the biological evolutionary processes, which could be particularly important in the present scenario of climate changes. These linkages may be especially important in the case of the Araucaria BSR, since these inter-region fragments are also the largest ones found in this BSR, and the re-gion has been undergoing profound impacts from the recent changes in land use, with the expansion ofEucalyptusplantations (Bacha and Barros, 2004; Baptista and Rudel, 2006).
evolutionary processes and could be particularly deleterious in a climate-change scenario.
Finally, restoration priority should also be given to link the smaller fragments surrounding larger ones, especially in the cases where these large fragments are nature reserves. Enhancing the connectivity between fragments, especially linking to a large one that can act as a source of individuals, can improve conservation possibilities in highly fragmented regions (Uezu et al., 2005; Mar-tensen et al., 2008).
5. Conclusion
This report quantifies for the first time the extremely degraded state of the Atlantic Forest distribution, showing that most frag-ments cover less than <50 ha, almost half the remaining forest is <100 m from forest edges, and the present conservation network is insufficient to support the long-term survival of this rich and endangered tropical forest. Urgent conservation and restoration actions should be implemented to mitigate this situation, based on careful planning and with clear targets.
The management of the region as a whole must begin with the transformation of the large mature forest tracts into conservation reserves and the reestablishment of key connectivity linkages, especially between the larger remnants. The matrix, mainly be-tween and surrounding these large fragments, is also important to manage, since a large fraction of the forest is influenced by the close proximity to edges. In sections where not a single large frag-ment remains, which is common in most sub-regions, manage-ment should focus on the reestablishmanage-ment of functionally connected clusters of fragments, enhancing landscape connectiv-ity. In the present critical conservation scenario of the Atlantic For-est, every remnant is important for species conservation. The clear differences in the amount of forest remaining and how they are or-ganized in each sub-region must be considered when planning bio-diversity conservation.
Acknowledgments
Our profound thanks to the SOS Mata Atlântica Foundation and the National Institute for Space Research (INPE) for allowing us to use their maps of remnants of the Atlantic Forest region. We also thank J.M.C. Silva and C.H.M. Casteleti for providing the boundaries of the BSRs analyzed in this study. Our appreciation to A. Uezu, C. Banks-Leite, C. Cornellius and two anonymous reviewers for commenting on earlier versions of this manuscript. Proof reading was done by J.W. Reid. MCR was granted a CAPES scholarship, and additional financial support was provided by the Brazilian Council for Research and Technology (CNPq) (Project ‘Biodiversity conservation in fragmented landscapes on the Atlantic Plateau of
São Paulo’, No. 590041/2006-1).
Appendix A. Supplementary material
Supplementary data associated with this article can be found, in the online version, atdoi:10.1016/j.biocon.2009.02.021.
References
Aleixo, A., 1999. Effects of a selective logging on a bird community in the Brazilian Atlantic Forest. The Condor 101, 537–548.
Antongiovanni, M., Metzger, J.P., 2005. Influence of matrix habitats on the occurrence of insectivorous bird species in Amazonian forest fragments. Biological Conservation 122, 441–451.
Awade, M., Metzger, J.P., 2008. Using gap-crossing capacity to evaluate functional connectivity of two Atlantic rainforest birds and their response to fragmentation. Austral Ecology 33, 863–871.
Bacha, C.J.C., Barros, A.L.M.B., 2004. Reflorestamento no Brasil: evolução recente e perspectivas para o futuro. Scientia Forestalis 66, 191–203.
Baddeley, A., Turner, R., 2005. SPATSTAT: an R package for analysing spatial point pattern. Journal of Statistical Software 12, 1–42.
Baptista, S.R., Rudel, T.K., 2006. A re-emerging Atlantic Forest? Urbanization, industrialization and the forest transition in Santa Catarina, southern Brazil. Environmental Conservation 33, 195–202.
Barlow, J., Gardner, T.A., Araujo, I.S., Avila-Pires, T.C., Bonaldo, A.B., Costa, J.E., Esposito, M.C., Ferreira, L.V., Hawes, J., Hernandez, M.I.M., Hoogmoed, M.S., Leite, R.N., Lo-Man-Hung, N.F., Malcolm, J.R., Martins, M.B., Mestre, L.A.M., Miranda-Santos, R., Nunes-Gutjahr, A.L., Overal, W.L., Parry, L., Peters, S.L., Ribeiro-Junior, M.A., Silva, M.N.F.da, Silva Motta, C., Peres, C.A., 2007a. Quantifying the biodiversity value of tropical primary, secondary, and plantation forests. Proceedings of the National Academy of Sciences 104, 18555–18560.
Barlow, J., Mestre, L.A.M., Gardner, T.A., Peres, C.A., 2007b. The value of primary, secondary and plantation forests for Amazonian birds. Biological Conservation 136, 212–231.
Baum, K.A., Haynes, K.J., Dillemuth, F.P., Cronin, J.T., 2004. The matrix enhances the effectiveness of corridors and stepping stones. Ecology 85, 2672–2675. Boscolo, D., Candia-Gallardo, C., Awade, M., Metzger, J.P., 2008. Importance of
inter-habitat gaps and stepping-stones for a bird species in the Atlantic Forest, Brazil. Biotropica 40, 273–276.
Brannstrom, C., 2001. Conservation-with-development models in Brazil’s agro-pastoral landscapes. World Development 29, 1345–1359.
Brooks, T., Pimm, S.L., Oyugi, J.O., 1999. Time lag between deforestation and bird extinction in tropical forest fragments. Conservation Biology 13, 1140–1150. Câmara, I.G., 2003. Brief history of conservation in the Atlantic Forest. In:
Galindo-Leal, C., Câmara, I.G. (Eds.), The Atlantic Forest of South America: Biodiversity Status, Threats, and Outlook. CABS and Island Press, Washington, pp. 31–42. Cartes, J.L., Yanosky, A., 2003. Dynamics of biodiversity loss in the Paraguayan
Atlantic Forest: an introduction. In: Galindo-Leal, C., Câmara, I.G. (Eds.), The Atlantic Forest of South America: Biodiversity Status, Threats, and Outlook. CABS and Island Press, Washington, pp. 267–268.
Castellón, T.D., Sieving, K.E., 2005. An experimental test of matrix permeability and corridor use by an endemic undestory bird. Conservation Biology 20, 135– 145.
Cruz, C.B.M., Vicens, R.S., in press. Estado atual da cobertura vegetal e uso da terra no Bioma Mata Atlântica, in: Instituto Bioatlântica (Org.), Uma Introdução ao Estudo das Florestas do Sul e Sudeste do Brasil, Rio de Janeiro.
Cullen Junior, L., Fenimore, S., 2002. Projeto abraço verde: a practice-based approach to Brazilian Atlantic Forest conservation. Endangered Species Update 10, 45–58.
Cullen Junior, L., Ferreira-Lima, J., Pavan, T., 2004. Agroforestry buffer zones and stepping stones: tools for the conservation of fragmented landscapes in the Brazilian Atlantic Forest. In: Schorth, G., Fonseca, G., Harvey, C., Claude, G., Vasconcelos, H., Izac, A.N. (Eds.), Agroforestry and Biodiversity Conservation in Tropical Landscapes. Island Press, Washington, pp. 415–430.
da Silva, J.M.C., Casteleti, C.H.M., 2003. Status of the biodiversity of the Atlantic Forest of Brazil. In: Galindo-Leal, C., Câmara, I.G. (Eds.), The Atlantic Forest of South America: Biodiversity Status, Threats, and Outlook. CABS and Island Press, Washington, pp. 43–59.
da Silva, J.M.C., de Souza, M.C., Castelletti, C.H.M., 2004. Areas of endemism for passerine birds in the Atlantic Forest, South America. Global Ecology and Biogeography 13, 85–92.
Dean, W., 1996. With Broadax and Firebrand: The Destruction of the Brazilian Atlantic Forest. University of California Press, California.
Develey, P.F., Martensen, A.C., 2006. As aves da Reserva Florestal do morro Grande (Cotia, SP). Biota Neotropica 6 (2).<http://www.biotaneotropica.org.br/v6n2/ pt/abstract?article+bn00706022006>.
Develey, P.F., Stouffer, P.C., 2001. Effects of roads on movements by understory birds in mixed-species flocks in Central Amazonian Brazil. Conservation Biology 15, 1416–1422.
Didham, R.K., Lawton, J.H., 1999. Edge structure determines the magnitude of changes in microclimate and vegetation structure in tropical forest fragments. Biotropica 31, 17–30.
Dunn, R.R., 2004. Recovery of faunal communities during tropical forest regeneration. Conservation Biology 18, 302–309.
Durigan, G., Siqueira, M.F., Franco, G.A.D.C., 2007. Threats to the Cerrado remnants of the state of São Paulo, Brazil. Scientia Agricola 64, 363–366.
ESRI, 2007. ArcGis, the Complete Geographical Information System. Redlands, California.
Fahrig, L., 2003. Effects of habitat fragmentation on biodiversity. Annual Review of Ecology, Evolution and Systematics 34, 487–515.
Fairbanks, D.H.K., Reyers, B., Van Jaarsveld, A.S., 2001. Species and environment representation: selecting reserves for the retention of avian diversity in KwaZulu-Natal, South Africa. Biological Conservation 98, 365–379.
Fall, A., Fortin, M.J., Manseau, M., O´Brien, D., 2007. Spatial graphs: principles and applications for habitat connectivity. Ecosystems 10, 448–461.
Ferraz, G., Nichols, J.D., Hines, J.E., Stouffer, P.C., Bierregaard Jr., R.O., Lovejoy, T.E., 2007. A large-scale deforestation experiment: effects of patch area and isolation on Amazon birds. Science 315, 238–241.
Fischer, J., Lindenmayer, D.B., Manning, A.D., 2006. Biodiversity, ecosystem function, and resilience: ten guiding principles for commodity production landscapes. Frontiers in Ecology and the Environment 4, 80–86.
Piovezan, F.N., Putzke, J., Stranz, A., Vergara, M., Vieira, E.M., 2009. Towards an ecologically sustainable forestry in the Atlantic Forest. Biological Conservation 142, 1144–1154.
Forman, R.T.T., Collinge, S., 1997. Nature conserved in changing landscapes with and without spatial planning. Landscape and Urban Planning 37, 129–135. Fortin, M.J., Dale, M.R.T., 2005. Spatial Analysis: A Guide for Ecologists. Cambridge
University Press, Cambridge.
Galindo-Leal, C., Câmara, I.G., 2003. Atlantic Forest hotspot status: an overview. In: Galindo-Leal, C., Câmara, I.G. (Eds.), The Atlantic Forest of South America: Biodiversity Status, Threats and Outlook. CABS and Island Press, Washington, pp. 3–11.
Gardner, T.A., Barlow, J., Parry, L.W., Peres, C.A., 2007. Predicting the uncertain future of tropical forest species in a data vacuum. Biotropica 39, 25– 30.
Gardner, T.A., Barlow, J., Araújo, I.S., Ávila-Pires, T.C., Bonaldo, A.B., Costa, J.E., Esposito, M.C., Ferreira, L.V., Hawes, J., Hernandez, M.I.M., Hoogmoed, M.S., Leite, R.N., Lo-Man-Hung, N.F., Malcolm, J.R., Martins, M.B., Mestre, L.A.M., Miranda-Santos, R., Overal, W.L., Parry, L., Peters, S.L., Ribeiro-Junior, M.A., da Silva, M.N.F., Motta, C.S., Peres, C.A., 2008. The cost-effectiveness of biodiversity surveys in tropical forests. Ecology Letters 11, 139–150.
Giraudo, A.R., 2003. Dynamics of biodiversity loss in the Argentinean Atlantic Forest: an introduction. In: Galindo-Leal, C., Câmara, I.G. (Eds.), The Atlantic Forest of South America: Biodiversity Status, Threats, and Outlook. CABS and Island Press, Washington, pp. 139–140.
Goerck, J.M., 1997. Patterns of rarity in the birds of the Atlantic Forest of Brazil. Conservation Biology 11, 112–118.
Groves, C.R., Jensen, D.B., Valutis, L.L., Redford, K.H., Shaffer, M.L., Scott, J.M., Baumgartner, J.V., Higgins, J.V., Beck, M.W., Anderson, M.G., 2002. Planning for biodiversity conservation: putting conservation science into practice. Bioscience 52, 499–512.
Haddad, N.M., 1999. Corridor and distance effects on interpatch movements: a landscape experiment with butterflies. Ecological Applications 9, 612– 622.
Haila, Y., 2002. A conceptual genealogy of fragmentation research: from island biogeography to landscape ecology. Ecological Applications 12, 321–334. Hansbauer, M.M., Storch, I., Leu, S., Nieto-Holguin, J.P., Pimentel, R.G., Knauer, F.,
Metzger, J.P., 2008. Movements of neotropical understory passerines affected by anthropogenic forest edges in the Brazilian Atlantic Rainforest. Biological Conservation 141, 782–791.
Hanski, I., 1994. A pratical model of metapopulation dynamics. Journal of Animal Ecology 63, 151–162.
Harris, G.M., Pimm, S.L., 2004. Bird species’ tolerance of secondary forest habitats and its effects on extinction. Conservation Biology 18, 1607–1616.
Harvey, C.A., Tucker, N.I.J., Estrada, A., 2004. Live fences, isolated trees, and windbreaks: tools for conserving biodiversity in fragmented tropical landscapes. In: Schorth, G., Fonseca, G., Harvey, C., Claude, G., Vasconcelos, H., Izac, A.N. (Eds.), Agroforestry and Biodiversity Conservation in Tropical Landscapes. Island Press, Washington, pp. 261–289.
Huang, C., Kim, S., Altstatt, A., Townshend, J.R.G., Davis, P., Song, K., Tucker, C.J., Rodas, O., Yanosky, A., Clay, R., Musinsky, J., 2007. Rapid loss of Paraguay´s Atlantic forest and the status of protected areas – a landsat assessment. Remote Sensing of Environment 106, 460–466.
Instituto de Estudos Sócioambientais do Sul da Bahia (IESB), Instituto de Geociências da Universidade Federal do Rio de Janeiro (IGEO/UFRJ), Departamento de Geografia da Universidade Federal Fluminence (UFF), 2007. Levantamento da Cobertura Vegetal Nativa do Bioma Mata Atlântica. Relatório final. PROBIO 03/2004, Brasília, 84p.
Jorge, L.A.B., Garcia, G.J., 1997. A study of habitat fragmentation in Southeastern Brazil using remote sensing and geographic information systems (GIS). Forest Ecology and Management 98, 35–47.
Kapos, V., 1989. Effects of isolation on the water status of forest patches in the Brasilian Amazon. Journal of Tropical Ecology 2, 173–185.
Landis, J.R., Kock, G.G., 1977. The measurement of observer agreement for categorical data. Biometrics 33, 159–174.
Laurance, S.G.W., 2004. Responses of understory rain forest birds to road edges in Central Amazonia. Ecological Applications 14, 1344–1357.
Laurance, W.F., 2007. Have we overstated the tropical biodiversity crisis? Trends in Ecology and Evolution 22, 65–70.
Laurance, W.F., 2008. Theory meets reality: how habitat fragmentation research has transcended island biogeographic theory. Biological Conservation 141, 1731– 1744.
Laurance, S.G.W., Gómez, M.S., 2005. Clearing width and movements of understory rainforest birds. Biotropica 37, 149–152.
Laurance, W.F., Nascimento, H.E.A.M., Laurance, S.G.W., Andrade, A., Ewers, R.M., Harms, K.E., Luizão, R.C., Ribeiro, J.E.L.S., 2007. Habitat fragmentation, variable edge effects, and the landscape-divergence hypothesis. PLoS ONE 2, e1017.
Leica, 2006. Erdas Imagine 9.1, Leica Geosystems Geospatial Imaging, LLC. Lewinsohn, T.M., Prado, P.I., 2005. How many species are there in Brazil?
Conservation Biology 19, 619–624.
Liebsch, D., Marques, M.C.M., Goldenberg, R., 2008. How long does the Atlantic Rain Forest take to recover after a disturbance? Changes in species composition and ecological features during secondary succession. Biological Conservation 141, 1717–1725.
Lindborg, R., Eriksson, O., 2004. Historical landscape connectivity affects present plant species diversity. Ecology 85, 1840–1845.
Lindenmayer, D.B., Franklin, J.F., Fischer, J., 2006. General management principles and a checklist of strategies to guide forest biodiversity conservation. Biological Conservation 131, 433–445.
Lindenmayer, D., Hobbs, R.J., Montague-Drake, R., Alexandra, J., Bennett, A., Burgman, M., Cale, P., Calhoun, A., Cramer, V., Cullen, P., Driscoll, D., Fahrig, L., Fischer, J., Franklin, J., Haila, Y., Hunter, M., Gibbons, P., Lake, S., Luck, G., MacGregor, C., McIntyre, S., Mac Nally, R., Manning, A., Miller, J., Mooney, H., Noss, R., Possingham, H., Saunders, D., Schmiegelow, F., Scott, M., Simberloff, D., Sisk, T., Tabor, G., Walker, B., Wiens, J., Woinarski, J., Zavaleta, E., 2008. A checklist for ecological management of landscape for conservation. Ecology Letters 11, 78–91.
Lopes, A.V., Girão, L.C., Santos, B.A., Peres, C.A., Tabarelli, M., 2009. Long-term erosion of tree reproductive trait diversity in edge-dominated Atlantic forest fragments. Biological Conservation 142, 1154–1165.
Margules, C.R., Pressey, R.L., 2000. Systematic conservation planning. Nature 405, 243–253.
Martensen, A.C., Pimentel, R.G., Metzger, J.P., 2008. Relative effects of fragment size and connectivity on bird community in the Atlantic Rain Forest: implications for conservation. Biological Conservation 141, 2184–2192.
Metzger, J.P., 2000. Tree functional group richness and landscape structure in a Brazilian tropical fragmented landscape. Ecological Applications 10, 1147– 1161.
Metzger, J.P., 2006. How to deal with non-obvious rules for biodiversity conservation in fragmented areas. The Brazilian Journal of Nature Conservation 4, 125–137.
Metzger, J.P., Ribeiro, M.C., Ciocheti, G., Tambosi, L.R., 2008. Uso de índices de paisagem para a definição de ações de conservação e restauração da biodiversidade do Estado de São Paulo. In: Rodrigues, R.R., Joly, C.A., Brito, M.C.W., Paese, A., Metzger, J.P., Casatti, L., Nalon, M.A., Menezes, N., Ivanauskas, N.M., Bolzani, V., Bononi, V.L.R. (Eds.), Diretrizes para Conservação e Restauração da Biodiversidade no Estado de São Paulo. Secretaria do Meio Ambiente and Fapesp, São Paulo, pp. 120–127.
Metzger, J.P., Martensen, A.C., Dixo, M., Bernacci, L.C., Ribeiro, M.C., Teixeira, A.M.G, Pardini, R., 2009. Time-lag in biological responses to landscape changes in a highly dynamic Atlantic forest region. Biological Conservation 142, 1166– 1177.
Minor, E.S., Urban, D., 2007. A graph-theory framework for evaluating landscape connectivity and conservation planning. Conservation Biology 17, 1771– 1782.
Mittermeier, R.A., Myers, N., Robles Gil, P., Mittermeier, C.C., 1999. Hotspots. Agrupación Sierra Madre, CEMEX, Mexico City.
MMA (Ministério do Meio Ambiente), 2007.<www.mma.gov.br>.
Murcia, C., 1995. Edge effects in fragmented forests: implications for conservation. Tree Review 10, 58–62.
Nassar, A.M., Rudorff, B.F.T., Antoniazzi, L.B., Aguiar, D.A., Bacchi, M.R.P., Adami, M., 2008. Prospects of the sugarcane expansion in Brazil: impacts on direct and indirect land use changes. In: Zuurbier, P., Van de Vooren, J. (Eds.), Sugarcane Ethanol: Contribution to Climate Change Mitigation and the Environment. Wageningen Academic Publishers, The Netherlands, 2008, cap. 3, pp. 63-93.
Neteler, M., Mitasova, H., 2008. Open source GIS: a GRASS GIS approach, third ed.. The International Series in Engineering and Computer Science, vol. 773 Springer, New York. 406p.
O’Brien, D., Manseau, M., Fall, A., Fortin, M.J., 2006. Testing the importance of spatial configuration of winter habitat for woodland caribou: an application of graph theory. Biological Conservation 130, 70–83.
Oliveira-Filho, A.T., Fontes, M.A.L., 2000. Patterns of floristic differentiation among Atlantic Forests in Southeastern Brazil and the influence of climate. Biotropica 34, 793–810.
Pardini, R., Faria, D., Accacio, G.M., Laps, R.R., Mariano, E., Paciencia, M.L.B., Dixo, M., Baumgarten, J., 2009. The challenge of maintaining Atlantic forest biodiversity: a multi-taxa conservation assessment of an agro-forestry mosaic in southern Bahia. Biological Conservation 142, 1178–1190.
Parker III, T.A., Stotz, D.F., Fitzpatrick, J.W., 1996. Ecological and distributional databases. In: Stotz, D.F., Fitzpatrick, J.W., Parker, T.A., III, Moskovits, D.K. (Eds.), Neotropical Birds: Ecology and Conservation. University of Chicago Press, Illinois, pp. 131–146.
R Development Core Team, 2008. R: a Language and Environment for Statistical Computing. R Foundation for Statistical Computing, Vienna, Austria (<http:// www.R-project.org>).
Ranta, P., Blom, T., Niemelä, J., Joensuu, E., Siitonen, M., 1998. The fragmented Atlantic rain forest of Brazil: size, shape and distribution of forest fragments. Biodiversity and Conservation 7, 385–403.
Ricketts, T.H., 2001. The matrix matters: effective isolation in fragmented landscapes. American Naturalist 158, 87–99.
Rodrigues, R.R., Lima, R.A.F., Gandolfi, S., Nave, A.G., 2009. On the restoration of high diversity forests: 30 years of experience in the Brazilian Atlantic Forest. Biological Conservation 142, 1242–1251.
Rudorff, B.F.T., Sugawara, L.M., 2007. Mapeamento da cana-de-açúcar na Região Centro-Sul via imagens de satélites. Informe Agropecuário 28, 79–86. Secretariat of the Convention on Biological Diversity, 2002. Global Strategy for Plant
Conservation. Secretariat of the Convention on Biological Diversity. CBD, UMEP, Botanical Gardens Comservation International, Montreal.
Silva, W.G.S., Metzger, J.P., Simões, S., Simonetti, C., 2007. Relief influence on the spatial distribution of the Atlantic Forest cover at the Ibiúna Plateau, SP. Brazilian Journal of Biology 67, 403–411.
SOS Mata Atlântica, Instituto Nacional de Pesquisas Espaciais, 2000. Atlas dos Remanescentes Florestais e Ecossistemas Associados no Domínio da Mata Atlântica. São Paulo.
SOS Mata Atlântica, Instituto Nacional de Pesquisas Espaciais, 1993. Atlas da evolução dos remanescentes florestais da Mata Atlântica e ecossistemas associados no período de 1985–1990. São Paulo.
SOS Mata Atlântica, Instituto Nacional de Pesquisas Espaciais, 2008. Atlas dos remanescentes florestais da Mata Atlântica, período de 2000 a 2005.<http:// www.sosmatatlantica.org.br>.
Stotz, D.F., Fitzpatrick, J.W., Parker, T.A., Moskovitz, D.K., 1996. Neotropical Birds: Ecology and Conservation. Univ. Chicago Press, Chicago.
Teixeira, A.M.G., Soares-Filho, B.S., Freitas, S.R., Metzger, J.P., 2009. Modeling landscape dynamics in an Atlantic Rainforest region: implications for conservation. Forest Ecology and Management 257, 1219–1230.
Uehara-Prado, M., Fernandes, J.O., Bello, A.M., Machado, G., Santos, A.J., Vaz-de-Mello, F.Z., Freitas, A.V.L., 2009. Selecting terrestrial arthropods as indicators of small-scale disturbance: a first approach in the Brazilian Atlantic forest. Biological Conservation 142, 1220–1228.
Uezu, A., Metzger, J.P., Vielliard, J.M.E., 2005. Effects of structural and functional connectivity and patch size on the abundance of seven Atlantic Forest bird species. Biological Conservation 123, 507–519.
Uezu, A., Beyer, D.D., Metzger, J.P., 2008. Can agroforest woodlots work as stepping stones for birds in the Atlantic Forest region? Biodiversity and Conservation 17, 1907–1922.
Umetsu, F., Pardini, R., 2007. Small mammals in a mosaic of forest remnants and anthropogenic habitats: evaluating matrix quality in an Atlantic forest landscape. Landscape Ecology 22, 517–530.
Umetsu, F., Metzger, J.P., Pardini, R., 2008. The importance of estimating matrix quality for modeling species distribution in complex tropical landscape: a test with Atlantic forest small mammals. Ecography 31, 359–370.
Urban, D.L., 2005. Modeling ecological processes across scales. Ecology 86, 1996– 2006.
Urban, D., Keitt, T., 2001. Landscape connectivity: a graph-theoretic perspective. Ecology 82, 1205–1218.
Viana, V.M., Tabanez, A.A., 1996. Biology and conservation of forest fragments in the Brazilian Atlantic moist forest. In: Schelhas, J., Greenberg, R. (Eds.), Forest Patches in Tropical Landscapes. Island press, Washington, pp. 151– 167.
Viana, V.M., Tabanez, A.A.J., Batista, J.L., 1997. Dynamic and restoration of forest fragments in the Brazilian Atlantic moist forest. In: Laurance, W., Bierregaard, R., Jr. (Eds.), Tropical Forest Remnants: Ecology, Management, and Conservation of Fragmented Communities. The University of Chicago Press, Chicago and London, pp. 351–365.
Vieira, M.V., Olifiers, N., Delciellos, A.C., Antunes, V.Z., Bernardo, L.R., Grelle, C.E.V., Cerqueira, R., 2009. Land use vs. fragment size and isolation as determinants of small mammal composition and richness in Atlantic Forest remnants. Biological Conservation 142, 1191–1200.
Vos, C.C., Verboom, J., Opdam, P.F.M., Ter Braak, C.J.F., 2001. Toward ecologically scaled landscape indices. American Naturalist 183, 24–41.
Wilcox, B.A., Murphy, D.D., 1985. Conservation strategy: effects of fragmentation on extinction. The American Naturalist 125, 879–887.
Williams, P.H., Margules, C.R., Wilbert, D.W., 2002. Data requirements and data sources for biodiversity priority area selection. Journal of Bioscience 27, 327– 338.