Carlos Pestana Barros & Nicolas Peypoch
A Comparative Analysis of Productivity Change in Italian and Portuguese Airports
WP 006/2007/DE _________________________________________________________
Carlos Farinha Rodrigues
Efficacy of Anti-poverty and Welfare Programs in
Portugal: the Joint Impact of the CSI and RSI
WP 42/2009/DE _________________________________________________________
Department of Economics
WORKING PAPERS
ISSN Nº0874-4548
School of Economics and Management
E
FFICACY
OF
ANTI
‐
POVERTY
AND
WELFARE
PROGRAMS
IN
P
ORTUGAL
:
THE
JOINT
IMPACT
OF
THE
CSI
AND
RSI
Carlos
Farinha
Rodrigues
*
September
2009
*
ISEG
(School
of
Economics
and
Management
)
/
Technical
University
of
Lisbon
and
CEMAPRE
(the
Centre
for
Applied
Mathematics
and
Economics)
Rua
do
Quelhas
6,
1200
‐
781
Lisbon,
Portugal
Correspondence
to:
[email protected]
Abstract
The aim of this paper is to estimate the joint impact on the distribution of household income and poverty of the implementation of two major anti‐poverty measures in Portugal: the “Solidarity Supplement for the Elderly” (CSI) and the “Social Integration Income” (RSI).
These two means‐tested measures were designed as the main components of the anti‐poverty social policy in Portugal, but they are directed at different groups of the population and have different objectives in terms of poverty reduction. Implemented since 1997, the aim of the RSI is to reduce extreme poverty through the reduction of poverty intensity of the most vulnerable sectors of the population. The CSI, gradually introduced since 2006, has the explicit objective of reducing the incidence of poverty on older people, its threshold defined at the level of the poverty line.
Using a prototype of the Portuguese microsimulation model
MicroSim
PT , based onhousehold micro‐data from the European Union Statistics on Income and Living Conditions (EU‐SILC), we simulate the impact of each measure and their joint effect on the income distribution and on different dimensions of monetary poverty. The size of government expenditure required to finance these programs will also be estimated.
E
FFICACY OF ANTI‐
POVERTY AND WELFARE PROGRAMS INP
ORTUGAL:
THE JOINT IMPACT OF THECSI
ANDRSI
1. Introduction.
In the first half of the present decade the Portuguese economy recorded a clear deceleration in economic growth with Gross Domestic Product (GDP) rate of growth falling from 3.9% in 2000 to 0.4% in 2005.
High levels of poverty and inequality continue to be one of the greatest weaknesses of the social situation in Portugal and one of the main obstacles to ensuring that all the members of society have access to fundamental rights. In 2006, 18% of the Portuguese population lived below the poverty line. The level of inequality in the income distribution reveals Portugal as one of the more unequal countries in Europe. The Portuguese population earning higher income has an income level 6.5 times higher than the population with lower income and the Gini index has a value of 37%1.
Poverty affects some subgroups of the population more sharply. Children and the elderly are the most vulnerable groups. In 2006, poverty affected 25% of the Portuguese children and 26% of the elderly population.
However, the efforts to reinforce a public and universal system of social protection have had a significant impact in the reduction of poverty in recent years. The poverty rate of the whole population decrease from 21% in 2000 to 18% in 2006 and the poverty rate of the elderly fell from 30% to 26% over the same period2 .
The “National Strategy for Social Protection and Social Inclusion – 2006/2008” defined as its first priority to “combat the persistence and severity of the problem of poverty and social exclusion among children and the elderly, who have been identified as priority groups”3. Two of the most important measures designed to achieve that objective are the “Social Integration Income” (RSI) and the “Solidarity Supplement for the Elderly” (CSI).
Implemented since 1997, the aim of the RSI is to reduce extreme poverty through the reduction of poverty intensity of the most vulnerable sectors of the population. It consists of a special allowance provided by the solidarity subsystem and of a social integration programme.
1
EUROSTAT, SILC 2007 ‐ Income reference year 2006. 2
EUROSTAT, ECHP 2001 and SILC 2007. 3
The CSI, gradually introduced since 2006, has the explicit objective of reducing the incidence of poverty on older people. It consists of a special allowance for pensioners over 65 years old that guaranties an annual minimum income. Its threshold is defined at the poverty line level and was equal to 4200 Euros in 2006.
Although targeting different groups, the two measures are complementary. The existing legal framework implies a hierarchic sequence to the access to the two measures. If a person in a household is eligible to apply for the CSI he or she should apply for it before applying for the RSI. It seems reasonable to expect that the full implementation of the CSI will reduce the number of beneficiaries of the RSI.
The main objective of this paper is to estimate the joint impact on the distribution of household income and on poverty of the implementation of those two measures.
Using a prototype of the Portuguese microsimulation model
MicroSim
PT,
we simulate theimpact of each Program and their joint effects on income distribution and on the different dimensions of monetary poverty. The size of government expenditure, necessary to finance the programs will also be estimated.
PT
MicroSim
is a static model of microsimulation based on household micro‐data from theEuropean Union Statistics on Income and Living Conditions (EU‐SILC) User Data Base made available by INE‐Statistical Portugal4. The model uses the data from the 2007 wave of EU‐SILC and the income reference period is the previous calendar year (i.e. 2006). The 2007 Portuguese EU‐SILC sample consists of 11,691 individuals in 4,310 households. The model allows for the simulation of taxes and benefits and its main output is the micro‐level changes in household income resulting from those policy changes. This provides a basis for the calculation of the impact of social or fiscal policies on aggregate poverty and on different groups of the population. The
MicroSim
PT model is clearly inspired in the EUROMOD, andby 2010 it will be replaced by a new version of the Portuguese model in the EUROMOD 5.
The transformation of the 2007 Portuguese EU‐SILC into a usable database requires a significant amount of effort, namely the splitting of some benefits, the imputation of missing
4
INE‐ Statistics Portugal, Protocol INE/MCES, process 237. 5
values, the assignment of minimum values to some benefits, etc6. The final database differs from the original one by less than 1% in terms of equivalent income. These differences are, however, fundamental to allow us to simulate those two policies.
The 2007 Portuguese EU‐SILC is the first published household survey in Portugal to include the RSI and CSI benefits. Nevertheless, the survey clearly underestimates the importance of the programmes. The number of people on RSI benefits recorded in the 2007 Portuguese EU‐SILC is clearly below the number of beneficiaries recorded by the programme itself. The number of beneficiaries of the CSI is not significant because it was the first year of its implementation and its target population was, in 2006, only the pensioners over 80 years old. The large under‐ recording of minimum income benefits and the incomplete coverage of the Solidarity Supplement for the Elderly means that we cannot use the declared values as a basis for a comprehensive evaluation of the impact of these programmes. We therefore simulate the application of both programmes at the micro level.7
The comparison of the income distribution before and after the implementation of the CSI and RSI will allow us to produce the first set of indicators of their effectiveness in reducing inequality and alleviating poverty in its different forms. We measure the impact of these policies at different levels using both inequality measures (Gini, Atkinson, etc) and poverty measures (poverty rate and gap, and other Foster’s measures (F)) 8.
The distinction between effectiveness and efficiency of government programmes aiming at poverty reduction has long been established in the economic literature. Measurements of the effectiveness of the benefits paid are designed to evaluate their impact in alleviating the various dimensions of poverty. The study of efficiency is designed to measure what proportion of the total amount of benefits awarded effectively contributed to reduce poverty.
2. Main characteristics of the RSI/CSI
The Portuguese minimum income programme was introduced in 1996 as an active social policy measure designed to guarantee social cohesion. Its implementation was clearly in keeping with
6
For a detailed description of using EU‐SILC for policy simulation in the EUROMOD context see Fifari, Levy and Sutherland (2007).
7
A similar approach to the simulation of the RSI was used by Rodrigues (2004) and by Gouveia and Rodrigues (2002).
8
the “model” of European social policy, in which most countries recognise that all individuals are entitled to a minimum level of income. It also corresponds to the application of the Recommendation of the Council of the European Communities about the common criteria concerning sufficient resources and social assistance in social protection systems, which was approved during the Portuguese Presidency in 1992 9.
The aim of the RSI Programme is to guarantee to all individuals the necessary resources for satisfying their minimum needs, whilst at the same time providing support for their progressive social and professional integration. It is therefore an initiative with national scope, providing an organised response to situations of major vulnerability, and is an entitlement to families living in conditions of extreme poverty.
The RSI consists of a non‐contributory benefit paid by the Social Security system which fills the gap between the actual income of the individual and a minimum income threshold taken as the baseline. Nevertheless, the individual’s level of resources alone does not represent a sufficient condition for access to the programme. Participants must also follow a programme of social integration, designed to provide access to vocational training and the labour market or any other form of community work. As stressed in Pedroso (1997), the RSI Programme is based on a combination of the right to receive the benefit and the system of obligation‐ entitlement to social integration.
The intended beneficiaries of the RSI Programme are individuals and their families who are legally resident in Portugal, aged 18 or over, and who satisfy the following conditions in relation to their level of resources:
i. Individuals whose income is lower than the value of the Social Pension (the reference value of the social pension was 171.70 Euros per month in 2006);
ii. Households whose income is lower than the total sum of the following : a) the value of the Social Pension for each adult, for up to two adults; b) 70% of the Social Pension for each adult, from the third adult onwards; c) 50% of the value of the Social Pension for each of the first two children and 60% for the third or more children.
These conditions immediately raise two comments. First, the minimum value of resources per equivalent adult used as benchmark (the value of the guaranteed minimum income) is indexed to the amount of the Social Pension which itself is calculated and fixed on an annual base.
9
Second, the equivalence scale implicit in the RSI is significantly different from the (modified) equivalence scale adopted by the OECD, which will be used in this paper: the weight given to adults other than the reference individual (in particular to the second adult in the household) and to young persons is higher than that of the (modified) OECD’s.
The RSI benefit received by the poorest individuals is paid in cash, its amount is variable, and it is temporary (awarded for 12 months, with the possibility of renewal). Its amount is calculated as the difference between the fixed value of the minimum income per equivalent adult in the household and the actual value of the income received per equivalent adult in the household. The legal RSI equivalence scale described above is used in all calculations.
The social integration programme, designed to guarantee progressive social integration to the RSI beneficiaries, is aimed at providing access to vocational training and to the labour market. Different integration programmes are drawn up at local level, in order to ensure greater proximity to beneficiaries. They must be adapted and suitable to the real situations of each individual or household.
Created by the Decree‐Law No. 232/05 of 29 December, the CSI is a measure designed to provide a basic safety net for the elderly based on the principle of social justice, and to increase the effectiveness of anti‐poverty efforts in this segment of the population. This benefit became effective on the 1st January 2006 for persons aged 80 and over and was extended to all persons aged 65 and over in 2008. All pensioners and their survivors or persons treated as such under any national or foreign systems of social protection residing legally on national territory are eligible. This measure also provides additional health payments to its beneficiaries consisting of: a) 50% of the cost of medication not already paid by the State; b) 75% of the price of glasses and lenses up to a limit of €100 every two years; c) 76% of the cost of buying and repairing removable dentures up to €250 every three years.
The legal conditions for benefiting from the Solidarity Supplement for the Elderly (CSI) are as follows:
i) Age of 65 or over;
ii) Residence in Portugal for at least the six years immediately prior to the application date;
iii) Annual income below a reference threshold defined as 4200 Euros in 2006.
One of the main problems with the implementation of this programme is the definition of its threshold. The main objective of the CSI is to reduce the poverty rate of the elderly. In order to fulfil this goal, the CSI threshold should have a value equal to the poverty line of that year. However, the government has to define the threshold before January of the year it applies to, whereas the value of the poverty line for that year will only be determined one or two years later, with the release of the information from the correspondent SILC survey. Since 2006, the value of the fixed annual threshold has always been below the poverty line: in 2006, it was fixed at 4200 Euros and the poverty rate was estimated at 4544 Euros; in 2007 it was fixed at 4338 Euros and the poverty rate was estimated at 4878 Euros.
The main consequence of this underestimation of the poverty line is that although the measure achieves a strong reduction of the poverty gap of the elderly, it is not enough to take them out of poverty. The main objective of the measure, reducing elderly poverty rate, is clearly compromised even though it achieves a very important improvement of their living conditions.
3. Methodology for the Simulation of the RSI/CSI
The microsimulation model allows us to simulate each of the measures individually and then their joint sequential simulation.
The departure point for each of the simulations is the distribution of the original income without taking into account any income component associated with the policies. This initial income – Base Income ‐ constitutes the baseline scenario with which each of the simulations will be compared.
There are some other problems that cannot be overcome using the information available. One of the problems in trying to replicate the legal framework of the CSI is that we cannot fully simulate the resources condition. The law establishes that the resources condition to apply to the CSI should take into account the income of grown‐up children, even if they don’t live with their parents. Taking into account only the income of the children who live with their parents will certainly overestimate the number of beneficiaries.
Another limitation of the simulation is that it assumes the inexistence of ‘non‐take‐up’. In reality, not all the individuals legally eligible actually apply for the benefits to which they are entitled. This problem, designated as “incomplete take‐up”, is usually explained by the lack of information for potential beneficiaries about their entitlements, coupled with the complexity of the application procedure, and the social stigma often associated to it.
Finally, the simulations are constructed under the assumption that there is no behavioural change in both households and individuals as a consequence of their participation in the CSI or RSI Programmes.
4. Main Simulation Results
The analysis of the impact of the implementation of this type of programmes may be summarised, even though it’s a complex process, by the answers to a series of simple questions: what proportion of the population benefits from their implementation? What are the economic and social costs of their application? And what are the gains in terms of social welfare and equity?
In Table 1 we present a summary of the overall results of the implementation of the RSI and CSI Programmes.
<<<<< Table 1 here >>>>>>
It is not easy to interpret these results, in particular the CSI simulation. As discussed earlier, 2006 was the first year of the implementation of the CSI programme, with a restricted target population of elderly people aged 80 years and above, meaning that the participation rate is not directly comparable. By the end of 2008, the Program is still far from its full implementation and the number of beneficiaries is around 220,000 people. Furthermore, the data from the pensions system reveals that there are more than one million pensioners receiving pensions below the CSI threshold in Portugal. It is therefore clear that the results obtained by the CSI simulation should be taken with care. To some extent, the lack of precision of the simulation can be justified by the simplifying assumptions made in the simulation, namely the assumption of full take‐up and the partial simulation of the resources condition. Obviously, the quality of the underlying data can also play a role here.
The estimated number of potential beneficiaries of the RSI (476,074 people) points to a take‐ up rate of around 35% when compared to administrative data. This figure is higher than the 28% previously estimated in Rodrigues (2004), using data for 2000. However, the total funding required is close to the actual official value. One possible explanation is that our simulation assumes that a number of households with a reference income slightly below the RSI threshold receive a very small amount of benefits, though in reality they have not applied for them 10.
5. Impact of the CSI/RSI Programmes on income distribution
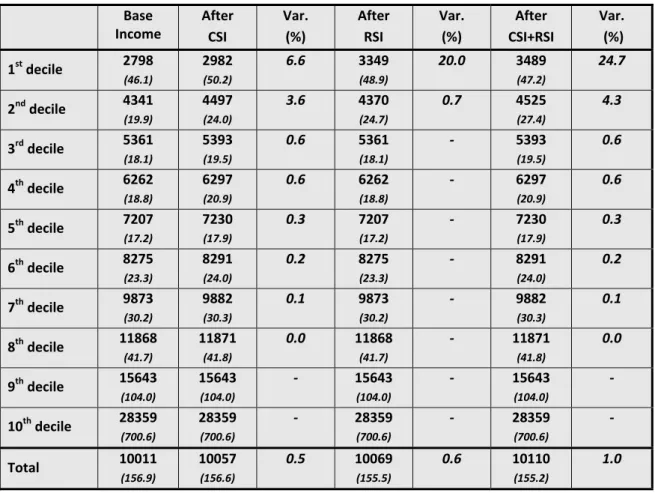
The most immediate effects of the application of both programmes on the income distribution can be seen in Table 2. This table shows the increase in the mean income per equivalent adult of the various deciles of the initial income distribution brought about by the application of the CSI, the RSI and jointly CSI and RSI.
<<<<< Table 2 here >>>>>>
The mean income per equivalent adult increases by 0.5% after the implementation of CSI and by 0.6% after the implementation of the RSI. The joint implementation of the two programmes implies an increase of around 1% of the mean equivalent income.
10
Although the impact of the two programmes on the average income is very similar, the way in which their effects are propagated along the income distribution is clearly different which suggests that the two measures have substantially different levels of progressivity.
The effects of the CSI are felt practically throughout the first eight deciles of the distribution, albeit to different extents. How is it possible that individuals situated in the middle deciles of the income distribution receive CSI benefits, even if only marginally? The explanation lies in the resource condition of the Programme. The resource condition of the CSI only takes into account the income of the person who applies for it, of his/her partner and of their grown‐up children. If an elderly person lives in a household with other unrelated people, the income of the latter is not considered. So, legally, an elderly person living in a wealthy household can apply for the Programme if his/her own controlled income is lower than the CSI threshold.
The situation is clearly different with the resources condition of the RSI. All monetary income of all the people who live with the beneficiary is taken into account except only family benefits. The main consequence of this definition of the resources condition is that the effects on the RSI are almost totally restricted to the first decile. There, the mean equivalent income increases by around 20%. The few households participating in the RSI that belong to the second decile are families with a large number of children with total income (including family benefits) clearly above their income controlled by the RSI resources condition.
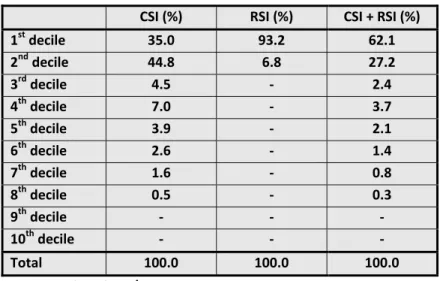
The differences in targeting of the two measures can be confirmed by the results of Tables 3A and 3B. They show the rate of individual participation in both programmes and the distribution of their beneficiaries throughout the various deciles of the distribution of disposable income per equivalent adult. In the first decile, the rate of participation in the RSI is equal to 42%, corresponding to 93% of the programme’s total number of beneficiaries. In the same decile, the participation rate of the CSI is below 16% and the percentage of the total number of beneficiaries does not exceed 35%. More than 4% of the CSI beneficiaries are above the median equivalent income.
<<<<< Tables 3A/3B here >>>>>>
<<<<< Tables 4A/4B here >>>>>>
The first conclusion that emerges from the results reported in these tables is that the two measures seem complementary in terms of targeting groups. The participation rate of the CSI is higher for household types composed exclusively by, or including elderly people, whereas the RSI has a higher participation rate of households with children. Households composed exclusively by elderly people have a CSI participation rate higher than 25%. Single parent households and large families with three or more children have higher RSI participation rate: 17% and 27%, respectively.
As would be expected, all the beneficiaries of the CSI are aged 65 or more, whereas 35% of the beneficiaries of the RSI are children.
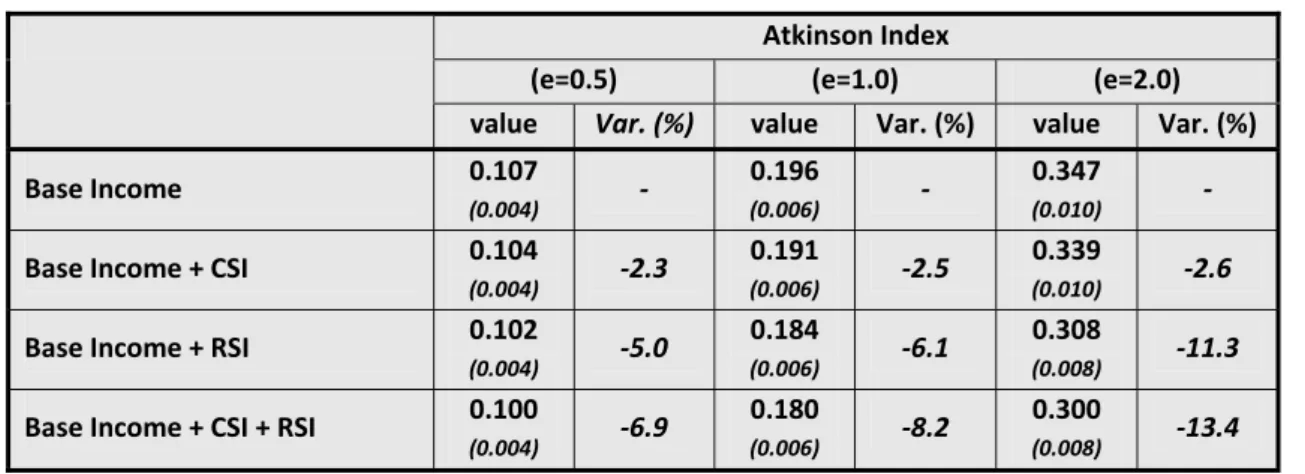
Our simulation also makes it possible to analyse the effectiveness of each of the programmes as an instrument for the reduction of inequality. Tables 5A and 5B report the change in several inequality indices after both the individual and joint simulations of each programme. All measures show a reduction in the levels of inequality. The equalizing effect of the RSI is clearly higher than that of the CSI. The former also reveals a more significant reduction in the indices that are more sensitive to the lower part of the income distribution. A reduction of roughly 11% in the Atkinson index (with a degree of aversion to inequality given by e=2) indicates that there are significant alterations in the lower income groups, confirming the earlier analysis in Table 2.
<<<<< Tables 5A/5B here >>>>>>
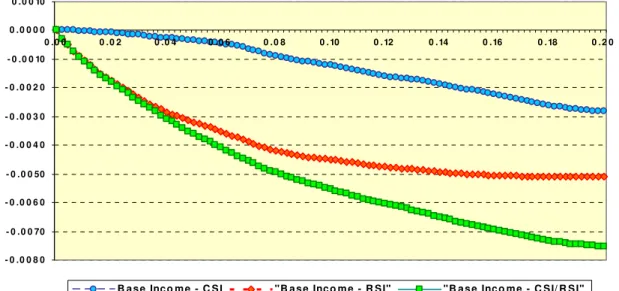
The impact of the CSI and RSI programmes on the overall income distribution, and in particularly on its bottom, can be analysed in more detail by looking at the changes to the Lorenz curves
Both the Lorenz curves of post the introduction of the CSI and RSI programmes dominate the base income curve. Furthermore, the Lorenz curve associated with the distribution of income after the RSI dominates the CSI curve thus suggesting a higher relative effectiveness of the RSI in reducing inequality.
Figure 1 shows the differences between the Lorenz Curves for the first two deciles of the income distribution. Clearly the RSI programme seems to be have a more equalizing effect on the bottom of the distribution.
<<<<< Figure 1 here >>>>>>
6. Effectiveness of the CSI/RSI Programmes in fighting poverty
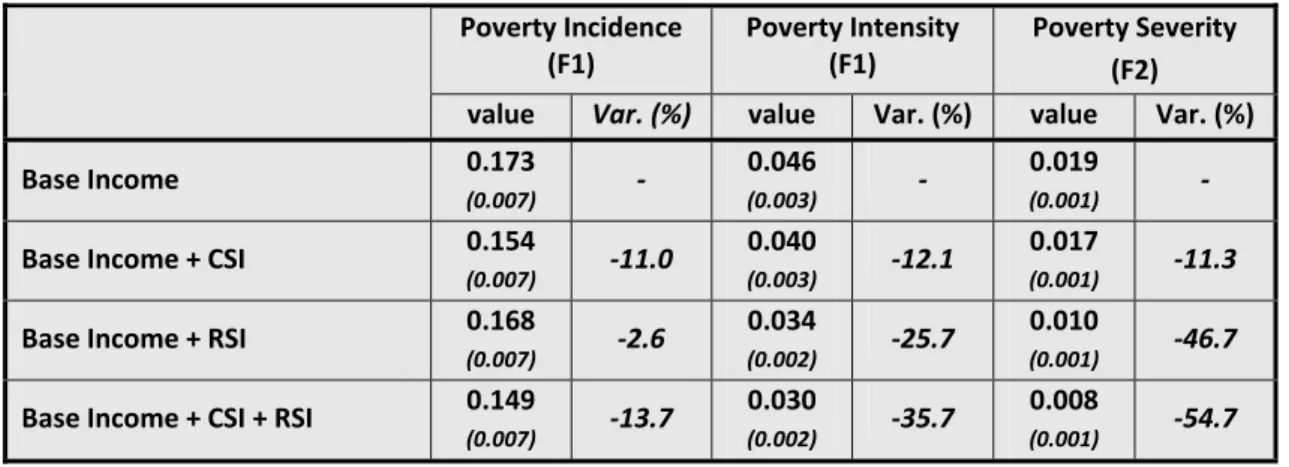
The impact of the programmes in reducing poverty can be judged from Table 7 below. Defining the poverty line as 60% of the median income per equivalent adult (around 4614 Euros per year), the simulation of the CSI shows a reduction in the poverty rate from 17.3% to 15.4%.
The effectiveness of the RSI in reducing the poverty rate is clearly smaller: only 0.5 points (from 17.3% to 16.8%). This relatively modest fall associated with the RSI programme is not surprising if we consider that its threshold corresponds only to 45% of the value of the poverty line. Considering that the legal minimum income is far below the poverty line, the programme should actually have no impact on the poverty rate, as no beneficiary should cease to be poor simply by receiving RSI transfers. Once again, the difference in the definition of household income for purposes of the RSI Programme and the total household income explains how some households that were slightly above the poverty line and had sources of income not “controlled” by the RSI might be able to leave the situation of poverty by receiving this benefit.
<<<<< Table 7 here >>>>>>
However, a more significant result is the change in the intensity and severity of poverty. Table 7 shows that the reduction in the intensity (Foster’s F1 measure) and in the severity of poverty (F2) is equal to 26% and 47%, respectively. This is to us the most successful achievement of the RSI programme: a significant improvement in the living conditions of the least privileged protected households and individuals in the Portuguese society.
resources condition. Second, the poverty rate of the elderly people falls from 24.5% to 14.4% after the implementation of the CSI. This is certainly one of the most important achievements of the programme. Finally, the impact of the CSI in reducing the poverty of elderly people living alone is null. This is one of the most important results of the simulation because it shows clearly a strong limitation of the targeting of this measure. As discussed before, the reason for this bias resides in the definition of the CSI threshold well before the estimation of the poverty line, augmented by the fact that so far its fixed value has always underestimated the verified value of the poverty line.
<<<<< Tables 8A/8B here >>>>>>
Another very different consequence of this underestimation of the poverty line by the CSI threshold can be observed in Table 8B. This table reports the poverty intensity reduction generated by the CSI and RSI programmes. Elderly people living alone record one of the highest reductions in poverty intensity across all groups of the population. As the CSI threshold is closer, but below, the poverty line, this sub‐group of the population gets a strong decrease of their poverty gap after receiving the CSI benefit, but still without crossing that line.
Another important result from Table 8B is the major reduction in the poverty intensity of households with children after the RSI: families with three or more children record a decrease above 60% and poor children 46%.
6. Efficiency of the CSI/RSI Programmes
The analysis carried out in the previous section points towards both programmes success as measures of positive discrimination in favour of the least favoured individuals and households. However, this analysis must be complemented by studying the level of efficiency in the programmes application, i.e., by an assessment of what proportion of the CSI and RSI benefits effectively contributes to the reduction of poverty.
The concept of poverty reduction efficiency associated with social transfers was developed by Beckerman (1979), who suggests the use of the following two measures:
II. Poverty Reduction Efficiency (PRE) ‐ proportion of transfers that effectively contributes to a reduction in poverty as expressed by the poverty gap.
Beckerman recognises that the use of efficiency measures does not eliminate the need for measures of the effectiveness of the poverty reduction programme; indeed they are complimentary. It should be noted that a high level of efficiency of the programme does not mean that poverty is greatly reduced, nor does a low level of efficiency imply that there has been an insignificant reduction in poverty. Efficiency measures only explain why, given the amount of money spent, the programme has a particular impact.
Since the above two measures cannot evaluate the effectiveness of a benefit in reducing poverty some authors suggest a third indicator called “Poverty Gap Efficiency” (PGE). 11 This indicator is a measure of horizontal efficiency, calculating the proportion of the aggregate poverty gap reduced by the transfers.
<<<<< Table 9 here >>>>>>
Table 9 shows that the calculation of Beckerman’s indicators for our simulation reveals two completely different situations in terms of efficiency.
The Vertical Efficiency of the RSI reaches the 100%, meaning that all transfers are awarded to households that were initially situated below the poverty line. Notice that this result is only possible because the simulation of the RSI does not take into account the possibility of fraud in applying to the programme, which certainly exists in reality. What this indicator reveals is that the RSI resources condition is comprehensive enough in terms of monetary income to prevent non‐poor people from applying to it. The Poverty Reduction Efficiency is approximately equal to 95.5%, corresponding to the proportion of transfers that effectively reduce the poverty gap.
The Vertical Efficiency of the CSI is lower than 75%, meaning that a significant part of the potential beneficiaries were not poor before the programme. Once again this reflects the limitations of the resource condition of the CSI: controlling only the economic resources of the person who applies for the CSI, his/her partner’s and their grown‐up children will allow elderly people living in wealthy households to access the programme. The Poverty Reduction
11
Efficiency of the CSI is 60%, meaning that only 221.4 millions of Euros of the total transfers of 367.9 millions effectively reduce the poverty gap of the poor population.
The different effectiveness of the CSI and RSI can be demonstrated again using the Poverty Gap Efficiency: the value of the PGE is equal to 14.9 under the CSI programme and 22.1 under the RSI.
7. Conclusions
The microsimulation of the two main means‐tested measures implemented in Portugal to reduce poverty carried out in this study allows for the preliminary assessment of the scope of these programmes, the number of beneficiaries involved, the budgetary costs associated with the transfers, the changes brought about in the income distribution and inequality levels and their impact on the various dimensions of poverty.
The effectiveness of the CSI and RSI Programmes in fighting poverty seems clearly demonstrated and its joint application reveals the potentialities of these measures to reduce different dimensions of poverty, particularly the poverty of children and the elderly.
The analysis of the effects of the CSI and RSI on the income distribution makes it possible to stress the fact that programmes with a national scope, designed to fight situations of poverty and social exclusion, may have a significant positive impact on families living in a situation of great precariousness.
The simulation of the CSI and RSI also enables us to highlight possible insufficiencies and gaps in the programmes design, which, if corrected, will increase both their effectiveness and efficiency. This is particularly clear in the analysis of the resources condition and the definition of the threshold of the CSI.
Finally, our simulations of the CSI and of the RSI clearly reveal a significant non‐take‐up of these benefits. This is an issue not yet studied in Portugal. However, if we intend to improve these two measures and increase their effectiveness and efficiency, the policies concerned with the non‐take‐up of CSI and RSI should be strengthened.
REFERENCES
Atkinson A.B., B. Cantillon, E. Marlier and B. Nolan (2002), Social Indicators The EU and Social Inclusion, Oxford University Press, Oxford,UK.
Atkinson A.B., B. Cantillon, E. Marlier and B. Nolan (2005), Taking forward the EU Social Inclusion Process, Luxembourg Presidency of the Council of the European Union.
Atkinson, A.B. e F. Bourguignon (eds.) (1999), Handbook of Income Distribution. North Holland, Amsterdam.
Beckerman, W. (1979), "The Impact of Income Maintenance Programmes on Poverty in Four Developed Countries", International Labour Office, Geneve.
Costa, A. B. (1994), "The Measurement of Poverty in Portugal", Journal of European Social Policy, 4(2), 95‐115.
Cowell, F, (1999), “Measurement of Inequality”, in Atkinson, A.B. and Bourguignon,F. (eds.),
Handbook of Income Distribution. North Holland, Amsterdam, 87‐166.
Cowell, F. (1994), Measuring Inequality, LSE Handbooks in Economics, London (2nd ed.).
EU (2008), National Strategy Reports on Social Protection and Social Inclusion, Portugal 2008‐ 2010. European Commission, Employment and Social Affairs.
Figari, F., H.Levi and H.Sutherland (2007), “Using The EU‐SILC For Policy Simulation: Prospects, some Limitations and Suggestions”, EUROMOD Working Paper EM1/07, ISER, University of Essex, Colchester.
Foster, J., J. Greer and E. Thorbecke. (1984), “A Class of Decomposable Poverty Measures”,
Econometrica; 52(3), 761‐66.
Gouveia, M. and C.F. Rodrigues (2002), “The Impact of a Guaranteed Minimum Income Program in Portugal", Public Finance and Management, 2(2).
Harris, G. (1994) “The Take‐up of Income Related Benefits: Inaccuracies in the Estimation of Take‐up Rates.",ASD‐Department of Social Security, UK.
Immervoll, H., C. O’Donoghue, and H. Sutherland (1999), “An introduction to EUROMOD”, EUROMOD Working Paper EM0/99, ISER, University of Essex, Colchester
Matsaganis M., C. O’Donoghue, H. Levy, M. Coromaldi, M. Mercader‐Prats, C.F. Rodrigues, S. Toso. and P. Tsakloglou. (2006), “Reforming Family Transfers in Southern Europe: Is there a role for Universal Child Benefits?”, Social Policy and Society, 5‐2, 189‐197.
Matsaganis, M., A. Paulus and H. Sutherland (2008). “The take up of social benefits.” Research Note 5/2008. European Commission, European Observatory on the Social Situation and Demography.
Pereirinha, J. (1996), "Welfare States and Anti‐Poverty Regimes: the case of Portugal". South European Society & Politics, 1(3), 198‐218.
Ravallion, M. (1994), Poverty Comparisons, Harwood Academic Publishers, Chur Switzerland.
Rodrigues, C.F. (2008), Distribuição do Rendimento, Desigualdade Pobreza: Portugal nos anos 90, Edições Almedina, Coimbra, Portugal.
Rodrigues, C.F. (2007), "Income in EU‐SILC ‐ Net/Gross Conversion Techniques for Building and using EU‐SILC Databases", in Eurostat (ed.), Comparative EU Statistics on Income and Living Conditions: Issues and Challenges, Eurostat, Luxembourg, pp 159‐172.
Rodrigues, C.F. (2004), “The Redistributive Impact of the Guaranteed Minimum Income Programme in Portugal”, Instituto Superior de Economia e Gestão (ISEG), Economics Department, Working Paper 09/2004
Sen, A. (1997), On Economic Inequality, Expanded Edition with a Substantial Annexe by James Foster and Amartya Sen, Clarendon Paperbacks.
Sutherland, H. (2007). “EUROMOD: the tax‐benefit microsimulation model for the European Union.” In A. Gupta and A. Harding (eds.), Modelling Our Future: Population Ageing, Health and Aged Care, vol. 16. Amsterdam: Elsevier, pp. 483–88.
Sutherland H. (2001), “EUROMOD: an integrated European benefit‐tax model, final report”, EUROMOD Working Paper EM9/01, ISER, University of Essex, Colchester.
Table 1 - Simulated Impact of CSI and RSI on Income Distribution
Individual Participation Rate
Values (%)
CSI ‐ “Solidarity Supplement for the Elderly” 472189 4.5
RSI ‐ “Social Integration Income” 476074 4.5
RSI after CSI 426172 4.0
RSI + CSI 895916 8.5
Both RSI and CSI 2446 0.02
Source: MicroSimPT / 2007 Portuguese EU‐SILC
Table 2 - Simulated Impact of CSI and RSI on Income Distribution
Base
Income After CSI Var. (%) After RSI Var. (%) After CSI+RSI Var. (%) 1st decile 2798
(46.1)
2982
(50.2)
6.6 3349
(48.9)
20.0 3489
(47.2)
24.7
2nd decile 4341
(19.9)
4497
(24.0)
3.6 4370
(24.7)
0.7 4525
(27.4)
4.3
3rd decile 5361
(18.1)
5393
(19.5)
0.6 5361
(18.1)
‐ 5393
(19.5)
0.6
4th decile 6262
(18.8)
6297
(20.9)
0.6 6262
(18.8)
‐ 6297
(20.9)
0.6
5th decile 7207
(17.2)
7230
(17.9)
0.3 7207
(17.2)
‐ 7230
(17.9)
0.3
6th decile 8275
(23.3)
8291
(24.0)
0.2 8275
(23.3)
‐ 8291
(24.0)
0.2
7th decile 9873
(30.2)
9882
(30.3)
0.1 9873
(30.2)
‐ 9882
(30.3)
0.1
8th decile 11868
(41.7)
11871
(41.8)
0.0 11868
(41.7)
‐ 11871
(41.8)
0.0
9th decile 15643
(104.0)
15643
(104.0)
‐ 15643
(104.0)
‐ 15643
(104.0)
‐
10th decile 28359
(700.6)
28359
(700.6)
‐ 28359
(700.6)
‐ 28359
(700.6)
‐
Total 10011
(156.9)
10057
(156.6)
0.5 10069
(155.5)
0.6 10110
(155.2)
1.0
Notes: Standard errors in parenthesis
Source: MicroSimPT / 2007 Portuguese EU‐SILC
Table 3A - Simulated Impact of CSI and RSI on Income Distribution
Participation Rate by Decile
CSI (%) RSI (%) CSI + RSI (%)
1st decile 15.7 42.0 52.7
2nd decile 19.9 3.1 23.0
3rd decile 2.0 ‐ 2.0
4th decile 3.1 ‐ 3.1
5th decile 1.7 ‐ 1.7
6th decile 1.2 ‐ 1.2
7th decile 0.7 ‐ 0.7
8th decile 0.2 ‐ 0.2
9th decile ‐ ‐ ‐
10th decile ‐ ‐ ‐
Total 4.5 4.5 8.5
Source: MicroSimPT / 2007 Portuguese EU‐SILC
Table 3B - Simulated Impact of CSI and RSI on Income Distribution
Distribution of Beneficiaries by Decile
CSI (%) RSI (%) CSI + RSI (%)
1st decile 35.0 93.2 62.1
2nd decile 44.8 6.8 27.2
3rd decile 4.5 ‐ 2.4
4th decile 7.0 ‐ 3.7
5th decile 3.9 ‐ 2.1
6th decile 2.6 ‐ 1.4
7th decile 1.6 ‐ 0.8
8th decile 0.5 ‐ 0.3
9th decile ‐ ‐ ‐
10th decile ‐ ‐ ‐
Total 100.0 100.0 100.0
Source: MicroSimPT / 2007 Portuguese EU‐SILC
Table 4A - Simulated Impact of CSI and RSI on Income Distribution
Participation Rate by Household Type and Age
CSI (%) RSI (%) CSI + RSI (%)
Household Type
Single person ‐ age < 65 ‐ 1.8 1.8
Single person ‐ age >= 65 26.0 ‐ 26.0
2 adults, both adults under 65 years ‐ 3.9 3.9
2 adults, at least one adult 65 years or more 21.0 3.1 21.0
Other households without dependent children 3.9 1.5 5.3
Single parent household ‐ 17.0 17.0
2 adults, one dependent child 0.2 2.2 2.4
2 adults, two dependent children ‐ 7.3 7.3
2 adults, three or more dependent children 0.1 27.4 27.4
Other households with dependent children 2.3 3.7 5.3
Age
Less than 16 years ‐ 9.7 9.4
Between 16 and 24 years ‐ 4.2 3.9
Between 25 and 44 years ‐ 4.5 4.3
Between 45 and 64 years ‐ 3.3 2.8
65 years and over 25.8 1.3 25.8
Total 4.5 4.5 8.5
Source: MicroSimPT / 2007 Portuguese EU‐SILC
Table 4B - Simulated Impact of CSI and RSI on Income Distribution4B
Distribution of Beneficiaries by Household Type and Age
CSI (%) RSI (%) CSI + RSI (%)
Household Type
Single person ‐ age < 65 ‐ 0.9 0.5
Single person ‐ age >= 65 22.2 ‐ 11.7
2 adults, both adults under 65 years ‐ 7.5 4.0
2 adults, at least one adult 65 years or more 52.3 7.6 27.6
Other households without dependent children 15.7 6.0 11.3
Single parent household ‐ 10.0 5.3
2 adults, one dependent child 0.8 8.3 4.9
2 adults, two dependent children ‐ 25.7 13.6
2 adults, three or more dependent children 0.1 19.6 10.4
Other households with dependent children 8.8 14.4 10.8
Age
Less than 16 years ‐ 35.5 18.4
Between 16 and 24 years ‐ 10.2 5.0
Between 25 and 44 years ‐ 30.7 15.6
Between 45 and 64 years ‐ 18.6 8.2
65 years and over 100.0 4.9 52.7
Total 100.0 100.0 100.0
Source: MicroSimPT / 2007 Portuguese EU‐SILC
Table 5A - Simulated Impact of CSI and RSI on Income Distribution
Inequality Measures (1)
Gini S80/S20 S90/S10
value Var. (%) value Var. (%) value Var. (%)
Base Income 0.362
(0.006) ‐
6.2
(0.185) ‐
10.1
(0.407) ‐
Base Income + CSI 0.358
(0.006) ‐1.2
5.9
(0.176) ‐4.5
9.6
(0.393) ‐6.2
Base Income + RSI 0.354
(0.006) ‐2.0
5.7
(0.156) ‐7.5
8.7
(0290) ‐16.4
Base Income + CSI + RSI 0.351
(0.006) ‐3.0
5.5
(0.150) ‐10.9
8.2
(0.283) ‐19.8
Notes: Standard errors in parenthesis
Source: MicroSimPT / 2007 Portuguese EU‐SILC
Table 5B - Simulated Impact of CSI and RSI on Income Distribution
Inequality Measures (2)
Atkinson Index
(e=0.5) (e=1.0) (e=2.0)
value Var. (%) value Var. (%) value Var. (%)
Base Income 0.107
(0.004) ‐
0.196
(0.006) ‐
0.347
(0.010) ‐
Base Income + CSI 0.104
(0.004) ‐2.3
0.191
(0.006) ‐2.5
0.339
(0.010) ‐2.6
Base Income + RSI 0.102
(0.004) ‐5.0
0.184
(0.006) ‐6.1
0.308
(0.008) ‐11.3
Base Income + CSI + RSI 0.100
(0.004) ‐6.9
0.180
(0.006) ‐8.2
0.300
(0.008) ‐13.4
Notes: Standard errors in parenthesis
Source: MicroSimPT / 2007 Portuguese EU‐SILC
Table 6 - Simulated Impact of CSI and RSI – Lorenz Curves
Base
Income After CSI After RSI After CSI+RSI 1st decile 0.028
(0.001) 0.029 (0.001) 0.032 (0.001) 0.033 (0.001)
2nd decile 0.071
(0.001) 0.074 (0.001) 0.076 (0.001) 0.079 (0.001)
3rd decile 0.125
(0.002) 0.128 (0.002) 0.130 (0.002) 0.133 (0.002)
4th decile 0.188
(0.003) 0.191 (0.003) 0.192 (0.003) 0.195 (0.003)
5th decile 0.260
(0.004) 0.262 (0.004) 0.264 (0.004) 0.267 (0.004)
6th decile 0.342
(0.004) 0.345 (0.004) 0.346 (0.004) 0.349 (0.004)
7th decile 0.441
(0.005) 0.443 (0.005) 0.444 (0.005) 0.446 (0.005)
8th decile 0.560
(0.006) 0.562 (0.006) 0.562 (0.006) 0.564 (0.006)
9th decile 0.716
(0.006) 0.717 (0.006) 0.718 (0.006) 0.719 (0.006)
10th decile 1.000 1.000 1.000 1.000
Notes: Standard error in parenthesis
Source: MicroSimPT / 2007 Portuguese EU‐SILC
Table 7 - Simulated Impact of CSI and RSI on Income Distribution
Poverty Measures (1)
Poverty Incidence (F1)
Poverty Intensity (F1)
Poverty Severity (F2)
value Var. (%) value Var. (%) value Var. (%)
Base Income 0.173
(0.007) ‐
0.046
(0.003) ‐
0.019
(0.001) ‐
Base Income + CSI 0.154
(0.007) ‐11.0
0.040
(0.003) ‐12.1
0.017
(0.001) ‐11.3
Base Income + RSI 0.168
(0.007) ‐2.6
0.034
(0.002) ‐25.7
0.010
(0.001) ‐46.7
Base Income + CSI + RSI 0.149
(0.007) ‐13.7
0.030
(0.002) ‐35.7
0.008
(0.001) ‐54.7
Notes: Standard errors in parenthesis
Source: MicroSimPT / 2007 Portuguese EU‐SILC
Table 8A - Simulated Impact of CSI and RSI on Income Distribution
Poverty Incidence Reduction (F0 x 100) by Household Type and Age
Base
Income
After CSI
Var. (%)
After RSI
Var.
(%) Household Type
Single person ‐ age < 65 25.2 25.2 ‐ 25.2 ‐
Single person ‐ age >= 65 36.0 36.0 ‐ 36.0 ‐
2 adults, both adults under 65 years 16.2 16.2 ‐ 16.2 ‐
2 adults, at least one adult 65 years or more 25.0 9.1 ‐63.8 25.0 ‐ Other households without dependent
children 9.5 9.1 ‐4.2 9.5 ‐
Single parent household 34.3 34.3 ‐ 32.2 ‐5.9
2 adults, one dependent child 10.7 10.5 ‐1.6 10.7 ‐
2 adults, two dependent children 16.3 16.3 ‐ 16.3 ‐
2 adults, three or more dependent children 42.1 42.1 ‐ 32.2 ‐23.6
Other households with dependent children 16.1 15.9 ‐1.4 15.6 ‐ Age
Less than 16 years 20.2 20.1 ‐0.6 18.5 ‐8.9
Between 16 and 24 years 16.6 16.5 ‐0.8 16.2 ‐2.1
Between 25 and 44 years 13.6 13.4 ‐0.9 13.2 ‐2.9
Between 45 and 64 years 15.2 14.8 ‐2.8 15.2 ‐0.1
65 years and over 24.5 14.4 ‐41.1 24.5 ‐
Total 17.3 15.4 ‐11.1 16.8 ‐2.6
Source: MicroSimPT / 2007 Portuguese EU‐SILC
Table 8B - Simulated Impact of CSI and RSI on Income Distribution
Poverty Intensity Reduction (F1 x 100) by Household Type and Age
Base
Income
After CSI
Var. (%)
After RSI
Var.
(%) Household Type
Single person ‐ age < 65 8.9 8.9 ‐ 8.2 ‐6.9
Single person ‐ age >= 65 8.5 3.3 ‐61.1 8.5 ‐
2 adults, both adults under 65 years 5.2 5.2 ‐ 4.4 ‐15.0
2 adults, at least one adult 65 years or more 4.7 2.3 ‐50.7 4.2 ‐9.9
Other households without dependent
children 2.3 2.0 ‐10.5 1.9 ‐17.3
Single parent household 12.7 12.7 ‐ 6.5 ‐49.0
2 adults, one dependent child 2.7 2.6 ‐1.1 2.1 ‐20.0
2 adults, two dependent children 5.0 5.0 ‐ 3.0 ‐38.7
2 adults, three or more dependent children 12.6 12.5 ‐0.2 4.8 ‐61.6
Other households with dependent children 4.1 3.8 ‐6.1 3.1 ‐24.2
Age
Less than 16 years 5.8 5.8 ‐1.1 3.1 ‐46.0
Between 16 and 24 years 4.7 4.6 ‐2.3 3.4 ‐27.2
Between 25 and 44 years 3.9 3.8 ‐2.6 2.7 ‐29.5
Between 45 and 64 years 4.6 4.4 ‐4.3 3.7 ‐18.0
65 years and over 4.7 2.0 ‐56.3 4.4 ‐5.8
Total 4.6 4.0 ‐12.1 3.4 ‐25.7
Table 9 - Simulated Impact of CSI and RSI on Income Distribution Efficiency.
CSI RSI
Total Amount of Transfers 367.9 343.9
Total Amount of Transfers to Poor Population 270.8 343.9
Poverty Gap before the Programme 1484.5 1484.5
Poverty Gap after the Programme 1263.1 1156.0
Reduction of the Poverty Gap 221.4 328.5
VEP – Vertical Efficiency of the Programme 73.6 100.0
PRE – Poverty Reduction Efficiency 60.2 95.5
PGE ‐ Poverty Gap Efficiency 14.9 22.1
Note: Amounts in 106 Euros
Source: MicroSimPT / 2007 Portuguese EU‐SILC
Figure 1 - Impact of CSI and RSI on Lorenz Curves
Difference between Lorenz Curves
- 0 .0 0 8 0 - 0 . 0 0 70 - 0 .0 0 6 0 - 0 . 0 0 50 - 0 .0 0 4 0 - 0 .0 0 3 0 - 0 .0 0 2 0 - 0 .0 0 10 0 .0 0 0 0 0 .0 0 10
0 .0 0 0 . 0 2 0 .0 4 0 .0 6 0 . 0 8 0 . 10 0 . 12 0 .14 0 .16 0 . 18 0 . 2 0
B a s e Inc o m e - C S I "B a s e Inc o m e - R S I" "B a s e Inc o m e - C S I/ R S I"
Source: MicroSimPT / 2007 Portuguese EU‐SILC