UNIVERSIDADE DO ALGARVE
Faculdade de Ciências e Tecnologia
HEAVY METAL LEVELS IN ANALYTICAL
LABORATORIES WASTE: A study for the
implementation of a programme for the control and
disposal of waste from microbiology and chemical
analysis laboratories.
GEORGE AGYEI
Mestrado em Qualidade em Análises
(European Master in Quality in Analytical Laboratories)
HEAVY METAL LEVELS IN ANALYTICAL
LABORATORIES WASTE: A study for the
implementation of a programme for the control and
disposal of waste from microbiology and chemical
analysis laboratories.
Mestrado em Qualidade em Análises
(European Master in Quality in Analytical Laboratories)
GEORGE AGYEI
Thesis supervised by:
Prof. Lídia Adelina Pó Catalão Dionísio
UNIVERSIDADE DO ALGARVE
Faculdade de Ciências e Tecnologia
iii
DEDICATION
This research is dedicated to God Almighty, my father Mr Andrews Owusu Agyei (Retired Social Welfare Regional Director for Central Region-Ghana), my mother Mrs. Salomey Owusu Agyei , all my siblings and family members .
iv
ACKNOWLEDGEMENT
A special word of thanks goes to my invaluable supervisors; Prof. Lidia Dionisio and Dr. Paulo Pedro (University of Algarve) for their vital comments, suggestions that I needed for this work. To my supervisors I say, God bless you. My gratitude also goes to Prof. Miquel Esteban (University of Barcelona) and Prof. Isabel Cavaco for their immeasurable assistance offered to me during my studies in EMQAL. Many thanks to Marta and Bruno at LAQ for their unconditional help they offered me.
Special thanks to Portia Ababio (OLA Training College, Cape-Coast-Ghana), and all my friends, especially Louis Kwame Boamponsem (Laboratory Technology Department, UCC-Ghana), Michael Owusu (Family Care Pharmacy, Kumasi-Ghana), Alfred Amofah (Skyy FM Takoradi-Ghana) and Laboratory Staff Members at SDA Hospital, Kwadaso-Kumasi.
Thanks to all the people I have met during these months. Thanks to all my batch mates especially John and Prabal for making this enjoyable experience really fun.
God bless you all for your encouragement.
v TABLE OF CONTENTS CONTENT PAGE DEDICATION………. iii ACKNOWLEDGEMENT... iv
LIST OF TABLES……….. viii
LIST OF FIGURES……… ix
LIST OF ACRONYMS……….. xi
ABSTRACT………. xii
SUMMARY (RESUMO)……… xiii
CHAPTER ONE………. 1
INTRODUCTION……….. 1
1.1 BACKGROUND………... 1
1.2 PROBLEM STATEMENT……….... 3
1.3 OBJECTIVES OF THE STUDY……….. 3
CHAPTER TWO LITERATURE REVIEW……….. 4
2.1 HEAVY METALS………. 4
2.2 TOXICITY OF HEAVY METALS……….. 4
2.2.1 Chromium………... 5 2.2.2 Nickel……….. 5 2.2.3 Aluminum………... 5 2.2.4 Cadmium……… 6 2.2.5 Zinc……… 7 2.2.6 Copper……… 7 2.2.7 Lead……… 8 2.2.8 Mercury………... 8 2.2.9 Iron (Fe)………….……… 9 2.2.10 Arsenic (As)……….. 9
vi
2.3 LABORATORY WASTE………. 10
2.3.1 Microbiology analysis laboratory waste………... 10
2.3.2 Chemical analysis laboratory waste………... 11
2.3.3 Biomedical waste management………. 11
2.4 RESEARCH ON LABORATORY WASTE CONTROL AND DISPOSAL……… 13
2.4.1 ISO 14001 Standard……….. 13
2.4.2 Inertization of acidified liquid waste with low heavy metals…. 13 2.4.3 Heavy metal sorption……… 15
CHAPTER THREE MATERIALS AND METHODS……….. 16
3.1 THE STUDY AREA……… 16
3.1.1 Waste disposal at LAQ in the Algarve University…………... 16
3.1.2 Application of statistical methods for the evaluation and assessing the levels of the studied heavy metals………. 17
3.2 EQUIPMENT AND SUPPLIES………... 17
3.3 REAGENTS AND MEDIA………. 18
3.4 SAMPLE COLLECTION AND PREPARATION………. 18
3.4.1 Liquid waste sampling and preparation from Chemical analysis laboratory……….. 18
3.4.2 Liquid waste sampling and preparation from Microbiology laboratory……….. 19
3.4.3 Standard sample solution preparation………. 19
3.5 ATOMIC ABSORPTION SPECTROMETRY ANALYSIS – TECHNIQUE……… 22
vii
3.5.2 Precision, sensitivity and detection limit of the AAS…………... 24
3.6 SAMPLING FROM MICROBIOLOGY LABORATORY………. 25 3.6.1 Media preparation………. 25 3.6.2 Microbial growth………. 26
CHAPTER FOUR
RESULTS AND DISCUSSION………. 27
4.1 QUALITY CONTROL FOR MICROBIAL GROWTH………….. 27 4.1.2 Viable counting of autoclave inactivation sample (AIS – sample) and autoclave sterilization sample (ASS-sample) from autoclaves of microbiology laboratories………. 27 4.1.3 Microbiological evaluation of inactivated and sterile autoclave sample……… 28 4.2 CALIBRATION CURVES FOR HEAVY METALS……….. 29 4.3 QUALITY CONTROL REFERENCE RANGE FOR HEAVY METALS ANALYSIS………. 35 4.4 HEAVY METAL LEVELS IN THE STUDIED SAMPLES…….. 37 4.4.1 Heavy metals levels in Microbiology samples (m.s)……… 37 4.4.2 Heavy metals levels in Chemical samples (c.s)……….. 43 4.4.3 Mean, maximum / minimum concentration values obtained and relation to acceptable levels of disposal………. 48 4.4.4 Bar charts for the mean concentrations of heavy metals in samples……….. 51
CHAPTER FIVE
CONCLUSION AND RECOMMENDATION……….. 54
REFERENCES……….. 56
viii
List of tables
TABLE 1: Heavy metal amount in product
TABLE 2: Results from Microbiology laboratory samples
TABLE 3: Guidelines for Maximum admissible values for parameters in industrial water residuals [mg/L]
TABLE 4: Concentration values of heavy metals in Chemical (C) laboratory samples (mg/L)
TABLE 5: Concentration values of heavy metals in Microbiology (M) laboratory samples (mg/L)
ix
List of figures
Figure 1: Calibration curve for Cr Figure 2: Calibration curve for Zn Figure 3: Calibration curve for Ni Figure 4: Calibration curve for Cu Figure 5: Calibration curve for Cd Figure 6: Calibration curve for Pb Figure 7: Calibration curve for Fe Figure 8: Calibration curve for Al Figure 9: Calibration curve for As Figure 10: Calibration curve for Hg
Figure 11: Pb levels in Microbiology laboratory samples Figure 12: Cu levels in Microbiology laboratory samples Figure 13: Zn levels in Microbiology laboratory samples Figure 14: Cr levels in Microbiology laboratory samples Figure 15: Cd levels in Microbiology laboratory samples Figure 16: Ni levels in Microbiology laboratory samples Figure 17: Fe levels in Microbiology laboratory samples Figure 18: As levels in Microbiology laboratory samples Figure 19: Hg levels in Microbiology laboratory samples Figure 20: Al levels in Microbiology laboratory samples
x
Figure 21: Pb levels in Chemical laboratories samples Figure 22: Cu levels in Chemical laboratories samples
Figure 23: Zn levels in Chemical laboratories samples Figure 24: Cr levels in Chemical laboratories samples
Figure 25: Cd levels in Chemical laboratories samples Figure 26: Ni levels in Chemical laboratories samples Figure 27: Fe levels in Chemical laboratories samples Figure 28: As levels in Chemical laboratories samples Figure 29: Hg levels in Chemical laboratories samples Figure 30: Al levels in Chemical laboratories samples
Figure 31: Mean concentration of heavy metals in DRAAL (C.S) (n=4) Figure 32: Mean concentration of heavy metals in LAQ (C.S) (n=12)
Figure 33: Mean concentration of heavy metals in Microbiology samples (M.S) (n=10)
xi
List of Acronyms
EPA Environmental Protection Agency. RCRA Resource Conservation and Recovery Act. GLP Good Laboratory Practice.
AAS Atomic Absorption Spectroscopy. APA Agencia Portuguesa do Ambiente Al Aluminium Cr Chromium Ni Nickel Cd Cadmium Zn Zinc Cu Copper Pb Lead Hg Mercury Fe Iron As Arsenic
LAQ Laboratório de Análises Químicas
PCA Plate Count Agar PDA Potatoes Dextrose Agar
ASS Autoclave Sterilization Sample AIS Autoclave Inactivation Sample
WC-DP Waste-Control and Disposal programme M.S Microbiology Samples
C.S Chemical Samples
SOP Standard Operating Procedures
DRAAL Direção Regional de Agricultura do Algarve.
xii
ABSTRACT
Analytical Laboratories daily routine analyses leads to the generation of solid and liquid waste. Quality assurance and quality control procedures are employed in most of these laboratories to ensure that accurate results are obtained and the waste generated out of these analyses are properly stored for collection by waste treatment companies. The cost associated with waste treatment varies with the type of waste generated. Liquid waste are quantified or priced according to the volume of waste. Microbiology waste are inactivated and added to solid waste for collection and treatment but residues from Chemical Analysis Laboratories cannot be emptied down the drainage systems since it can contain some levels of heavy metals which can be dangerous to the environment or human. Therefore the objective of this thesis was to characterize some of these important heavy metals so that they can be treated and discarded by the laboratory staff leading to reduction in payment for their treatment by external companies. The research involved the determination of total heavy metal (Pb, Cu Zn, Cr, Cd, Ni, Fe, As, Hg, Al) levels in Microbiology (M) and Chemical (C ) samples using the Atomic Absorption Spectroscopy (AAS). Flame technique was used for the analysis of Cd, Cu, Zn, Fe, Pb, Cr, Ni and Al was analyzed with Furnace technique. However, hydride generation and cold vapour procedures were used for As and Hg respectively. The mean concentration of all the Heavy metals analyzed from the chemical (c) and microbiology (M) samples were all below the Guidelines for Maximum Admissible values for parameter in industrial water residuals with the exception of Fe, Al, As and Hg levels in the DRAAL and LAQ chemical samples which showed concentrations values of 5.0, 89.5, 5.93, 0.42 mg/L and 21.9, 19.0, 3.59, 0.11mg/L respectively, which were higher than the recommended levels of 2.0, 10, 0.5, 0.05mg/L respectively. The microbiological samples were cultured for microorganisms by employing the Incorporation Technique with PCA and PDA. No growth was recorded for both media after 24 and 48 hours of incubation. The results obtained could be used to implement the WC-D programme (Waste-Control and Disposal programme) for microbiological and chemical analysis laboratories of the University.
Keywords: Heavy metal levels, Waste treatment, Analytical laboratories, Atomic absorption spectroscopy, Incorporation technique, Waste control and disposal.
xiii
RESUMO
As análises de rotina realizadas em Laboratórios Analíticos geram resíduos sólidos e líquidos. A maioria desses laboratórios praticam procedimentos para a garantia e controle da qualidade, que visam assegurar resultados precisos e que os resíduos gerados a partir dessas análises sejam devidamente armazenados para posterior recolha por empresas de tratamento de resíduos. O custo associado ao tratamento de resíduos varia com o tipo de resíduos produzido. Os resíduos líquidos são quantificados ou apreçados de acordo com o seu volume. Os resíduos provenientes da Microbiologia são inactivados e adicionados ao resíduo sólido para a recolha e tratamento, mas os resíduos de laboratórios de análises químicas não podem ser descarregados diretamente para os sistemas de drenagem, uma vez que podem conter metais pesados em concentrações que podem ser perigosas para o ambiente ou para o homem, por conseguinte, o objectivo da presente tese foi caracterizar alguns metais pesados de modo que os resíduos possam ser tratados e descartados pelo pessoal de laboratório reduzindo desta forma os gastos com o tratamento por empresas externas. A pesquisa envolveu a determinação dos metais pesados totais (Pb, Cu, Zn, Cr, Cd, Ni, Fe, As, Hg, Al) em amostras provenientes da Microbiologia (M) e da Química (C) usando Espectroscopia de Absorção Atómica (AAS). A técnica de chama foi utilizada para a análise de Cd, Cu, Zn, Fe, Pb, Cr, Ni e o Al foi analisado através da técnica do forno. A geração de hidretos e vapor frio foram os procedimentos utilizados para o As e Hg, respectivamente. A concentração média de todos os metais pesados analisados em amostras da Química (c) e da Microbiologia(M) foram inferiores aos valores máximos admissíveis em resíduos de água industrial, com excepção nas amostras do laboratório de química. Os níveis de Fe, Al, As e Hg em amostras submetidas a análises químicas provenientes da DRAAL e LAQ que apresentaram concentrações de 5,0, 89, 5, 5,93 e 0,42 mg/L e 21,9, 19,0, 3,59, 0,11 mg/L respectivamente, encontram-se acima dos níveis recomendados de 2,0, 10, 0,5 e 0,05 mg/L, respectivamente. As amostras provenientes da microbiologia foram cultivadas em meio PCA e PDA, empregando a técnica de incorporação da amostra no meio de cultura. Não foi registado nenhum crescimento para ambos os meios, após 24 e 48 horas de incubação. Os resultados obtidos poderão ser utilizados para implementar o programa WC-D (resíduos de controle e programa de eliminação) para os laboratórios de análise microbiológica e química.
1 CHAPTER ONE
INTRODUCTION
1.1 BACKGROUND
The laboratory is a place where analytical techniques or procedure(s) are applied to achieve supposed desired results. For the purpose of this thesis, a waste as defined in the EU Directive [2008/98/EC] means any substance or object which the holder discards or intends or is required to discard. <<The classification of waste as hazardous waste should be based, inter alia, on the community legislation on chemicals, in particular concerning the classification of preparations as hazardous, including concentration limit values used for that purpose. Hazardous waste should be regulated under strict specifications in order to prevent or limit, as far as possible, the potential negative effects on the environment and on human health due to inappropriate management >>. [1]
Whoever, generate such waste have moral and legal obligations to guarantee that the waste is handled and disposed of in ways that pose minimum potential harm, both short term and long term, to health and the environment.
Good Laboratory Practice (GLP) embodies a set of principles that provides a framework within which laboratory studies are planned, performed, monitored, recorded, reported and archived. These studies are undertaken to generate data by which the hazards and risks to users, consumers and third parties, including the environment, can be assessed for pharmaceuticals (only preclinical studies), agrochemicals, cosmetics, food additives, feed additives and contaminants, novel foods, biocides, detergents as examples. GLP helps, regulatory authorities, to assure that data submitted are a true reflection of the results obtained during the study and can therefore be relied upon when making risk/safety assessments.[2] Wastes generated in microbiological and chemical analysis laboratories will be considered in this research in order to suggest how they can be controlled and disposed properly, according to a proposed program.
Information from some visited private and public laboratories in Faro-Portugal will be included as to how they also go about their waste management.
2
A simple definition for chemical analysis laboratory which falls under an environmental laboratory might be: A laboratory that analyzes environmental samples such as water and soil that contains microbiological and chemical contaminants of both public and environmental health concern. It also ensures that drinking water provided to citizens was free of disease-causing microorganisms and to test waste water effluent for contamination that may degrade the quality of the waterway into which the effluent is discharged. [3]
Heavy metals are among the most dangerous groups of anthropogenic environmental pollutants due to their potential toxicity and persistence in the environment. [4] Heavy metals can cause health problems at higher exposures and destroy aquatic organisms when leached into water bodies. Heavy metals contamination of aquatic environments has raised serious concern due to their tendency to accumulate in aquatic habitats. Heavy metals residues in contaminated habitats may accumulate in microorganisms, aquatic flora and fauna, which in turn may enter the human food chain and result in health problems.[5] Over the last decades, there has been a growing concern about atmospheric particulates (including heavy metals) because evidence has shown that they are associated with respiratory and cardiovascular diseases,[6]
Severe intestinal upsets, keratosis and skin cancer in humans.[7]
This study assessed the levels of the heavy metals (chromium, nickel, aluminum, cadmium, zinc, copper, lead, mercury) in the liquid residue from the chemical analysis laboratory and the water from the autoclave of the microbiology laboratory.
The residue or liquid-waste from these laboratories of the Universidade do Algarve was tested with Atomic Absorption Spectroscopy (AAS) to characterize the various heavy metals found in them which could harm humans and the environment.
3
1.2 PROBLEM STATEMENT
The internally generated wastes are handled by laboratory staff being it solid or liquid. The solid waste are packaged, stored and later taken for treatment by waste companies. However, the liquid waste or residue should not be poured directly into the sink or drainage system, mostly from chemical analysis laboratories which may contain some heavy metals of importance.
In view of this there is the need to get a Standard Operating Procedures (SOP) that spells out as to what level of heavy metals in liquid waste that can be discarded down the drain and what should be stored in containers for the appropriate waste treatment companies.
1.3 OBJECTIVES OF THE STUDY
The main objective of the present study was to propose a programme for the control and disposal of wastes from microbiological and chemical analysis laboratories.
The specific objectives which contributed to achieve the main objectives of this research were:
1. To characterize the heavy metals in liquid waste from chemical analysis laboratories.
2. To identify the risk they pose to human and the environment and legal compliance with national and international guidelines.
3. To identify microbial risk in the liquid waste resulting from the autoclaves used for inactivation and sterilization.
4. To assess and evaluate the level of monitored elements similarities or differences from these laboratories with appropriate statistical tool.
4 CHAPTER TWO
LITERATURE SEARCH
2.1 HEAVY METALS
Heavy metals have been defined differently by many sectors of academia. Many different definitions have been proposed, some based on density, some on atomic weight and some on chemical properties or toxicity.[8] Heavy metals are natural components of the earth crust which cannot be degraded or destroyed .[9] Living organisms require varying amounts of some heavy metals. For example, iron, cobalt, copper, manganese, selenium, molybdenum and zinc are essential to human body.[8] Excessive levels, however, can be damaging to many organisms. Some heavy metals such as mercury, plutonium and lead are toxic metals that have no known vital or beneficial effect on organisms, and their accumulation over time in the bodies of animals can cause serious health problem.[10]
2.2 TOXICITY OF HEAVY METALS
Heightened concern for reduction in environmental pollution over the past decades has stimulated active continuing research and literature on the toxicology of heavy metals. Virtually all metals can produce toxicity when ingested in sufficient quantities, but there are several of them which are especially important because they produce toxicity at low concentrations.[11]
In general, heavy metals produce their toxicity in organisms by forming complexes or “ligands” with organic compounds.[12] These modified biological molecules lose their ability to function properly, and result in malfunction or death of the affected cells. Some heavy metals may form complexes with other materials in living organisms. These complexes may inactivate some important enzymes, systems and certain protein structures.[11]
The presence of heavy metals above a certain threshold can be injurious to human health and the environment.[13]
5
2.2.1 CHROMIUM
Water insoluble chromium (III) compounds and chromium metal are not considered a health hazard, while the toxicity and carcinogenic properties of chromium (VI) have been known for a long time. The acute toxicity of chromium (VI) is due to its strong oxidation properties. After it reaches the blood stream, it damages the kidneys, the liver and blood cells through oxidation reactions. Haemolysis, renal and liver failure are the results of these damages. [14]
Chromium (VI) compounds at low concentration are toxic for both plants and animals.[57]
2.2.2 NICKEL
The exposure to nickel metal should not exceed 0.05mg/cm3 per 40-hour work-week. Nickel sulfide fume and dust are believed to be carcinogenic, and various other nickel compounds may be as well. Sensitized individuals may show an allergy to nickel, affecting their skin, also known as dermatitis. Nickel was voted Allergen of the Year in 2008 by the American Contact Dermatitis Society.[15]
2.2.3 ALUMINIUM
Aluminium (Al) can be toxic to plants by inhibition of root growth on acid soils with increased concentration of toxic Al3+[51] . Aluminium toxicity has not been detected in grazing animals but plant growth, particularly growth of seedlings can be greatly harmed by high levels of exchangeable soil Al.[16] Excess Al may cause diseases in humans. It may hamper many metabolic processes especially turnover of calcium, phosphorus and iron. Salts of Al may bind to DNA, RNA, inhibit enzymes such as hexokinase, acid and alkaline phosphatases, phosphodiesterase and phosphooxydase. Aluminium salts are especially harmful to nervous, hematopoietic systems and to skeleton. Toxicity comes from
6
substitution of Mg2+ and Fe2+ ions effecting disturbances in intracellular signaling, excretory functions and cellular growth.[17]
Aluminium has also been linked to low erythropoietin production leading to anaemia in humans. Aluminium is also connected to nerve damage, and people with kidney damage are susceptible to Al toxicity. Increased Al intake may also cause osteomalacia (vitamin D and calcium deficits) and functional lung disorder inhumans.[18]
Regular Al concentrations in groundwater are about 0.4 ppm, because it is present in soils as water insoluble hydroxide. It naturally occurs in waters in very low concentrations due to its low solubility. Higher concentrations derived from mining waste may negatively affect aquatic biocoenosis. Aluminium is toxic to fish in acidic, un-buffered waters starting at a concentration of 0.1 mg/L.[18]
2.2.4 CADMIUM
The exposure to cadmium (Cd) and its compounds may occur in both occupational and environmental settings, the latter primarily via the diet and drinking water.[19] Acute oral exposure to 20-30 g of Cd has caused fatalities in humans. Exposure to lower amounts may cause gastrointestinal irritation, vomiting, abdominal pain and diarrhea.[20] Long term exposure to cadmium primarily affects the kidney, resulting in tubular proteinosis leading to renal toxicity.[21] Inhalation exposure to cadmium and its compounds may result in effects including headache , chest pains, muscular weakness, pulmonary edema, and death.[22]
An 8-hour time-weighted-average (TWA) exposure level of 5mg/m3 has been estimated for lethal effects of inhalation exposure to cadmium and exposure to 1 mg/m3 is considered to be immediately dangerous to human health.[24]
7
2.2.5 ZINC
Zinc is required for good health but excess of it can be harmful. High quantity of zinc suppresses copper and iron absorption. The free zinc ion in solution is highly toxic to plants, invertebrate and vertebrate fish. Levels of zinc in excess of 500ppm in soil interfere with the ability of plants to absorb other relevant metals, such as iron and manganese.
The U.S Food and Drug Administration (FDA) has stated that zinc damages nerve receptors in the nose, which may cause anosmia. Reports of anosmia were also observed in the 1930s when zinc preparations were used in a failed attempt to prevent polio infections.[25]
2.2.6 COPPER
One may be exposed to Cu by breathing air, eating food, or drinking water containing Cu as well as through skin contact with soil, water or other copper-containing substances. Copper is an essential element for living organisms, including humans, and small amounts are necessary in diets to ensure good health.[26] However, too much Cu can cause adverse health effects in humans, including vomiting, diarrhea, stomach cramps, nausea, irritation of skin, eyes and respiratory tract. Copper has also been associated with liver damage and kidney disease.[27]
The determination of heavy metals in the laboratory residues is of great interest, since their dangerous effects on the ecosystem and human depend on their dose and toxicity. Copper as one of the heavy metals is on one hand important for life but on the other hand, it is highly toxic for organisms like algae, fungi and many bacteria or viruses. Copper is suspected to cause infant liver damages.[28]
8
2.2.7 LEAD
Lead exposure can occur through inhalations, ingestion and dermal contact. Contaminated fruits and vegetables by high levels of lead, in the soil they were grown in, could be ingested.
Inhalation is the second major pathway of exposure, especially for workers in lead- related occupations such as chemical analysis laboratories.[29]
The rate of skin exposure may be significant for a narrow category of people working with organic lead compounds as compared with inorganic lead compounds. However, skin exposure is of little concern to the general population.[31]
Pb does not bioaccumulate in most organisms but accumulate in biota feeding basically on particles for example mussels and worms because Pb binds strongly to particles such as soils, sediment and sludge in the environment.[52]
2.2.8 MERCURY
Mercury (Hg) is a naturally occurring element existing in multiple forms and in various oxidation states. In the environment, Hg may undergo transformations among its various forms and among its oxidation states.[30] Organic forms of mercury compounds are particularly toxic. Mercury can combine with a methyl group to become methyl mercury and dimethylmercury which are bioaccumulative and volatile, respectively.[52] Organic mercury, especially methyl mercury, rapidly enters the central nervous system resulting in behavioral and neuromotor disorders. Exposure to organic mercury causes central nervous system effects, especially in the fetus and neonate.[32]
In the gastrointestinal tract, acute poisoning by mercury produces a sloughing away of the mucosa to an extent where pieces of the intestinal mucosa can be found in the stools. Mercury also breaks down barriers in the capillaries resulting in edema throughout the body. A range of neurological toxicities are also common.
9
These include lethargy and tremor.[11] Inhalation of mercury vapour may cause irritation of the respiratory tract, renal disorders, renal toxicity and death.[33]
2.2.9 IRON
The large amounts of ingested iron can cause excessive levels of iron in the blood. High blood levels of free ferrous iron react with peroxides to produce free radicals, which are highly reactive and can damage DNA, proteins, lipids and other cellular components. Free iron in the cell leads to iron toxicity which occurs when iron levels exceed the capacity of transferrin to bind the iron. Damage to the cells of the gastrointestinal tract can also prevent them from regulating iron absorption leading to further increases in blood levels.
Humans experience iron toxicity above 20 milligrams of iron for every kilogram of mass, and 60 milligrams per kilogram is considered a lethal dose. The Dietary Reference Intake (DRI) lists the Tolerate Upper Level (UL) for adults as 45mg/day and 40mg/day for children under fourteen years.[34]
Iron is important for nitrogen binding and nitrate reduction and may be a limiting factor for phytoplankton growth.[23]
2.2.10 ARSENIC
All types of arsenic exposure can cause kidney and liver damage, and in the most severe exposure there is erythrocyte haemolysis. It is found to cause skin and nail changes that is hyperkeratosis and hyperpigmentation; sensory and motor polyneuritis; hemolytic anemia; inflammation of respiratory mucosa; peripheral vascular insufficiency; elevated risk of skin cancer, and cancers of lung, liver, bladder, kidney and colon.[11]
Arsenic in the environment is found to be embryo toxic and teratogenic to rats and hamsters.[56]
10
2.3 LABORATORY WASTE
The Laboratory is a place where ideas, materials, processes and tools are used in a designed experiment(s) in achieving desired results. The left-over‟s after the experiments or the garbage produced is referred to us as waste, whether in the microbiology or chemical laboratory setting.
These wastes can be liquid or solid and if are properly handled and discarded there will be no or less effects to the environment and humans. There will be devastating effect to the environment and humans with time if they are not properly disposed by following an established procedure.
Good chemical hygiene and a safe workplace environment could be achieved when there is a proper segregation of laboratory waste according to the type and similar characteristics. [35, 36, 39]
2.3.1 Microbiology analysis laboratory waste
Microbiology laboratory is a place where biological samples are cultured under specific conditions on particular growth media to isolate microorganisms of interest(s).
This activity leads to generation of wastes which can be hazardous or non-hazardous waste.
The non-hazardous wastes are less dangerous when come in contact with human which are mainly the papers, used gloves, rubbers and so on.
The hazardous waste which falls under infectious medical waste usually consists on the used media in the culture plates and the microorganism‟s growth on them which require inactivation by autoclaving before discarding it into the public waste.[40,41]
11
2.3.2 Chemical analysis laboratory waste
Industrial wastes are products containing organic chemicals, hydrocarbons, halogenated hydrocarbons, alcohols and phenols, aldehydes and ketones, acidified solution or liquids with metals as examples.
Most of these wastes are stored in barrels or bottles for waste treatment companies, who come to collect periodically for removal and further treatment. The chemical wastes are collected periodically that is from “4 to 6” months by waste treatment companies, whilst the biological waste are collected based on the amount produced.[37]
2.3.3 Biomedical waste management
Biomedical waste refers to infectious materials produced as a result of diagnostics activities taken place at various medical laboratories such as microbiology laboratory. Among such products are needles, blood products, and used media. These medical wastes can be contaminated with hepatitis, HIV and other infectious diseases so if disposed of improperly may put sanitary workers as well as general public at risk of contracting dangerous diseases.[38]
12
Biomedical wastes are classified in groups as; a) Group I and II: Non-hazardous wastes.
b) Group III: Biological risk (Including wastes with blood and plates with cultured-media from microbiology laboratory)
c) Group IV: Specific waste.
Laboratory workers at post are involved in the weighing and labeling the waste with the appropriate sticker for a particular group. No pre-treatment are applied to the generated waste. Some laboratories use either yellow or green big dustbin for storing of the biomedical waste before collection by waste treatment companies.[44]
The treatment companies are involved in the usage of the 3Rs in their operations that is;
Reduction, Reutilization and Recycling.[45]
13
2.4 RESEARCH ON LABORATORY WASTE CONTROL AND DISPOSAL. 2.4.1 ISO 14001 Standard
ISO 14001 Environmental management systems- << Requirements with guidance for use is an international standard for the development of effective environmental management systems (EMS) applicable to all industry types. The original ISO 14001 standard was first released by the International Standards Organization (ISO) in Amsterdam, 1996>>. The management tool enables an organization to identify and control the environmental impact of its activities, product and services; to continuously improve its environmental performance; and to implement a systematic approach to set and achieve environmental objectives and targets.[42]
Also the organization benefits by minimizing the risk of regulatory and environmental liability fines and improving its efficiency, leading to a reduction in waste, consumption of resources and operating costs can be reduced.[42]
2.4.2 Inertization of acidified liquid waste with low heavy metals.
The inertization of acidified liquid waste containing heavy metals before disposal was proposed by some Italian Inventors in July 7, 1995 when they were researching on the topic;
„‟Innertization of liquid waste, mud and solid waste containing heavy metals by sulphate-reducing bacteria (SRB)‟‟, from which they have acquired a patent number US5660730 to buttress their claim.
14
They claim if the under-listed procedures are followed acidified liquid containing metals could be treated and discarded.
1. The process for the treatment of acidified liquid waste comprises neutralizing the liquid waste containing heavy metals to a pH of 7.5
2. The neutralization process is affected by calcium oxide.
3. The liquid is allowed to remain for some time and the metals will precipitate below the container.
4. The supernatant can be discarded, whilst the remaining metals residue are poured into polythene, sealed and added to the inactivated waste for collection by waste treatment companies.
Finally the process of the claim should produce a product which contains metals in amount of less than mg/L, shown below before discarding.
TABLE 1: Heavy metal amount in product HEAVY METAL (mg/L) Fe < 2 Cu < 0.1 Zn < 0.5 As < 0.5 Cd < 0.02 Ni < 2 Pb < 2 Cr < 0.2
In this process the action of anaerobic sulphate-reducing bacteria is to transform the ions of the sulphates and heavy metals, present in contaminated water and soil, into insoluble and inert sulphides.[43]
15
2.4.3 Heavy metal sorption.
This is a quite new approach which involves the use of specific microorganisms to absorb heavy metals in solution. If this procedure is well followed and the utilization of the appropriate microorganisms is under the scope of our laboratories, then some of the heavy metals tested to be above the reference ranges in the liquid waste can be reduced to the admissible level. Thus enabling us to discard it ourselves thereby reducing cost associated with waste treatment by external companies.
Heavy metal removal from aqueous solution has been widely reported in literature with this research work focusing on metal removal capacity of cultures of two capsulated, exopolysaccharide-producing cyanobacteria, Cyanospira
capsulate and Nostoc PCC 7936.This biosorption exploits the cell envelopes of
microorganisms to remove metals from water solution and a promising new method for the bioremoval of heavy metals.[53]
That is,<< Cyanospira capsulata and Nostoc PCC7936, were tested using copper (II) as the model metal. C. capsulata cultures removed the greatest amount of copper, with a maximum per unit of biomass (q max) of 115.0±5.1 mg copper g−1
of protein, compared with 85.0±3.2 removed with Nostoc PCC7936 cultures>>.[53]
16 CHAPTER THREE
MATERIALS AND METHODS
3.1 THE STUDY AREA
This study was done at the “Laboratório de Análises Quimicas (LAQ) in the Universidade do Algarve, during the period of September 2011 and March 2012. LAQ has both chemical and microbiology analyses section(s). Samples for the analysis were taken from both sections and other places visited. The other places visited were the Direção Regional de Saúde do Algarve (Directorate of Health-Algarve), Direção Regional de Agricultura do Algarve (Regional Directorate of Agriculture-Algarve), Laboratório de Análises Clínicas Drª Lurdes Rufino Ferreira (Clinical Analyses Laboratory, Dra Maria Lurdes Rufino Ferreira) and Microbiology laboratory at building-8 in the Universidade do Algarve – Faculdade de Ciências e Tecnología.
3.1.1 Waste disposal at LAQ in the Algarve University
LAQ is the Laboratório de Análises Quimicas (Laboratory for Chemical Analysis) where various analytical tests are performed on samples such as water and soil daily leading to generation of liquid and solid waste.
The liquid wastes are stored in plastic bottles or gallons for collection by the treatment companies.
The solid wastes are put into well labeled dustbins with the international biohazard sticker on them.
17
3.1.2 Application of statistical methods for the evaluation and assessing the levels of the heavy metals.
The Excel tool or programme will be the statistical tool for evaluating and assessing the content of these heavy metals in the acidified waste solution from the laboratories.
However, the values obtained will be compared to an internationally accepted normal or reference values.
3.2 EQUIPMENT AND SUPPLIES
Laminar flow fan – Kojar KR – 125 Safety; Vilpopule, Finland.
Refrigerator – Fagor Elegance double fresh; Carnaxide, Portugal.
Incubator (250C) – MMM Medcenter Incucell; Munich, Germany.
Incubator (36oC)-MMM Medcenter Incucell; Munich, Germany.
Measuring glass cylinder ( 100mL ± 0.5mL)
Autoclave, Systech H-Series, Germany.
Atomic Absorption Spectrometer, Perkin –Elmer AA Spectrometers AA 8000, U.S.A.
Ellix 3 , Millipore (deionised) Progard 2,USA
Simplicity , Millipore , Simpak 1,USA
Plastic sterile sampling containers (100mL)
Plastic sterile sampling containers (50mL)
Heating Plate/ Mantle
Analytical weighing balance (Chemical balance).
Micropipette (Eppendorf 5mL ± 0.01mL)
Disposable Petri dishes
18
3.3 REAGENTS AND MEDIA
Plate Count Agar (PCA) from Scharlau Chemical S.A, Spain.
Potato Dextrose Agar (PDA) from Scharlau Chemical S.A, Spain.
Distilled water
Milli-Q water (Ultra-Pure)
Concentrated Nitric Acid (65%, 1.42g/mL) from Merck-Germany, Atomic Absorption Grade.
Standard solution of 1000mg/L for each metal, Merck, Germany
3.4 SAMPLE COLLECTION AND PREPARATION
3.4.1 Liquid waste sampling and preparation from Chemical analysis laboratory Twelve sterile 50mL sampling bottles were used to take liquid waste residues from the chemical analyses laboratories. Eight of the sampling bottles were used to take duplicate samples from different gallons with stored liquid residue at LAQ. The remaining four bottles were used to take samples from chemical analyses unit at the Direção Regional de Agricultura do Algarve.
Acid digestion was performed on all the samples of 50mLs each by adding 5mL of concentrated nitric acid of 65% purity, in order to allow metals absorbed to the walls of the sample bottles to precipitate or to solubilise.
The samples were stored at room temperature (250C) and well covered with their lids to avoid evaporation since the volume is of importance.
The heavy metals levels in these samples were then determined with the Atomic Absorption Spectrometer (AAS).
19
3.4.2 Liquid waste sampling and preparation from Microbiology laboratory
Water samples were taken from two autoclaves. One was used for media and reagents sterilization and the second one for materials and culture inactivation. Therefore the names for the samples from these autoclaves are;
1. Autoclave Sterilization sample (ASS). 2. Autoclave Inactivation sample (AIS).
Twenty-four sterile 100mL sampling bottles were used to collect samples from the microbiology laboratory at LAQ and Building-8.Twelve were used to collect ASS and the remaining twelve for AIS for the microbiological analyses.
Another ten sterile 50mL sampling bottles were used to collect five samples each of ASS and AIS, which were used for the heavy metal analyses. 5mL of acidified water (0.2% HNO3) was added to each sample prior to the analyses.
3.4.3 Standard sample solution preparation
A composite standard solution of all the elements under-study (Cr, Ni, Al, Cd, Zn, Cu, Pb, Hg , As, Fe) was prepared of concentration 100ppm in a 250mL volumetric flask. 25mL each of the individual elements standards obtained from Merck, Germany were pipette into the 250mL volumetric flask and was filled to the 250mL mark with 0.2% HNO3(V/V).
Five different standards of concentrations of 10ppm, 5ppm, 1ppm, 0.5ppm, 0.1ppm were prepared for all the elements from their composite standard solution which was used to prepare the calibration curve.
The calculations done to prepare the standard solution and the exact volume of the composite standard solution taken are as follows;
20
a) Composite Standard Solution (100ppm)
From the relation C1 x V1 = C2 x V2………(1)
V1= (100ppm x 250mL)/1000ppm
V1 = 25mL
Therefore 25mL of each of the heavy metal standards will be measured into the 250mL volumetric flask to form the Composite Standard Solution.
b) Standard Solution 1 (SS-1) of 10ppm will be prepared by measuring 5mL with a pipette from the Composite standard solution into a 50mL volumetric flask and diluted to the mark with 0.2% HNO3 (Acidified water).
That is from the relation (1) above the Volume to be measured can be calculated as;
V1= ( 10 ppm x 50mL)/100ppm
V1 = 5mL
c) For SS-2 of 5ppm will be prepared by measuring 2.5mL with a pipette from the Composite Standard Solution into a 50 mL volumetric flask and dilute to the mark with 0.2% HNO3 (Acidified water).
That is from the relation (1) above the Volume to be measured can be calculated as;
V1 = (5 ppm x 50mL)/100ppm
V1 = 2.5mL
The same procedure will be used in getting the required volumes of 0.5mL, 0.25mL, 0.05mL for preparing SS-3, SS-4 and SS-5 respectively.
21
Furthermore, the standards of these metals were prepared from their stock standard solution at the following concentrations ranges; [ 0.5,1,5,10]mg/L were used for Pb, Ni and Cr , whilst [0.1,0.5,1,5]mg/L were used for Cd, Cu and Zn. For Fe [5, 10, 15] mg/L was used and [50,100,200] µg/L used for Al.
For As the concentration ranges were [ 20,30,40,50,60] µg /L and Hg was [5,10,15,20,25] µg/L.
Al, Hg and As sample results were converted to mg/L since the standards were in µg /L.
Chemical samples were diluted for Al, Hg and As before they could be detected. Al chemical samples were diluted 40 times whilst a dilution factor of 200 was used for Hg and As.
These dilution factors were considered in the calculation(s) before getting the final concentration in the samples.
22
3.5 ATOMIC ABSORPTION SPECTROMETRY ANALYSIS (TECHNIQUE) The samples and standards were analyzed with the Atomic Absorption Spectrometer (AAS) at LAQ of the Universidade do Algarve.
Atomic Absorption process involves giving a light energy to a “ground state” atom for it to enter the “excited state”. The “ground state” atom absorbs light energy of a specific wavelength as it enters the “excited state”. Whilst the number of atoms in the light path increases, the amount of light absorbed also increases. By measuring the amount of light absorbed, a quantitative determination of the amount of analyte can be made, based on the Lambert-Beer Law.
The careful selection of wavelengths allows the specific determination of individual elements. The AAS involves two techniques that is the Flame and Furnace, which can be used to analyze the heavy metals of interest(s).
For the purpose of this study, the Flame technique will be used for the analyses of Cd, Cu, Zn, Fe, Pb, Cr, Ni, whilst Furnace will be used for the analyses of Al for easy detection of the said element(s).
However, hydride generation and cold vapour procedures will be employed in the analysis of As and Hg, respectively.[46]
23
3.5.1 Instrument calibration
Quantitative measurements in atomic absorption are based on Lambert-Beer Law which states that the concentration is proportional to absorbance. However, for most elements, particularly at high concentration, their absorbance does not follow Beer‟s Law and it becomes nonlinear. Several reasons accounts for this which includes: stray light, non-homogeneities of temperature and space in the absorbing cell, line broadening, and absorption at nearby lines. The introduction of microprocessors into atomic absorption instrument has made automatic curve correction a reality.
The equation used in the zero intercept linear calibration method is; c = Ko ( - K1 A )
A least squares technique is used to determine the K1 coefficient when two or
more standards (maximum = 8) are used for calibration. K0 is the re-slope
coefficient which is set to 1.0 during initial calibration.[46]
24
3.5.2 Precision, Sensitivity and Detection limit of the AAS
The AAS has a higher precision, higher sensitivity and lower detection limits. However, the precision can be improved by using longer integration times, up to a maximum of roughly 10 seconds. Integration times longer than 10 seconds provide no further improvement and are not generally recommended.
Characteristic concentration in atomic absorption also known as „‟Sensitivity” is defined as the concentration of an element (in mg/L) required to produce a signal of 1% absorption (0.0044 absorbance units).
Characteristic Concentration = [Conc. of Std x 0.0044] / measured Abs. Furthermore, to determine whether instrumental parameters was optimized and whether the instrument is performing up to specifications the characteristic concentration check values should be employed.
The detection limit is defined as the concentration of the element which will produce a signal/ noise ratio of 3.
Detection Limit = [Standard conc. x 3 Std Dev] / Mean
It is important to remember that characteristic concentration express the size of the absorption signal, the detection limit considers both the signal amplitude and the baseline noise.
Routine analytical measurements at the detection limit are difficult because, noise makes up a significant percentage of the total measurable signal. The precision obtained at detection limit levels is ± 33% when a 3-standard-deviation criterion is used.[46]
25
3.6 SAMPLING FROM MICROBIOLOGY LABORATORY 3.6.1 Media preparation
Plate Count Agar (PCA) and Potato Dextrose Agar (PDA) were the two media prepared for the microbial enumeration. The following procedures were followed in preparing 200 mL of each;
i. 4.7g of PCA and 8.4g of PDA were weighed with an analytical balance into a separate 250mL Schott glass bottle.
ii. 200mL of distilled water was measured with a measuring cylinder and added to each bottle.
iii. The mixture was dissolved by shaking and swirling the bottles. iv. An electric heating plate was used to bring the mixture to boil. v. The mixture was sterilized by autoclaving at 1210C for 15 minutes. vi. Allowed to cool before using for incorporation technique.
26
3.6.2 Microbial growth
Bacteria and Fungi growth were evaluated as described in the procedure below;
Incorporation technique is a process which involves mixing the required sample with an amount of the prepared media in a sterile Petri-dish by gently shaking with a push and pull movements before leaving the media to solidify.[ 36;47 ] 15mLs each of the PCA media was poured into plastic sterile Petri-dishes already containing 1mL of the samples (AIS and ASS) collected from the microbiology laboratories. Twelve bottles were used for the PCA media where six of them were containing the AIS-Sample and the other six containing ASS-Sample. The media and the sample were mixed by gently shaking the Petri-dishes and were left to solidify.
It was then incubated for 24 and 48 hours respectively at 36oC. The same procedure were repeated for the PDA media but was incubated at 250C.
However, Bacteria and Fungi are the microorganisms that are commonly inactivated. Among the Bacteria were: Escherichia, Pseudomonas, Proteus,
Klebsiella, Streptococcus, Staphylococcus, Salmonella, Micrococcus and Xanthomonas. The Fungi were Penicillium, Aspergillus, Saccharomyces, Cladosporium, Mucor and Animal cells.
27 CHAPTER FOUR
RESULTS AND DISCUSSION
4.1 QUALITY CONTROL FOR MICROBIAL GROWTH
4.1.2 Viable counting of autoclave inactivation sample (AIS – sample) and autoclave sterilization sample (ASS-sample) from autoclaves of microbiology laboratories.
TABLE 2: Results from Microbiology Laboratory Samples TYPE OF MEDIA NUMBER OF PLATES TEMPERATURE OF INCUBATION GROWTH AFTER 24HOURS FOR EACH TEST GROWTH AFTER 48 HOURS FOR EACH TEST
PDA 12 25±10C No growth No growth PCA 12 36± 10C No growth No growth
Table 2: Shows the same results of no growth for all the plates of PDA and PCA cultured.
12: Means 12 Petri dishes (plates) were used for each test. PDA: Potato Dextrose Agar
PCA: Plate Count Agar
28
4.1.3 Microbiological evaluation of inactivated and sterile autoclave sample One objective of this study was to establish whether; mesophiles that are microorganisms that grow best in moderate temperature, fungi and spores that could exist in the liquid waste of the autoclaves after sterilization and inactivation processes, if the process was not properly run.
However, bacteria and fungi are the microorganisms that are commonly inactivated under the autoclaving conditions. Among the bacteria that were manipulated in the laboratories under this study was: Escherichia, Pseudomonas,
Proteus, Klebsiella, Streptococcus, Staphylococcus, Salmonella, Micrococcus and Xanthomonas. The fungi were Penicillium, Aspergillus, Saccharomyces, Cladosporium, Mucor and animal cells.
The PCA and PDA culture results presented in Table 4 showed no growth after 24 and 48 hours incubation, respectively, indicating that the liquid waste in the two autoclaves used for this study could be discarded to the public drainage system with no contamination.
29
4.2 CALIBRATION CURVES FOR HEAVY METALS
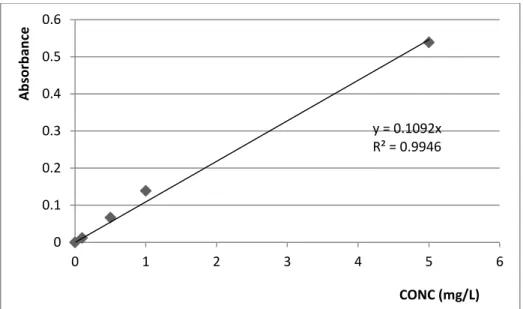
Figures 1 to 10 below show Calibration curves for Cr, Zn, Ni, Cu, Cd, Pb, Fe, Al, As, Hg, respectively. Their equations were all significant for all the metals indicating that the calibration of the AAS for detecting the specific element was properly done. Also linear graphs were obtained for all showing Absorbance against concentration of the prepared standards of each heavy metal.
Figure 1: Calibration curve for Cr
y = 0.0186x R² = 0.9989 0 0.02 0.04 0.06 0.08 0.1 0.12 0.14 0.16 0.18 0.2 0 2 4 6 8 10 12 A b sor b an ce Conc (mg/L)
30
Figure 2: Calibration curve for Zn
Figure 3: Calibration curve for Ni
y = 0.1092x R² = 0.9946 0 0.1 0.2 0.3 0.4 0.5 0.6 0 1 2 3 4 5 6 A b sor b an ce CONC (mg/L) y = 0.0303x R² = 1 0 0.05 0.1 0.15 0.2 0.25 0.3 0.35 0 2 4 6 8 10 12 A b sor b anc e Conc (mg/L)
31
Figure 4: Calibration curve for Cu
Figure 5: Calibration curve for Cd
y = 0.0515x R² = 0.9999 0 0.05 0.1 0.15 0.2 0.25 0.3 0 1 2 3 4 5 6 A b sor b an ce Conc (mg/L) y = 11.012x R² = 0.9936 0 1 2 3 4 5 6 0 0.1 0.2 0.3 0.4 0.5 A b sor b an ce Conc (mg/L)
32
Figure 6: Calibration curve for Pb
Figure 7: Calibration curve for Fe
y = 110.24x R² = 0.9997 0 2 4 6 8 10 12 0 0.02 0.04 0.06 0.08 0.1 A b sor b an ce Conc (mg/L) y = 0.0425x R² = 0.9934 0 0.1 0.2 0.3 0.4 0.5 0.6 0.7 0 5 10 15 20 A b sor b an ce Conc (mg/L)
33
Figure 8: Calibration curve for Al
Figure 9: Calibration curve for As
y = 0.0035x R² = 0.9921 0 0.1 0.2 0.3 0.4 0.5 0.6 0.7 0.8 0 50 100 150 200 250 A b sor b an ce Conc (mg/L) y = 0.0011x R² = 0.9881 0 0.01 0.02 0.03 0.04 0.05 0.06 0.07 0.08 0 10 20 30 40 50 60 70 A b sor b an ce Conc (mg/L)
34
Figure 10: Calibration curve for Hg
y = 0.0011x R² = 0.9881 0 0.01 0.02 0.03 0.04 0.05 0.06 0.07 0.08 0 10 20 30 40 50 60 70 A b sor b an ce Conc (mg/L)
35 4.3 QUALITY CONTROL REFERENCE RANGE FOR HEAVY METALS ANALYSIS Table 3 Summarizes guidelines for industrial waste water from a Portuguese and an American authority.
TABLE 3: Maximum Admissible values for parameters in industrial water residuals [mg/L]. PARAMETER NATIONAL - PORTUGAL INTERNATIONAL Faro City (Fagar) * ** CANADA *** BRAZIL *** ARGENTINA *** Lead (Pb) 0.5 1.0 1 1.5 0.5 Nickle (Ni) 2.0 2.0 - - - Copper (Cu) 1.0 1.0 2 1.5 - Zinc (Zn) 5.0 - 2 5 - Chromium III (Cr-III) 2.0 2.0 - - - Iron (Fe) 2.5 2.0 - - - Cadmium (Cd) - 0.2 0.7 1.5 - Aluminium (Al) - 10 - - - Arsenic (As) 0.5 1.0 1 1.5 0.5 Mercury (Hg) - 0.05 0.01 1.5 0.005
* Reference values for waste treatment companies (2001) [48] **
Portuguese Law 236/98 [50]
***
Wastewater discharge standards in three American countries [54, 55, 49]
36
Table 3 above shows the maximum admissible values for parameters in industrial water residuals, with the local enterprise (Fagar) having a stricter regulation for Pb and As whilst having a less strict regulation for Fe as compared to the national (Portuguese) regulations. In comparing the maximum admissible values for the three American countries, Brazil showed a high value of 1.5mg/L for Pb, Cd, As and Hg respectively, with Canada also showing a high value of 2mg/L for Cu. Brazil presents less strict rules so far as the wastewater discharge standards are concerned in the three American countries.
37
4.4 HEAVY METAL LEVELS IN THE STUDIED SAMPLES
The following bar graphs show the results obtained for the evaluation of heavy metals levels in the studied samples.
4.4.1 Heavy metals levels in Microbiology samples (m.s).
The following bar graphs show the results obtained for the evaluation of heavy metals levels in the studied samples.
Figure 11: Pb conc. in Microbiology laboratory samples
All the Pb values obtained in the microbiology samples, shown in Fig.11 were below the local and national reference Maximum Admissible values of 0.5 and 1.0 respectively in (Table 3). 0 0.05 0.1 0.15 0.2 0.25 0.3 0.35 0.4 1 2 3 4 5 6 7 8 9 10 CON C(m g/ L) SAMPLES Pb
38
Figure 12: Cu conc. in Microbiology laboratory samples
All the Cu values were below local and national reference Maximum Admissible values of 1.0 mg/L.
Figure 13: Zn conc. in Microbiology laboratory samples
The values obtained for zinc were all below the Local value of 5.0mg/L.
0 0.05 0.1 0.15 0.2 0.25 0.3 0.35 0.4 1 2 3 4 5 6 7 8 9 10 CON C(m g/ L) SAMPLES Cu 0 0.05 0.1 0.15 0.2 0.25 0.3 1 2 3 4 5 6 7 8 9 10 CON C(m g/ L) SAMPLES Zn
39
Figure 14: Cr conc. in Microbiology laboratory samples
The local and national maximum admissible value for Cr is 2.0mg/L and all the obtained values in the microbiology samples (Fig 14) were below this value.
Figure 15: Cd conc. in Microbiology laboratory samples
All the values obtained for Cd were below the national value of 0.2mg/L.
0 0.01 0.02 0.03 0.04 0.05 0.06 1 2 3 4 5 6 7 8 9 10 CON C(m g/ L) SAMPLES Cr 0 0.0005 0.001 0.0015 0.002 0.0025 1 2 3 4 5 6 7 8 9 10 CON C(m g/ L) SAMPLES Cd
40
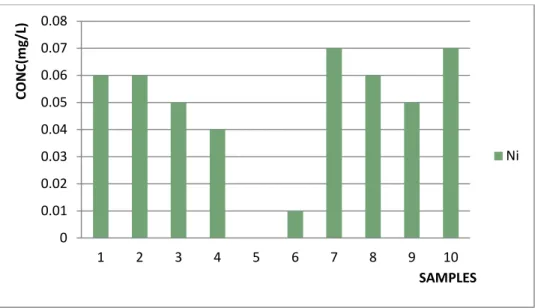
Figure 16: Ni conc. in Microbiology laboratory samples
The Ni levels obtained in the microbiology samples were all below the local and national maximum admissible value of 2mg/L.
Figure 17: Fe conc. in Microbiology laboratory samples
The Fe levels in fig.17 shows that sample 1 to 7 values were below the local and national values of 2.5 and 2.0mg/L respectively whilst in samples 8,9 and 10 it was recorded higher levels of 4.5,4.8,5.0 mg/L respectively.
0 0.01 0.02 0.03 0.04 0.05 0.06 0.07 0.08 1 2 3 4 5 6 7 8 9 10 CON C(m g/ L) SAMPLES Ni 0 1 2 3 4 5 6 1 2 3 4 5 6 7 8 9 10 CON C(m g/ L) SAMPLES Fe
41
Figure 18: As conc. in Microbiology laboratory samples
All the As levels in the microbiology samples (Fig.18) were lower than the local and national maximum admissible values of 0.5 and 1.0mg/L respectively.
Figure 19: Hg conc. in Microbiology laboratory samples
The Hg levels in the microbiology samples were all below the known maximum admissible values for the national.
0 0.005 0.01 0.015 0.02 0.025 0.03 0.035 1 2 3 4 5 6 7 8 9 10 C ON C (m g/ L) SAMPLES As 0 0.0002 0.0004 0.0006 0.0008 0.001 0.0012 1 2 3 4 5 6 7 8 9 10 CON C(m g/ L) SAMPLES Hg
42
Figure 20: Al conc. in Microbiology laboratory samples
The Al levels in fig.20 were all below the national values found on Table 3. Figure 11 to 20 shows the levels of heavy metal in individual microbiology samples (M.S). In all the samples Pb, Zn, Cr, Ni, As, Hg, Al levels were all found to be lower than the local and national admissible values (Table 3). However, Fe levels in sample 8,9,10 (Fig. 17) were found to be 4.5, 4.8, 5.0mg/L. These values were higher than the local and national values of 2.5 and 2.0mg/L respectively.
0 0.02 0.04 0.06 0.08 0.1 0.12 0.14 0.16 1 2 3 4 5 6 7 8 9 10 CON C(m g/ L) SAMPLES Al
43
4.4.2 Heavy metals levels in Chemical samples (c.s)
Samples 1-4 were collected at the laboratory of the Direção Regional de
Agricultura do Algarve (DRAAL) and samples 5-12 were from Laboratório de Análises Químicas (LAQ) – Universidade do Algarve.
Figure 21: Pb conc. in Chemical laboratories samples
The Pb values in fig.21 were all below the local and national values of 0.5 and 1.0mg/L.
Figure 22: Cu conc. in Chemical laboratories samples
The Cu levels in fig 22 showed values lower than the local and national value of 1.0mg/L. 0 0.05 0.1 0.15 0.2 0.25 0.3 0.35 0.4 0.45 1 2 3 4 5 6 7 8 9 10 11 12 CON C(m g/ L) SAMPLES Pb 0 0.05 0.1 0.15 0.2 0.25 0.3 0.35 0.4 0.45 1 2 3 4 5 6 7 8 9 10 11 12 CON C(m g/ L) SAMPLES Cu
44
Figure 23: Zn conc. in Chemical laboratories samples
The zinc values obtained from the samples in Fig.23 were below the local value of 5.0mg/L for sample 1 to 11 except sample 12 which was 10.29mg/L.
Figure 24: Cr conc. in Chemical laboratories samples
The Cr levels in the chemical samples are all below local and national value of 2.0mg/L. 0 2 4 6 8 10 12 1 2 3 4 5 6 7 8 9 10 11 12 CON C(m g/ L) SAMPLES Zn 0 0.02 0.04 0.06 0.08 0.1 0.12 0.14 0.16 0.18 1 2 3 4 5 6 7 8 9 10 11 12 CON C(m g/ L) SAMPLES Cr
45
Figure 25: Cd conc. in Chemical laboratories samples
All the values obtained for Cd in the chemical samples in fig.25 were below the national value of 0.2mg/L.
Figure 26: Ni conc. in Chemical laboratories samples
The Ni levels in the chemical samples were all below the local and national values of 2.0mg/L. 0 0.0005 0.001 0.0015 0.002 0.0025 0.003 0.0035 0.004 0.0045 1 2 3 4 5 6 7 8 9 10 11 12 C ON C (m g/ L) SAMPLES Cd 0 0.05 0.1 0.15 0.2 0.25 0.3 0.35 0.4 0.45 0.5 1 2 3 4 5 6 7 8 9 10 11 12 CON C(m g/ L) SAMPLES Ni
46
Figure 27: Fe conc. in Chemical laboratories samples
All the samples in Fig.27 showed higher Fe levels ranging from the lowest value of 2.9mg/L to the highest value of 53.5mg/L of which all are higher than the local and national values 2.5 and 2.0mg/L respectively.
Figure 28: As conc. in Chemical laboratories samples
All the As levels in the chemical samples were higher than the local and national values of 0.5 and 1.0mg/L respectively, with the lowest and highest values of 2.2mg/L and 13.4mg/L respectively. 0 10 20 30 40 50 60 1 2 3 4 5 6 7 8 9 10 11 CON C(m g/ L) SAMPLES Fe 0 2 4 6 8 10 12 14 16 1 2 3 4 5 6 7 8 9 10 11 12 CON C(m g/ L) SAMPLES As
47
Figure 29: Hg conc. in Chemical laboratories samples
All the Hg values of the chemical samples are higher than the national values. Sample 2-4 from DRAL showed Hg levels which are higher than those obtained from LAQ samples.
Figure 30: Al conc. in Chemical laboratories samples
Sample 1,3,6,7,10,11,12 showed Al levels which are lower than the national value of 10mg/L. However sample 2, 4,5,8,9 all showed values higher than the national value. 0 0.2 0.4 0.6 0.8 1 1.2 1 2 3 4 5 6 7 8 9 10 11 12 CON C(m g/ L) SAMPLES Hg 0 50 100 150 200 250 300 350 1 2 3 4 5 6 7 8 9 10 11 12 CON C(m g/ L) SAMPLES Al
48
Figures 21 to 30 shows the levels of heavy metals in each chemical sample (C.S). Cu, Zn, Cr, Cd and Ni levels in all the chemical samples were found to be lower than the local and national values shown in Table 3. Pb levels (Fig.21) were below the local and national values of 0.5 and 1.0mg/L. Fe and As values were all higher than the local and national values for this parameter. Hg values were all higher than the national values in Table 3.
4.4.3 Mean, maximum / minimum concentration values obtained and relation to acceptable levels of disposal
The total number of samples used for heavy metal analysis were 22 consisting of 10 microbiology samples and 12 chemical samples. The AAS value of each heavy metal in each sample was the mean representation of three replicates tested on that sample. The results were entered into an excel file, grouped into microbiology (M) and chemical(C) results.
The obtained results were compared with the Maximum admissible values from the local enterprise Fagar and the National Portuguese law 236/98. However we could not obtain data from other laboratories to compare with our results.
Tables 4 and 5 below shows the results obtained for the evaluation of heavy metals levels in the studied samples.