Universidade do Algarve
Faculdade de Ciências e Tecnologia
Emboli detection
in Middle Cerebral Artery using
Continuous Wavelet Transform
Ivo Manuel Belchior Gonçalves
Universidade do Algarve
Faculdade de Ciências e Tecnologia
Emboli detection
in Middle Cerebral Artery using
Continuous Wavelet Transform
Ivo Manuel Belchior Gonçalves
Supervisors
Prof
a. Doutora Isabel Leiria
Prof
a. Doutora Margarida Madeira e Moura
Masters in Electronics and Telecommunications Engineering
2011
Don’t you wonder maybe If you took a left turn Instead of taking a right You could be somebody different
Resumo
O ultrassom Doppler é uma técnica comum de aquisição de dados não-invasiva para ajuda em análise e diagnóstico clínico. De entre as aplicações ao estudo do fluxo sanguíneo inclui-se a detecção e caracterização de embolias.
Neste contexto foi realizado um estudo comparativo entre métodos de estima-ção espectral na detecestima-ção de eventos embólicos em sinais de fluxo sanguíneo em artéria cerebral média. A comparação é feita entre a Short-Time Fourier
Trans-form e a Continuous Wavelet TransTrans-form, sendo que o primeira é apresentado como
método clássico e amplamente discutido e o segundo surge como alternativa pro-missora tendo em conta as suas características, nomeadamente no processamento de sinais não-estacionários.
Aos sinais estudados, gerados a partir de um simulador, foram adicionados eventos embólicos simulados com características conhecidas, como duração, lo-calização e potência. O método clássico foi configurado de forma a obter resul-tados de referência para comparação, sendo que o método alternativo em estudo foi utilizado com diferentes configurações possibilitando uma análise mais abran-gente à sua utilização. A análise aos resultados de cada método foi feita com base em contagem de falsos negativos, falsos positivos e sensibilidade.
Os resultados mostram que a CWT permite obter melhor percentagem de de-tecção de eventos embólicos do que a STFT, tendo todas as configurações estuda-das para a CWT demonstrado melhores resultados que a STFT. Diferenças entre os resultados para a CWT permitem aferir sobre a melhor configuração de entre as apresentadas para optimização dos resultados, sendo a baseada na Mexican Hat a que apresenta os melhores resultados.
Abstract
Doppler ultrasound is a common non-invasive technique for data acquisition for assistance in clinical analysis and diagnosis. Amongst the clinical applications to blood flow is the detection and characterization of emboli.
In this context it was made a comparative study between spectral estimation methods in detection of embolic events in middle cerebral artery blood flow sig-nal. The comparison is made between the Short-Time Fourier Transform and the Continuous Wavelet Transform, whereas the former is the classical and widely discussed method and the latter appears as promising alternative given the known characteristics, such as for non-stationary signal processing.
To the signals studied, generated using a simulator, it were added simulated embolic events with known characteristics, like duration, localization and power. The classical method was configured in order to obtain reference results for com-parison, whereas the alternative method studied was used with multiple configu-rations, enabling a richer study on the parameters variation. The analysis to the results obtained for each method was made in terms of false negatives, false posi-tives and sensitivity.
The results show that CWT, presented as alternative methods, allows a better embolic events detection rate than STFT, the classical method. All CWT config-urations studied demonstrate better results than STFT. Differences in the results for CWT allow to draw conclusions about the best configuration, among the ones studied, for results optimization, being that the configuration based on Mexican Hat is the one which presents overall better results.
Contents
1 Introduction 1 1.1 Objectives . . . 2 1.2 Thesis outline . . . 2 1.3 Contributions . . . 3 2 Background 4 2.1 Introduction . . . 4 2.2 Doppler ultrasound . . . 4 2.2.1 Doppler effect . . . 52.2.2 Doppler ultrasound instrumentation . . . 6
2.2.3 Transcranial Doppler . . . 7
2.3 Embolic events . . . 8
2.3.1 Wang and Fish simulator . . . 9
2.3.2 Measured embolic power . . . 11
2.4 Signal processing methods . . . 11
2.4.1 Overview . . . 11 2.4.2 Fourier transform . . . 12 2.4.3 Wavelet transform . . . 13 2.4.4 Wavelet families . . . 15 2.5 Relevant metrics . . . 17 2.5.1 Spectral parameters . . . 17
2.5.2 Embolus to blood ratio . . . 18
2.5.3 Sensitivity and specificity . . . 19
3 Materials and methods 20
3.1 Introduction . . . 20
3.2 MCA signal simulation . . . 20
3.3 Addition of embolic events . . . 21
3.4 Spectral estimation . . . 23
3.4.1 Short-time Fourier transform . . . 24
3.4.2 Continuous wavelet transform . . . 25
3.4.3 Spectral parameters . . . 27
3.5 Detection assessment . . . 28
3.6 Framework block diagram . . . 29
3.7 Conclusions . . . 32
4 Results and discussion 33 4.1 Introduction . . . 33
4.2 Configuration of particular settings . . . 33
4.2.1 Framework settings . . . 33 4.2.2 Case set-up . . . 34 4.3 Results . . . 35 4.4 Discussion . . . 37 4.5 Conclusions . . . 41 5 Conclusion 42 5.1 General conclusion . . . 42 5.2 Future work . . . 44 References 45
List of Figures
2.1 Ultrasonic transducer emitting waves towards blood particles flow-ing in a blood vessel (adapted) [Azhari, 2010, chap. 11] . . . 6 2.2 MCA signal reference curves for (a) maximum frequency, (b)
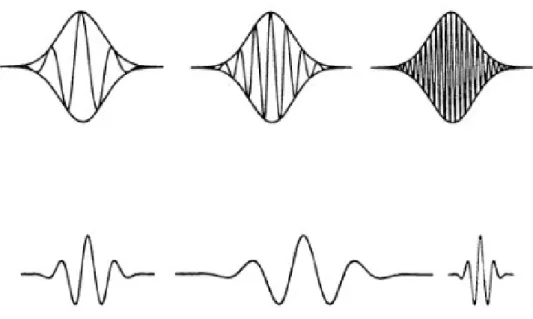
mean frequency, c) power variation over time and (c) bandwidth . 10 2.3 Top: using STFT, given that the window is fixed, low frequencies
are not detectable for a small window, while using a large window might cause lost of information for brief frequency changes. Bot-tom: A mother-wavelet (left) is stretched (middle) or compressed (right) to change the size of the window, enabling to analyse a signal at different scales [Hubbard, 1998, p. 29] . . . 13 2.4 a) Haar, b) Morlet, c) Mexican Hat and d) Gaussian (order 4)
mother wavelet functions . . . 16 3.1 Simulated MCA blood flow signal without emboli . . . 21 3.2 Simulated MCA blood flow signal with added 7.5 dB MEP emboli 23 3.3 Time-frequency representation of MCA blood flow signal without
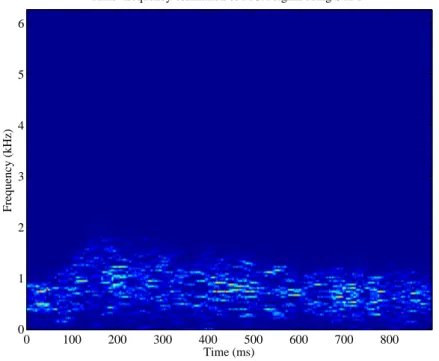
emboli using STFT . . . 24 3.4 Time-frequency representation of MCA blood flow signal with 7.5
dB MEP emboli using STFT . . . 25 3.5 Time-frequency representation of MCA blood flow signal without
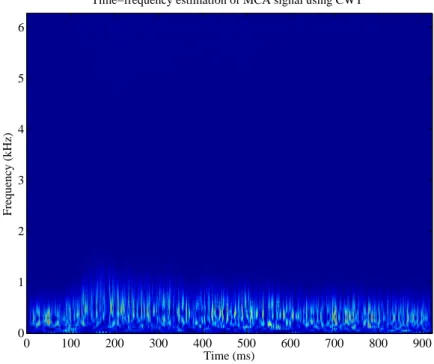
emboli using CWT and a Morlet mother-wavelet function . . . 26 3.6 Time-frequency representation of MCA blood flow signal with 7.5
3.7 EBR measured using STFT with 20 ms window, 50% overlap and 3.5 dB threshold value for emboli added of 7.5 dB. Emboli areas signalled in red and emboli detection areas in green. . . 29 3.8 EBR measured using Morlet-based CWT with 20 ms window,
50% overlap and 2 dB threshold value for emboli added of 7.5 dB. Emboli areas signalled in red and emboli detection areas in green. . . 30 3.9 Framework implementation block diagram . . . 31 4.1 Global sensitivity chart for all configurations tested . . . 41
List of Tables
4.1 False negative and false positive emboli detection counts for
Mor-let waveMor-let using a 2 dB threshold . . . 35
4.2 False negative and false positive emboli detection counts for Mex-ican Hat wavelet using a 2 dB threshold . . . 35
4.3 False negative and false positive emboli detection counts for Meyer wavelet using a 2 dB threshold . . . 36
4.4 False negative and false positive emboli detection counts for Gaus-sian (order 4) wavelet using a 2 dB threshold . . . 36
4.5 False negative and false positive emboli detection counts for Daubechies (order 4) wavelet using a 2 dB threshold . . . 36
4.6 False negative and false positive emboli detection counts for Daubechies (order 8) wavelet using a 2 dB threshold . . . 36
4.7 False negatives and false positives emboli detection counts for STFT using a 3.5 dB threshold . . . 37
4.8 Sensitivity for Mexican Hat wavelet results . . . 38
4.9 Sensitivity for Gaussian (order 4) wavelet results . . . 38
4.10 Sensitivity for Daubechies (order 4) wavelet results . . . 38
Acronyms
CWD Continuous Wave Doppler
CWT Continuous Wavelet Transform
DWT Discrete Wavelet Transform
EBR Embolus to Blood Ratio
FT Fourier Transform
MCA Middle Cerebral Artery
MEP Measured Embolic Power
PWD Pulsed Wave Doppler
RMS Root Mean Square
STFT Short-Time Fourier Transform
TCD Transcranial Doppler
WF Wang and Fish simulator
Chapter 1
Introduction
Cerebrovascular diseases are the second leading cause of death in the World, after heart disease [World Health Organisation, 2011]. Among the most relevant cerebrovascular disorders are the ones caused by cerebral embolism (e.g. ischemic stroke). Apart from disease affected patients there are also other individuals that can be affected by embolic events, in particular the ones subject to differences in external environmental pressure. Among the examples are scuba divers or flight personnel and passengers. Changes in pressure can facilitate the appearance or enlargement in volume of emboli in blood flow. When such mass travels in the circulatory system, it can move from large arteries to narrower vessels and cause blood flow interruption. Such occlusion might lead to permanent damage or even death.
Doppler ultrasound instrumentation has been subjected to great study and im-provement. Such technique allows the development of non-invasive methods for clinical diagnosis. However such methods are not trivial to implement given the complexity of the embolic signals. Existing methods implemented, and available in clinical environments, are still commonly based on application of the Short-Time Fourier Transform (STFT). However, STFT has well known limitations, in particular in the detection of fast transient signals. Alternative solutions have been presented but frequently miss a common methodology on the signals studied, rais-ing difficulties on the comparison of results.
1.1
Objectives
The ultimate objective of this work is to contribute to the development of a Doppler system which can be taken and used outside of hospital and clinical en-vironments. Such equipment should perform better on the detection of embolic events and be much more portable, when in comparison with the existing systems in use.
This work addresses the detection of embolic events keeping a focus on results comparability. By using and also extending the usage of a blood flow signal sim-ulator, it is intended to create a controlled and familiar work base. In addition, the development of a structured work environment is targeted to facilitate the growth of the number of test cases. Such test cases are the product of some combinations of the varying parameters of the signal processing methods studied. Furthermore, it is meant to provide an evaluation of the results of the test cases, in order to, and based on the comparison between those same results, draw conclusions on the preferable configuration for the signal processing methods.
Summarizing, the purposes of this work are:
• to define the structure of an embolic signals framework;
• to facilitate the comparison of spectral parameters estimator methods; • to extend the usage of the blood flow simulator to include emboli
genera-tion;
• to assess the CWT method that has been referred but not broadly studied,
quantifying the results obtained with CWT.
1.2
Thesis outline
The work description is spanned over five chapters.
This first chapter presents the motivation and objectives of the work and a brief outline of the document organisation.
Chapter 2 reviews global concepts related to the work and tools. Doppler ultrasound, transcranial Doppler and related instrumentation are briefly described. Characteristics concerning blood flow signals and embolic events are reviewed,
presenting also the signal simulator used. The signal processing methods used in this study are enumerated, including the main characteristics and justification for the usage. Finally, metrics and evaluation criteria used are defined.
The third chapter addresses the study framework that mirrors the methodol-ogy: the usage of the blood flow signal simulator and the addition of simulated emboli to those signals are described, and the application of the estimator meth-ods is detailed. The approach used is summarized graphically, highlighting the different phases of the practical goal of emboli detection decision.
The detection of emboli using CWT is reported in Chapter 4 and compared with the STFT alternative. The particular settings used in the studied cases are presented and, when appropriate, discussed. The different scenarios are presented and the results obtained are equated in terms of false negatives, false positives and sensitivity.
Finally in Chapter 5 general conclusions from this work are drawn. The goals and contributions are reviewed and the major issues arising from both the method-ology and the discussion of the resulting comparison are underlined.
1.3
Contributions
The work described here contributed with the assessment of the performance of the CWT on the detection of embolic events and the comparison of such per-formance with the standard STFT.
The dissemination of results was started by reporting intermediate results. The article Assessing the detection of embolic signals using Continuous Wavelet
Trans-form will be presented in October 2011 and published in the Computational Vision
and Medical Image Processing conference proceedings [Gonçalves et al., 2011]. Further publications are envisioned.
Gonçalves Ivo B., Leiria Ana, Moura M. M. M., Assessing the detection of
em-bolic signals using Continuous Wavelet Transform, III ECCOMAS Thematic
Con-ference on Computational Vision and Medical Image Processing: VipIMAGE 2011, Olhão, Portugal.
Chapter 2
Background
2.1
Introduction
This chapter aims to briefly introduce concepts used throughout the work here presented. Doppler ultrasound and Transcranial Doppler (TCD) are reviewed as basis of the signal acquisition and properties. Types of emboli and their nature are described, as well as the signal simulator used. Also, the spectral estimator methods are enunciated and the characteristics with higher relevance for this work are emphasised. Finally, important metrics used throughout the work are briefly presented.
2.2
Doppler ultrasound
Ultrasound consists of mechanical waves which travel across a medium and are produced at frequencies above the human audible range (i.e. above 20 kHz). In case of biomedical signal processing, and associated with Doppler effect, the waves are produced with transducer and the medium is the human body. The transducer characteristics depends of the nature of the acquisition subject. In the human body there are different requirements for the acquisition equipment, de-pending on the subject of study being, for instance, a foetus in a woman’s womb or the blood flow in the middle cerebral artery.
processing and analysis. Such analysis can enable detection and characterization of abnormalities without the need of invasive methods, e.g., surgery.
2.2.1
Doppler effect
A common situation that perfectly describes the Doppler effect is the ambu-lance vehicle in emergency cruise. In such situation the ambuambu-lance travels rel-atively fast and with its siren on. As, from distance, the ambulance approaches a listener, the sound of the siren increases its frequency. Once it passes by the listener and starts to get farther, the frequency of the siren gets lower again. How-ever, for any individual travelling in the ambulance, the siren sounds at a constant frequency.
The event described represents one of the many possible situations where one can experience the Doppler effect. More generalized, the Doppler effect can be defined as a change on the frequency observed from a point (fixed or with known velocity), whereas the frequency observed is proportional to the relative velocity between the emitter and the observer.
In clinical application, one should consider a combination of two Doppler ef-fects: (1) the transducer working as emitter, sending ultrasound through the human body targeting the moving blood cells; (2) the blood cells emitting (backscatter-ing) the ultrasound waves while moving and the transducer receiving the ultra-sound.
Thus, the Doppler signal can be described as
fD= fe− fr= 2 fe
vcos(θ)
c (2.1)
where fD, fe and fr are the Doppler, emitting and received frequencies, respec-tively, v is the velocity of the target,θ the emitting transducer and the direction of the moving target and c is the ultrasound waves velocity in the medium, consid-ered constant [Azhari, 2010].
Therefore, the velocity can be extracted by rearranging Eq. (2.1) such as
v = c fD
2 fecos(θ)
(2.2)
2.2.2
Doppler ultrasound instrumentation
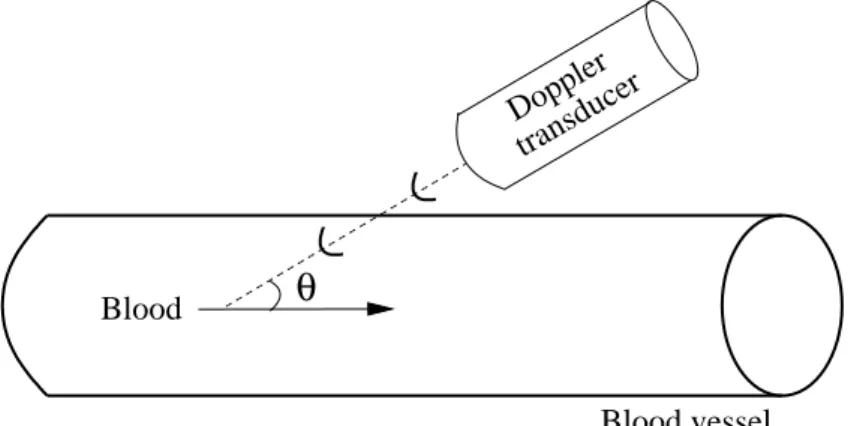
As Figure 2.1 illustrates, a transducer targets a blood vessel with an angleθ, producing waves with a frequency fe which propagate at a speed c. Blood flows through the vessel with a constant velocity v. When the waves encounter the blood cells, the waves are reflected back towards the transducer. However, the re-flected waves have a frequency fr, different from the initial frequency produced on emission from the transducer due to the blood particles movement. The resulting difference between the two frequencies allows estimating the blood direction and speed. More on, the power backscattered also allows estimating the consistency of the blood particles.
θ
BloodBlood vessel
Doppler transducer
Figure 2.1: Ultrasonic transducer emitting waves towards blood particles flowing in a blood vessel (adapted) [Azhari, 2010, chap. 11]
Some of the most common difficulties of the usage of ultrasound are related to absorption or reflection of the emitted wave signal. Lower emission frequencies enhance the signal penetration capability, reducing the attenuation but allow lower imaging resolution of the scanned structures.
In what concerns Doppler ultrasound equipment, there are two main types of transducers commonly used: continuous wave (CWD) and pulsed wave (PWD)
Doppler. The former one is the older and electronically simpler of the two kinds. It involves a pair of transducer crystals, being one dedicated for continuous trans-mission and the other to reception. The latter uses a single transducer that alter-nates between transmission and reception modes. The main advantage of CWD over PWD is the capability to measure high frequencies given the nature of con-tinuous emission and receiving, whereas PWD mode shifting causes restrictions to the high frequencies sensitivity that are related to the switching time period. However PWD presents a major advantage over CWD, being able to determine the depth of the structures which are generating the echoes, allowing to target specific body organs or blood vessels.
2.2.3
Transcranial Doppler
The Doppler effect applied to medical ultrasound consists in an ultrasound de-vice (transducer) emitting ultrasound waves into the human body and collecting the echoes returned by the targeted body structure. In the case of Doppler ultra-sound applied to blood flow, a goal is to measure characteristics, e.g. velocity, of the particles travelling inside a blood vessel.
In the particular case of transcranial ultrasound, additional technical difficul-ties arise. The composition, consistency and, more relevantly, the thickness of the skull bone causes great attenuation in ultrasound beams. To this, also adds the fact that cerebral blood vessels are small and tightly packed within the brain tis-sue causing higher difficulties on identification and localization of the ultrasound beam target. Furthermore, characteristics such as age, gender or ethnic group of the patient are also causes of possible variations on the quality of the Doppler signal acquisition.
A consequence of these difficulties is the lower operating frequency of the TCD equipment. While ordinary medical diagnosis ultrasound Doppler instru-mentation use frequency values between 5 and 8 MHz, TCD equipment is required to operate around the 2 MHz. As mentioned before, lower emission frequencies allow better signal penetration but degrade the imaging resolution provided by the echoed signal.
2.3
Embolic events
The main causes of death in developed countries are diseases of the circulatory system. The second most common disease of the circulatory system is the cere-brovascular disease, after heart attacks [World Health Organisation, 2011]. Thus, is particularly important to identify the causes for such disease.
Blood vessel occlusion (embolism) might have severe consequences which, depending on the location, can lead to permanent damage or even death. The most common types of embolism are the haemorrhagic and ischemic. A haemorrhagic embolism occurs when there is a rupture of the blood vessel, causing the blood to spread in tissue surrounding the rupture. An ischemic embolism, although caused by an occlusion, does not cause a rupture because it is generally happening in a bigger artery. In this case, the occlusion prevents the normal flow of the blood causing partial or complete privation of blood to the tissues. When in a prolonged condition, such privation of blood can lead to tissue death by anoxia (deficiency of oxygen supply). The occlusions are mainly the product of arteriosclerosis, embolus or thrombus.
Arteriosclerosis describes a pathological process in which the arterial interior walls retain lipids, cholesterol plaques, collagen and cellular debris, causing the walls to become thick and calcified. This causes a decrease on capacity of trans-port of blood over the affected artery, also associated with the decrease of the pulsatility index. The arteriosclerosis condition, allowing platelet aggregation, may also contribute to the appearance of emboli or thrombi.
An embolus can be defined as a detached intravascular mass which can be solid, liquid or gaseous and that is carried by the blood to a site distant from its point of origin [Kumar et al., 2010]. Independently of the nature or origin, the concept of embolus depends of the circumstance of movement in the blood flow.
A solid embolus can be formed by plaques of arteriosclerosis released to the blood flow, by fat from endogenous tissues (e.g., released from bone fractures) or fragments of blood clots (thrombus). Liquid emboli are more frequently orig-inated by amniotic fluids which can enter in woman’s blood circulation during parturition. Gaseous emboli can be caused by air entering in the blood circula-tion during surgery (e.g., air trapped in coronary artery during bypass surgery).
A particular type of gaseous emboli is called decompression sickness and occurs when there is a sudden decrease in atmospheric pressure. This situation is more common to be experienced by scuba or deep sea divers.
The most common emboli are the thromboemboli. These are derived from thrombi that are usually formed to deal with injuries in blood vessels. As the blood clot is formed in the blood vessel it becomes thicker and small pieces can get detached and start transiting with the blood.
Embolism types can be clinically classified in multiple ways, being usually related with the occlusion location or more specific with the increase of possible damaging consequences. Embolisms occurring in vessels farther from organs are referred as artery or venous embolism, whereas the ones directly affecting organs are named more specifically. Examples are the pulmonary embolism or the brain attack (commonly known as stroke).
2.3.1
Wang and Fish simulator
Wang and Fish developed a signal simulator which generates non-stationary Doppler signals in short computation time [Wang and Fish, 1995]. The simula-tor requires the sampling frequency value and the spectral parameters reference curves. This reference signals are used to generate the simulated signals with the desired properties, to best match specific Doppler blood flow signals. The spec-tral parameters required are the mean frequency, bandwidth and power variation over time. For the case in question, was used the spectral parameters references generated from clinical MCA signals, represented in Figure 2.2.
Thus, given a non-stationary Doppler signal generally defined as:
xD(t) = rgauss(t)ejΦ(t) (2.3)
where the exponential term describes the time-varying frequency shift and the deterministic phase is given by:
0 500 1000 0.5 1 1.5 2 a) Time (ms) 0 500 1000 0 0.5 1 1.5 Time (ms) b) 0 500 1000 1.8 2 2.2 2.4 2.6x 10 8 c) Time (ms) 0 500 1000 0.2 0.3 0.4 0.5 d) Time (ms)
Figure 2.2: MCA signal reference curves for (a) maximum frequency, (b) mean frequency, c) power variation over time and (c) bandwidth
and rgauss(t) is a Gaussian random variable with spectrum centred at zero fre-quency which, given the nature of Doppler signals, should be a time variant Gaus-sian random process with a time variant filter. Thus, rgausscan be defined as:
rgauss(t) =
∫
rn(t−τ)h(τ,t)dτ (2.5)
where rn(t) is the white Gaussian noise and h(τ,t) a time variant filter.
For the purpose of signals simulation, Wang and Fish designed a Gaussian filter such as:
h(τ,t) = const. √ p(t) bt(t) e −τ2 2bt2(t) (2.6)
where p(t) is the power variation over time and bt(t) the filter bandwidth.
2.3.2
Measured embolic power
Several factors, like tissue attenuation or the random nature of the Doppler signal power scattering, make impossible to directly measure embolic power. A technique often used to quantify fluctuations in the backscattered Doppler power is the measured embolic power (MEP), which can be written as:
MEP(t) = 10 log ( Ptotal(t) Pblood(t) ) (2.7)
where Ptotal is the power of the embolic signal and Pblood the power of the blood signal without presence of embolic events [Evans and McDicken, 2000].
MEP uses the power from the surrounding blood as a normalization of the measured power, allowing to distinguish abnormal fluctuations of the blood flow backscattered Doppler power [Leiria et al., 2005].
2.4
Signal processing methods
An important part on signal processing is choosing the appropriate method for a particular application of signal analysis and characterization. Such a choice is usually strongly related to the signal physical characteristics like acquisition or source environment (when known). In the case of blood flow signals, and more specifically of embolic signals, such characteristics like the cardiac cycle, and in particular the peaks generated, require careful attention.
2.4.1
Overview
frequency analysis is an important part of signal processing. Time-frequency methods and representation allow the study and localization in time of events of wide range of areas, from geology to medicine. Fourier Transform
is the classical spectral estimator method used, and some other methods derive from it. Examples are the Wavelet Transform or the Displacement-frequency [Leiria, 2005].
2.4.2
Fourier transform
Fourier Transform (FT) and associated signal processing analysis are well known techniques and frequently taken as reference, despite its limitations on dealing with non-stationary signals. These limitations have an impact even on the use for stationary signals, hiding information about time. FT clearly reveals how much of which frequencies a signal contains, but completely omits when these frequencies occur. The transformation process does not lose the information about time, otherwise it wouldn’t be possible to reconstruct the original signal (by means of the Inverse Fourier Transform). The time information is hidden in the phases of the sines and cosines used by FT, making it impossible to identify the moments in time when each frequency is present [Hubbard, 1998, p. 22].
The Fourier Transform can be defined as
X (ω) =
∫ ∞
−∞x(t)e
− jωtdt (2.8)
The Short-Time Fourier Transform (STFT), also known as Windowed Fourier Transform, appeared as an answer to the need of describing signals on both time and frequency. By segmenting the signal in portions, and applying the Fourier transform to each portion, one is able to know which frequencies happen in the chosen segment (time slot). However, this method imposes compromises: smaller window allow better recognition of sudden changes (i.e., high frequencies), like peaks or discontinuities. But a small window is unable to identify low frequencies, when the frequency period is longer than the duration chosen for the window [Hubbard, 1998, p. 24].
2.4.3
Wavelet transform
The aim of wavelet analysis is to get a time-frequency representation of the signal. As with fourier-based transforms, where the signal is decomposed in sines and cosines for analysis and reconstruction, Wavelet Transform (WT) uses a func-tion (usually called “mother wavelet”) for a similar purpose. Thus, Wavelet can be described as an extension of Fourier analysis.
Figure 2.3: Top: using STFT, given that the window is fixed, low frequencies are not detectable for a small window, while using a large window might cause lost of information for brief frequency changes. Bottom: A mother-wavelet (left) is stretched (middle) or compressed (right) to change the size of the window, en-abling to analyse a signal at different scales [Hubbard, 1998, p. 29]
While STFT limitations in time-frequency analysis result from the trade-off between low and high frequencies resolution and the window size choice, for wavelet-based methods the “window” is stretched and compressed to get, simul-taneously, better resolution at lower and higher frequencies.
The basic approach is the same. The coefficients tell in which way the analysis function (sine, cosine or wavelet) needs to be modified in order to reconstruct the
be used for analysis and reconstruction. Usually Fourier associated coefficients are ignored, keeping the focus on the frequencies of the analysing functions (sines and cosines). For WT this is not possible, since the frequency of the analysing function changes along the analysis in order to achieve better results for each frequency component of the signal. Therefore, one must work directly with the coefficients. Wavelets-based methods work like a “microscope”: compressing mother wavelet function increases the magnification of this microscope, enabling one to take a closer look into small details in the signal [Hubbard, 1998, p. 32].
In a formal definition [Chui, 1992], a wavelet series can be written as
x(t) =
∞
∑
j,k=−∞cj,kψj,k(t) (2.9)
whereψ is a wavelet function and the coefficients of the series is given by
cj,k=
∫ ∞
−∞x(t)ψ
∗(t)dt (2.10)
Thus, the Wavelet Transform, in its integral form is defined as
Wψ(b, a) = √1 |a| ∫ ∞ −∞x(t)ψ ∗(t− b a ) dt (2.11)
where x(t) is the time domain signal,ψ∗(t) the wavelet function complex conju-gate, and t and a the time and scale parameters, respectively. The factor 1/√|a| ensures energy preservation over the transformation. Thus, from (2.9) and (2.10), comes that
cj,k= Wψ(k2− j, 2− j) (2.12)
The transformation Wψ is called the “Continuous Wavelet Transform” (CWT) relative to the “basic wavelet” function ψ. Thus, the ( j, k)th wavelet coefficient of f is given by the integral wavelet transformation of f at the translation (or
dyadic position) b = k2− j with scaling (or binary dilation) a = 2− j, where the same wavelet function ψ is used to generate the series (2.9) and to define the integral wavelet transform (2.11).
Moreover, is interesting to note that while the two components of Fourier analysis (series and transform) are unrelated, the two corresponding components of Wavelet analysis (also series and transform) have an intimate relationship as shown in Eq. (2.12) [Chui, 1992].
Wavelet transformation provides scale decomposition, rather than time-frequency. The relation between scale (a) and frequency ( f ) is given by a = f0/ f ,
where f0is the central frequency of the Fourier Transform of the wavelet function
used [Matos et al., 2000].
There are two main approaches to wavelet-based analysis: Continuous Wavelet Transform (CWT) and Discrete Wavelet Transform (DWT). Both approaches guar-antee a full reconstruction of the original signal; however DWT is only possible to implement using orthogonal wavelets.
The main differences between both, with relevance in this work are comput-ing performance and analysis readability. DWT is frequently reported as more suitable for algorithmic efficiency or compression applications but its use makes it harder to read and understand what physically is happening along the signal. On the other hand, CWT with all the redundancy of the coefficients informa-tion is not best suited for compression [Hubbard, 1998, p. 69, 89-90]. However, when computing time is not a restriction, Continuous Wavelet Transform is best suited for analysing physical phenomenon, as in this case for embolic signals [Hubbard, 1998, p. 95]. One example of DWT compression application usage is the JPEG 2000 standard [Singer et al., 2004].
2.4.4
Wavelet families
The mother wavelet family function takes a central role in the application of CWT, as it takes the generic definition of the transformation into a specific ap-plication. There is a wide number of applications for the Wavelet analysis and, therefore, also a wide number of Wavelet family functions.
However, only from the decade of 1970 the Wavelet theory has seen greater de-velopment. Definition of several Wavelet families and unification and definition of Wavelet theory, which become what is today known as CWT, are among those developments.
Figure 2.4 shows examples of graphical representations of mother wavelets.
−0.5 0 0.5 1 1.5 −1 −0.5 0 0.5 1 a) −4 −2 0 2 4 −1 −0.5 0 0.5 1 b) −5 0 5 −1 −0.5 0 0.5 1 c) −5 0 5 −1 −0.5 0 0.5 1 d)
Figure 2.4: a) Haar, b) Morlet, c) Mexican Hat and d) Gaussian (order 4) mother wavelet functions
The Haar wavelet is the most simple wavelet function and can be defined as
ψHaar(x) = 1, 0≤ x < 0.5 −1, 0.5 ≤ x ≤ 1 0, otherwise (2.13)
which is a biorthogonal wavelet function which belong to the Daubechies wavelet family, being the equivalent to the first order Daubechies wavelet.
same function family, the Gaussian wavelet [Daubechies, 1992]. Morlet wavelet can be defined as a Gaussian shifted in frequency and written, in time-domain, as
ψMorl(x) = cos(5x)e −x
2
2 (2.14)
The Gaussian wavelet family can be expressed as
ψGauss(x, n) = Cn
∂n(ex2)
∂x (2.15)
where n denotes the wavelet function order and Cn is such that the 2-norm of ψGauss(x, n) = 1.
A particular case of the Gaussian wavelet family is the Mexican Hat wavelet which is obtained by the second derivative from the Gaussian probability density function, which can be written as
ψMexH(x) = 2 √ 3π −1 4(1− x2)e− x2 2 (2.16)
Although the usage of wavelets in embolic signal processing has increased, the study of choice of the wavelet function has been neglected. Some study for DWT usage have been presented (e.g. [Aydin, 2007]). In the scope of this work, higher relevance is given to wavelet functions which closer resemble the signal waveform studied.
2.5
Relevant metrics
2.5.1
Spectral parameters
us-analysis characteristics can be directly assessed from the spectra of the source sig-nals. Maximum and mean frequencies, bandwidth and power variation over time are the spectral parameters usually extracted.
Maximum and mean frequencies are proportional, respectively, to maximum and mean velocities of the blood flow, as it can be verified using Eq. (2.2). The bandwidth is proportional to the blood flow turbulence, whereas the power varia-tion over time represents the quantity, type and size of particles backscattered in the signal.
Power variation over time is a relevant metric, as embolic signal analysis re-lies on the variation (increase) of the measured power for embolic event detec-tion. Relatively large variations are usually good start points for particular time restricted analysis for possible detection and characteristics estimation of embolic events. Maximum and mean frequencies permit, based on anticipated identifica-tion of an embolic event, to infer about the physical characteristics of the embolus, by knowing velocity and duration of the event.
2.5.2
Embolus to blood ratio
A common referred parameter in emboli detection is the embolus signal in-tensity to background ratio (EBR) [Markus et al., 1993, Aydin, 2007]. A closely related concept to Embolus to Blood Ratio (EBR) is MEP. However, the latter can be defined by the combination of EBR and additional factors, such as embolus trajectory in sample volume or type of signal processing applied. Thus, EBR can be written as:
EBR(t) = PB+ PE
PB
(2.17)
where PBand PE are the power backscattered by blood when no embolus is present and the power backscattered by an embolic event, respectively.
2.5.3
Sensitivity and specificity
In medical applications, among others, statistical measurements are used to determine the performance of classification systems. Widely used are the sensi-tivity and specificity functions.
The sensitivity evaluates the ability for the classification system to identify positive results and can be defined as:
sensitivity (%) = true positives
true positives + false negatives× 100 (2.18)
Specificity evaluates the ability for the classification system to identify nega-tives results and can, therefore, be defined as:
specificity (%) = true negatives
true negatives + false positives× 100 (2.19)
2.6
Conclusions
In this chapter, an overview on ultrasound Doppler was presented in terms of mathematical definition and physical characteristics. The main points on Doppler instrumentation and requirements for Transcranial Doppler were also reviewed. Origin and nature of emboli were also briefly described, as well as the measured embolic power as the emboli detection intensity parameter.
The signal processing methods, main characteristics and similar and distin-guishing properties were introduced. In particular, related to CWT method, wavelet theory was reviewed. Relevant metrics for signal processing, embolic events de-tection and system performance were also reviewed.
Chapter 3
Materials and methods
3.1
Introduction
The methodology developed and implemented is described, presenting in de-tail the three main phases of the work.
Signal simulation, including the addition of embolic events, is described and example signals are graphically represented. The signal processing methods are also reviewed and example estimated spectral representations are also included. The spectral parameters are referred as outcome of the signal processing phase and as information input to the embolic events detection phase. The emboli detection assessment phase is described in detail, with the reference to the use of EBR as the base for the implemented decision algorithm.
Finally, a block diagram representing the framework methodology is presented and explained for ease of global overview of the implemented structure.
The methodology described was implemented using Mathworks R
Matlab R Version 7 Release 14, taking advantage of the already existing signal processing methods functions.
3.2
MCA signal simulation
In order to study and identify the presence of embolic events in blood flow sig-nal it is necessary to know in advance the characteristics of embolic free sigsig-nals.
Some of those characteristics are spectral parameters of the signal. In this case maximum and mean frequencies, power variation over time and the root mean square (RMS) bandwidth were estimated for further analysis.
Using the Wang and Fish signal simulator (see 2.3.1), MCA signals were gen-erated mainly with two purposes: to be ground base for generation of MCA sig-nals with embolic events; and to enable the comparison of the signal processing methods applied to signals with embolic events.
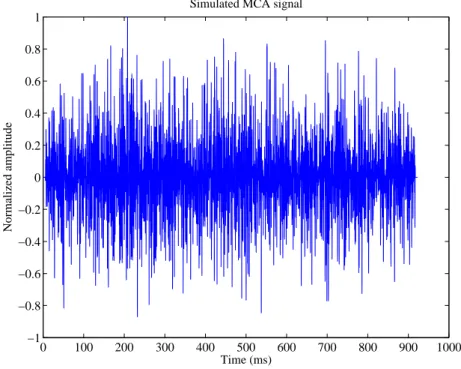
In Figure 3.1 is represented an example, out of the several generated signals, of a simulated MCA signal without emboli and having the duration of a cardiac cycle. 0 100 200 300 400 500 600 700 800 900 1000 −1 −0.8 −0.6 −0.4 −0.2 0 0.2 0.4 0.6 0.8 1 Time (ms) Normalized amplitude
Simulated MCA signal
Figure 3.1: Simulated MCA blood flow signal without emboli
3.3
Addition of embolic events
The spectral estimator methods were evaluated for sensitivity and accuracy on embolic events detection and localization. For that purpose, signals were
sim-different signals, and therefore, sim-different test cases. From each of the previously generated signals it was generated one other, for each of the MEP values of a defined set.
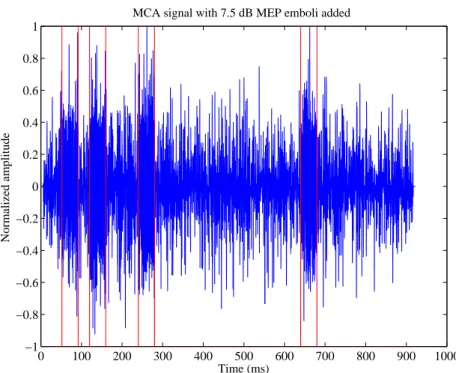
Given the different properties of MCA blood flow signals along the cardiac cycle, it is important to study the presence of embolic events in different local-izations within the signal. Thus, embolic events were added in four defined time regions for each generated signal. Those regions were, once defined, kept con-stant for each new simulated signal. The choice of the location of the emboli areas is related to its relevancy along the cardiac cycle signal. Therefore, due to the increased difficulty on detecting embolic events in systole, three embolus were located around the systolic peak - rising curve (1), peak (2) and decaying curve (3) - and only a fourth embolus was located in diastole phase of the cardiac cycle. Figure 3.2 shows the simulated MCA signal generated from the background signal that was shown in Figure 3.1 with added, as described, simulated embolus in each defined area. The emboli areas can be observed by the red delimitation (start and end) in colour visualization or light grey in black and white (B&W) visualization.
As introduced before (in 2.3.2), a commonly used metric to access the emboli power is the Measured Embolic Power (MEP) which compares the power of the signal during the presence of emboli with the power of the signal on absence of emboli. Analogously to Equation (2.7), MEP can also be written as:
MEP = 10 log10 ( PB+ PE PB ) (3.1)
where PB is the power backscattered by blood without presence of emboli and PE is the power backscattered by the embolus.
Therefore, in order to be able to define the power value to be added to the signal, thus conveying the desired simulated emboli, equation (3.1) should be re-solved in order to PE such as:
PE = (
10MEP10 − 1 )
0 100 200 300 400 500 600 700 800 900 1000 −1 −0.8 −0.6 −0.4 −0.2 0 0.2 0.4 0.6 0.8 1 Time (ms) Normalized amplitude
MCA signal with 7.5 dB MEP emboli added
Figure 3.2: Simulated MCA blood flow signal with added 7.5 dB MEP emboli The time-domain representation of the simulated emboli is formed by a sinu-soidal wave which frequency is retrieved from the corresponding embolus area time interval of the averaged value of the maximum frequency reference curve (Figure 2.2 a)). Alternatively, in case of absence of the maximum frequency curve, the frequency value could have been acquired from the averaged maximum fre-quency spectral parameter estimated from the original (emboli free) signals. This alternative could make the methodology independent of the reference curve.
Finally, the embolus generated is a sinusoidal signal which frequency is the one just described, whereas the amplitude is given by√PE. The simulated embolic event is then added directly to the previously simulated background signal in the corresponding time frame (embolus duration).
3.4
Spectral estimation
signal properties.
Short-time Fourier transform (STFT) and Continuous wavelet transform (CWT) were the spectral estimator methods used. These methods require definition of some of the configuration parameters. In particular, configurations which influ-ence the time and frequency resolutions were defined so that those resolutions are the same for both methods.
3.4.1
Short-time Fourier transform
Being presented as the classical signal processing method and, therefore, as the expected comparison method, STFT was applied to signals generated.
As example, Figures 3.3 and 3.4 show the time-frequency representation, ob-tained by the application of STFT, of the time domain signals presented in figures 3.1 and 3.2, respectively.
For the STFT, the time resolution of the spectral estimation was approximated to the one achieved by CWT by using a very high window overlap.
Time (ms)
Frequency (kHz)
Time−frequency estimation of MCA signal using STFT
0 100 200 300 400 500 600 700 800 0 1 2 3 4 5 6
Figure 3.3: Time-frequency representation of MCA blood flow signal without emboli using STFT
Time (ms)
Frequency (kHz)
Time−frequency estimation of MCA signal with 7.5 dB emboli added using STFT
0 100 200 300 400 500 600 700 800 0 1 2 3 4 5 6
Figure 3.4: Time-frequency representation of MCA blood flow signal with 7.5 dB MEP emboli using STFT
3.4.2
Continuous wavelet transform
One of the most relevant characteristics of the Wavelet Transform (WT) is the ability to adjust the given analysis function (mother-wavelet) to best match the analysed signal. This adjustment consists in a scale factor which is applied to the analysis function (see 2.4.3) and aims to identify the frequencies of the signal on each time instant, thus better perceiving the characteristics of the signals.
In the Matlab implementation of WT the scales are given as vector containing the different scale factors desired for the analysis in question. Thus, the transform is applied to the signal, on each time instant, for each of the scales provided.
Given the existing direct relation between scale and frequency, the scale fac-tors vector also defines the frequencies resolution. The direct relation between scale and frequency is given by the expression
where fais the frequency equivalent for the a scales and fcis the central frequency retrieved from the application of the Fourier transform to the mother wavelet func-tion. The factor∆ais the scales sampling period.
Analogously to the approximation made for time resolution for STFT, in case of CWT the scale - and therefore frequency - resolution was configured so that it matches the one of the method in comparison.
In figures 3.5 and 3.6 are shown the time-frequency representation (converted from time-scale) of the time domain signals presented in figures 3.1 and 3.2, respectively, obtained by the application of CWT and using Morlet as mother-wavelet function. In Figure 3.5 is the time-frequency representation (converted from time-scale) of the time domain signal of Figure 3.1, obtained by the applica-tion of CWT. Figures 3.3 and 3.5 illustrate the difference in the time resoluapplica-tion of both methods, being CWT the method with better resolution.
Time (ms)
Frequency (kHz)
Time−frequency estimation of MCA signal using CWT
0 100 200 300 400 500 600 700 800 900 0 1 2 3 4 5 6
Figure 3.5: Time-frequency representation of MCA blood flow signal without emboli using CWT and a Morlet mother-wavelet function
Time−frequency estimation of MCA signal with 7.5 dB emboli added using CWT Time (ms) Frequency (kHz) 0 100 200 300 400 500 600 700 800 900 0 1 2 3 4 5 6
Figure 3.6: Time-frequency representation of MCA blood flow signal with 7.5 dB MEP emboli using CWT and a Morlet mother-wavelet function
3.4 and 3.6 show, respectively, the STFT and CWT time-frequency representation for the time-domain signal with 7.5 dB emboli present show in Figure 3.2.
3.4.3
Spectral parameters
From the spectral estimation obtained from the application of the spectral esti-mation methods previously introduced, it is possible to extract inforesti-mation about the signals studied.
This study focused on the retrieval of information about maximum and mean frequencies, RMS bandwidth and power variation over time of the simulated MCA signals. The spectral estimator methods were applied to the signals without and with emboli presence, for each of the MEP emboli added. The mentioned spectral parameters were retrieved from each signal for later analysis and assessment.
For the particular case of the simulated signals without presence of embolic events, the average of each spectral parameter was also calculated. The average
stored for later use as reference during the detection evaluation phase.
3.5
Detection assessment
After the signal simulation phase, which included simulation and addition of embolic events, and the signal processing phase, the processed signals are subject to the detection assessment phase.
For the production and analysis of results, it was developed a decision algo-rithm which takes each of the processed signals information and estimates the accuracy of the method based on the information of the localization and duration of the simulated emboli added.
The detection phase is composed by two components. The EBR, previously introduced as a frequently referred parameter is emboli detection, is applied to the power variation over time spectral parameter which has been previously estimated. Remembering the EBR definition, which was defined (in Equation (2.17)) as
EBR(t) = PB+ PE
PB
(3.4)
should be referred that the average of the power variation over time for the embolic event free signal is represented by PB, whereas PB+ PE is the power variation spectral parameter of the single signal with emboli added in analysis.
The detection algorithm itself runs over the computed EBR values of the sig-nal. When the integral of instantaneous EBR values under a running window exceeds a chosen threshold, the detection of an embolus is signalled. Given that each signal contains multiple embolic events in pre-determined positions and fixed time duration, the detection is judged correct if the centre of the signalled area is within the time interval of the simulated embolus. Supposing that two emboli are detected as one and the centre of the detected area is outside both emboli areas, the judgement would be a false positive and two false negatives.
In order to illustrate the results, attention is first drawn to some particular cases. Figures 3.7 and 3.8 represent the EBR of the same embolic simulated signal obtained with the application of STFT and Morlet-based CWT, respectively.
0 100 200 300 400 500 600 700 800 900 0 1 2 3 4 5 6 7
EBR for added 7.5 dB emboli power using STFT
Time (ms)
Amplitude (dB)
Figure 3.7: EBR measured using STFT with 20 ms window, 50% overlap and 3.5 dB threshold value for emboli added of 7.5 dB. Emboli areas signalled in red and emboli detection areas in green.
The solid red lines delimit the emboli areas and the solid green lines delimit the area of the detected emboli. In black and white (B&W) printing, red and green will appear as dark grey and light grey, respectively.
In an early stage of the development of the detection phase, it was tested the usage of a fixed threshold value. However this implementation was dropped (in favour of the EBR based threshold) as it was clear that the signal analysis required an adaptive and time-varying value for the embolic event detection decision.
3.6
Framework block diagram
The block representation of the methodology developed and implemented in-tegrates, at major scale, three phases: 1) signal simulation; 2) signal processing; and 3) embolic events detection.
0 100 200 300 400 500 600 700 800 900 1000 0 1 2 3 4 5 6 7
EBR for added 7.5 dB emboli power using Morlet based CWT
Time (ms)
Amplitude (dB)
Figure 3.8: EBR measured using Morlet-based CWT with 20 ms window, 50% overlap and 2 dB threshold value for emboli added of 7.5 dB. Emboli areas sig-nalled in red and emboli detection areas in green.
simulation with the MCA blood flow characteristics and followed by the simu-lation and addition of embolic events to the previously simulated signals. The output of this stage are time-domain simulated MCA signals, both with and with-out emboli (particular case exists for the addition of 0 dB MEP to keep original signals).
The signal processing phase requires the decision on which spectral estimator method to use, between the ones used in the study. The outcome of this phase are the spectral estimator coefficients and the previously enumerated spectral param-eters. As also mentioned, for the signals without presence of embolic events, the averages of the spectral parameters are also calculated.
Finally, the detection phase is composed by the EBR estimation which is then fed into the detection algorithm. This phase is executed only for the signals with added simulated embolic events. The detection algorithm runs through the power variation over time of the signal under analysis and flags the detection of an event
CWT STFT Simulation Processing Detection addition Embolic signal simulator Blood flow signal
Detection algorithm EBR estimation
Figure 3.9: Framework implementation block diagram
when the power value exceeds a defined threshold value. The output of this phase is a count and duration of the detected event.
ization of the embolic events detected. The current work is focused only on the detection of such events and, for that purpose, only power variation is used from the multiple spectral parameters calculated.
3.7
Conclusions
The current chapter puts together a set of tools and which define the method-ology of the work. The work is organized in three distinct phases and examples of the outcome of each one are presented. Thus, examples of the simulated signals (without and with emboli added), spectral estimation and emboli detection algo-rithm behaviour for both signal processing methods are graphically represented.
Finally, a block diagram which sums the whole methodology is presented, representing the framework composed by the combined phases.
Chapter 4
Results and discussion
4.1
Introduction
The current chapter targets the results and their discussion. Detailed infor-mation concerning the settings used in each phase of the framework is presented. The results of emboli detection are equated in terms of false positive and false negative counts and the exhibited behaviour of the different methods is compared. The sensitivity of the best CWT approaches is analysed and finally, some remarks highlight the distinctions between STFT and the different CWT based set-ups.
4.2
Configuration of particular settings
4.2.1
Framework settings
For the signal simulation phase, the Wang and Fish simulator was fed as in-put with MCA reference curves signals of mean frequency, bandwidth and power variation over time. The duration of the reference curve signals - 923 ms - is taken as duration of the simulated signals. The sampling frequency was defined as 12.5 kHz. The emboli added to the simulated signals were located (centred) at 72, 140, 260 and 660 ms while having a duration of 40 ms each.
In regards to the signal processing phase, both spectral estimator methods used require settings definition. In the case of the STFT, the sliding window function
used was the rectangular window, having a length of 28.8 ms (360 bins). For the window overlap, a high percentage of overlap (99.7%, equivalent to 359 bins) was used. The choice of such overlapping aims to achieve the best time resolution pos-sible, whereas the window length is the one which provides best results for equally weighted estimation of power variation over time and mean frequency parameters for high overlapping percentage [Leiria, 2005, p. 147]. In what concerns CWT, the range of scales was arranged to best match the frequency resolution obtained with STFT. Thus, a set of 180 equally weighted scales was defined.
The embolic event detection phase, requires the definition of the sliding win-dow length, the winwin-dow overlap and the threshold value which will trigger the detection. For the first setting, the running window, it was used a 20 ms duration window, whereas the window overlap was defined as 50% (10 ms). The threshold values chosen were 2 dB and 3.5 dB for CWTs and STFT, respectively.
4.2.2
Case set-up
The complete set-up comprehends a wide number of signal processing com-binations, due to the multiple variables and values tested.
Using the simulator, 100 simulated MCA blood flow signals were generated. To each of the MCA signals, emboli were added with the following MEP values:
PMEP={5 6 6.5 7 7.5 8 9} (4.1)
combining together 800 simulated signals to be processed, 100 without emboli and 700 for the combined values of MEP added.
Each of the 800 signals was processed using STFT and each of the six CWT mother-wavelets studied:
• Morlet • Mexican Hat • Meyer
• Gaussian (order 4)
Thus, the signal processing phase computes each signal using seven different spectral estimator configurations and creating, altogether, 5600 combinations to be further analysed.
The assessment of detection of emboli in the simulated signals was quantified in terms of false positive and false negative counts.
4.3
Results
Following the methodology applied, results are noted. The results are pre-sented in tables, detailing the counts for each area where emboli were added (s1,
s2, s3 and d1). Tables 4.1, 4.2, 4.3, 4.4, 4.5, 4.6 and 4.7 refer to Morlet, Mexican
Hat, Meyer, Gaussian (order 4) and Daubechies (order 4 and 8) CWT mother-wavelets and STFT counts, respectively.
Preliminary analysis of the results presented here already allows to clearly distinguishing between CWT and STFT, in regards of the performance obtained on the detection of the simulated embolic events. Any of the CWT configura-tions shows better detection counts than the STFT configuration, either for false negative and false positive counts.
Amongst the configurations tested for CWT relevant differences are worth noting. The results obtained with the configurations for Mexican Hat, Gaussian and Daubechies outstand from the remaining, i.e. Morlet and Meyer. The former
MEP False negatives False
(dB) s1 s2 s3 d1 pos. 5 67 12 49 53 1 6 21 0 3 11 1 6.5 11 0 0 2 1 7 4 0 0 0 1 7.5 0 0 0 0 1 8 0 0 0 0 1 9 0 0 0 0 1
Table 4.1: False negative and false pos-itive emboli detection counts for
Mor-MEP False negatives False
(dB) s1 s2 s3 d1 pos. 5 14 1 19 12 2 6 0 0 0 0 2 6.5 0 0 0 0 2 7 0 0 0 0 2 7.5 0 0 0 0 2 8 0 0 0 0 2 9 0 0 0 0 2
Table 4.2: False negative and false pos-itive emboli detection counts for
Mexi-MEP False negatives False (dB) s1 s2 s3 d1 pos. 5 52 8 48 41 1 6 13 0 3 5 1 6.5 7 0 0 0 1 7 0 0 0 0 1 7.5 0 0 0 0 1 8 0 0 0 0 1 9 0 0 0 0 1
Table 4.3: False negative and false pos-itive emboli detection counts for Meyer wavelet using a 2 dB threshold
MEP False negatives False
(dB) s1 s2 s3 d1 pos. 5 33 3 31 21 1 6 9 0 1 2 1 6.5 0 0 0 0 1 7 0 0 0 0 1 7.5 0 0 0 0 1 8 0 0 0 0 1 9 0 0 0 0 1
Table 4.4: False negative and false pos-itive emboli detection counts for Gaus-sian (order 4) wavelet using a 2 dB threshold
MEP False negatives False
(dB) s1 s2 s3 d1 pos. 5 29 2 26 16 2 6 6 0 0 0 1 6.5 0 0 0 0 1 7 0 0 0 0 1 7.5 0 0 0 0 1 8 0 0 0 0 1 9 0 0 0 0 1
Table 4.5: False negative and false positive emboli detection counts for Daubechies (order 4) wavelet using a 2 dB threshold
MEP False negatives False
(dB) s1 s2 s3 d1 pos. 5 38 3 31 22 0 6 10 0 1 3 0 6.5 0 0 0 0 0 7 0 0 0 0 0 7.5 0 0 0 0 0 8 0 0 0 0 0 9 0 0 0 0 0
Table 4.6: False negative and false positive emboli detection counts for Daubechies (order 8) wavelet using a 2 dB threshold
perform better than the latter, which can be evaluated by noting the capacity to achieve optimal (null counts for false negatives) detection for lower value of MEP value.
The configurations which produce the best results are further discussed in next section.
MEP False negatives False (dB) s1 s2 s3 d1 pos. 5 72 61 92 72 0 6 22 10 52 23 0 6.5 10 1 18 6 0 7 2 0 3 0 0 7.5 0 0 0 0 6 8 1 1 0 0 1 9 22 22 0 0 22
Table 4.7: False negatives and false positives emboli detection counts for STFT using a 3.5 dB threshold
4.4
Discussion
Following the presentation of results and preliminary discussion in the previ-ous section, attention is drawn to the CWT configurations that present the more interesting results for further analysis and detailed qualification. Although, as pre-viously noted, STFT performs worse than any of the CWT configurations for the embolic events detection, for the sake of the comparison between CWT and STFT, the results for STFT are also reviewed in more detail.
A metric commonly used, for statistical measurement of performance of clas-sification systems, is sensitivity. Sensitivity was calculated for each of the con-figurations to be further analysed, in order to aid in the comparison between the different set-ups. Being, as mentioned, a commonly used metric, this calculation also aims to facilitate the comparison with results of other studies.
The sensitivity values are presented in tables 4.8 4.9, 4.10 and 4.11 for Mexi-can Hat, Gaussian (order 4) and Daubechies (order 4) CWT mother-wavelets and STFT, respectively. Analogously to the results previously presented in terms of false negative and false positive counts, also the sensitivity calculations are pre-sented in detail per emboli area and, in this case, also prepre-sented in global (aver-aged) terms for each MEP value.
The four tables (Table 4.8 to 4.11) present the percentage values of detected emboli. It can be noted that any of the CWT alternatives outperform the STFT. In fact, STFT global sensitivity values never reach 100% for the MEP values
MEP Per area (%) Global (dB) s1 s2 s3 d1 (%) 5 86 99 81 88 89 6 100 100 100 100 100 6.5 100 100 100 100 100 7 100 100 100 100 100 7.5 100 100 100 100 100 8 100 100 100 100 100 9 100 100 100 100 100
Table 4.8: Sensitivity for Mexican Hat wavelet results
MEP Per area (%) Global
(dB) s1 s2 s3 d1 (%) 5 67 97 69 79 78 6 91 100 99 98 97 6.5 100 100 100 100 100 7 100 100 100 100 100 7.5 100 100 100 100 100 8 100 100 100 100 100 9 100 100 100 100 100
Table 4.9: Sensitivity for Gaussian (order 4) wavelet results
MEP Per area (%) Global (%)
(dB) s1 s2 s3 d1 5 71 98 74 84 82 6 94 100 100 100 99 6.5 100 100 100 100 100 7 100 100 100 100 100 7.5 100 100 100 100 100 8 100 100 100 100 100 9 100 100 100 100 100
Table 4.10: Sensitivity for Daubechies (order 4) wavelet results the majority of the MEP values analysed.
Comparison between the different configurations of CWT presented - Mexi-can Hat (Table 4.8), Gaussian (Table 4.9) and Daubechies (Table 4.10) - requires higher level of detail than the one used to compare globally CWT and STFT.
achiev-MEP Per area (%) Global (%) (dB) s1 s2 s3 d1 5 28 39 8 28 26 6 78 90 48 77 73 6.5 90 99 82 94 91 7 98 100 97 100 99 7.5 100 100 100 100 100 8 99 99 100 100 100 9 78 78 100 100 89
Table 4.11: Sensitivity for STFT results
ing 100% sensitivity on embolic events detection for added MEP of 6 dB and above, having also a high sensitivity value (89%) for the lower MEP value tested (5 dB). Analysing and comparing the emboli areas, it should be noted that s2, the
simulated embolus located in the systolic peak is the embolus with better detec-tion rate. The remaining emboli areas also present a high detecdetec-tion rate, having close values.
The remaining CWT configurations - Gaussian and Daubechies - present also high sensitivity values, being that the worst case studied is for the Gaussian wavelet for 5 dB MEP added with 78%.
For the particular case of Daubechies wavelet, between the two studied (order 4 and 8), only the lower order is here discussed. The higher order Daubechies wavelet, although with a lower detection rate, accomplishes similar results. For 5 dB the global sensitivity is of 77% and of 97% for the 6 dB, whereas the lower order wavelet obtains sensitivity values of 82% and 99% for the respective MEP values.
Despite the demonstrated good overall results, it is also relevant to analyse the results obtained in terms of each embolus area alone. Over all configurations, the embolus area s2shows to be the area with best detection sensitivity and, in some
cases, the difference between the remaining areas within the same configuration requires some considerations to be made.
ity. However, the other emboli areas encompass much lower detection capability. More critical cases are the s1 and s3 emboli areas that, for the case in question,
present sensitivity below 70%. Therefore, is important to note that, although the global results reported allow the comparison of the different configurations, anal-ysis of the results on the level of each emboli area is important to evaluate the capability of a configuration to detect embolic events on different locations along the cardiac cycle given the clinical importance of missed events.
In order to achieve a full comparison between the whole tested set-up and multiple configurations, a chart with the sensitivity values for all configurations is presented in Figure 4.1.
The methods are represented by sensitivity rate, from the lower in front to the highest in the back. It is worth to note, visually, the clear difference between the results for STFT (dark green) and the configuration that worse performs amongst the ones for CWT, the Morlet wavelet (yellow).
In regards the remaining methods, besides what was previously discussed, it is important to note the presence of the Gaussian wavelet (dark grey) between the Daubechies of order 4 and 8. The approximated results for Daubechies of order 8 (blue) and Gaussian makes difficult the visualization of the latter.
To assist in the comprehension of the figure presented, the caption is sorted from the lowest to highest sensitivity rate method, as from top to bottom.
Finally, it is important to note the lowering of sensitivity for STFT, from 8 to 9 dB MEP. Such can be shown by observation of the graphical representation or by analysis of Table 4.11 where the global value of sensitivity decreases from 99 to 93%. Such even, at this point and with the available data, can only be presumed to be related to the choice of the threshold value for STFT (3.5 dB). From Table 4.7 it is possible to see that both false negative and false positive counts increased from the result of 8 to 9 dB. The choice of the threshold value was fine-tuned to optimize the results for the tested combination of MEP values. Further study might be necessary to know the impact of such choice in the performance of each configuration.
Figure 4.1: Global sensitivity chart for all configurations tested
4.5
Conclusions
The application of the multiple configurations of the signal processing meth-ods studied to the simulated signals allowed to conclude that any of CWT-based configurations have better embolic event detection capability than the one using STFT.
Amongst the configurations tested for CWT, Mexican Hat wavelet based con-figuration is the one which demonstrates better sensitivity to emboli detection, both in global terms and per emboli area. However, the rest of the CWT configu-rations also present statistical good results.
Chapter 5
Conclusion
5.1
General conclusion
The main objective of this work was to study the capacity for detection of em-bolic events by CWT, using multiple configurations, and compare its performance with STFT.
The WF signal simulator, introduced in Chapter 2, was used to generated the MCA signals to be studied. The addition of embolic events is an add-on module, which although external to the simulator extends its functionality. The add-on module is part of the work developed and thus reported in Chapter 3. The addition of emboli involved the use of a commonly referred metric, the measured embolic power (MEP). Reverse calculation was used to add the emboli with the desired power to be expected from the detection phase.
The signal processing phase comprises the usage of the spectral estimation methods. STFT, the time-frequency method, and CWT, the scale-frequency method, were configured aiming at comparability between the methods. Besides the spec-tral estimation, also specspec-tral parameters were calculated, namely the maximum and mean frequencies, bandwidth and power variation over time. The latter is the relevant spectral parameter for this work, as it is later used in the detection phase of the framework. The remaining parameters were included in the calculations as they will be necessary in later stages of the work towards the characterization of the detected embolic events. Remembering that the computation of the signals