Universidade do Algarve
Departamento de Ciências Biomédicas e Medicina
Evaluation of pEPI-1 and pEPito
expression systems for gene
transfer to the retina
Sofia de Amaral Melo Calado
Mestrado em Ciências Biomédicas
Universidade do Algarve
Departamento de Ciências Biomédicas e Medicina
Evaluation of pEPI-1 and pEPito
expression systems for gene
transfer to the retina
Dissertation Supervised by: Prof. Dra. Gabriela Silva
Sofia de Amaral Melo Calado
Mestrado em Ciências Biomédicas
ii
Agradecimentos:
Eu gostaria de agradecer…
…à minha orientadora, Prof. Dra. Gabriela Silva por toda a disponibilidade e apoio que demonstrou ao longo de todo este último ano e, acima de tudo pela oportunidade que me deu de estar no laboratório.
…à Ana Vanessa Oliveira, aluna de doutoramento, que me iniciou no trabalho de laboratório, ensinando-me as técnicas necessárias à sua realização, e que se mostrou sempre disponível para tudo o que precisei.
…a todos os meus outros colegas de laboratório, Andreia, Susana, Eduardo e Solé pelo bom ambiente de trabalho e espírito de entreajuda que me proporcionaram.
…a todos os laboratórios e colegas do CBME.
…a todos os meus amigos que, mesmo sem saberem, tiveram uma contribuição enorme na realização deste trabalho.
…à Iris e ao Rafa, por me terem aturado naqueles dias em que nem eu própria me conseguia aturar.
…a toda a minha família que, mesmo estando longe esteve sempre perto para tudo o que eu precisei, apoiando-me incondicionalmente em todas as minhas decisões.
iii
Abbreviations:
AAV – Adeno-Associated Virus AC – Auxotrophy Complementation
AGEs – Advanced Glycation End-products AMD – Age-related Macular Degeneration Amp – Ampicillin
bp – base pair
BRB – Blood-Retinal-Barrier BSD – Blasticidin
CNTF – Ciliary Neurotrophic Factor CMV – Citomegalovirus
CO2 – Carbon dioxide
CpG – Cytosine-Guanine dinucleotide
CRALBP – Cellular retinaldehyde-binding protein DAPI - 4',6-diamidino-2-phenylindole
DMEM – Dulbecco’s Modified Eagle Medium DNA – Deoxyribonucleic acid
d.p.i – Days post injection DR – Diabetic Retinopathy E. coli – Escherichia coli
eGFP – enhanced Green Fluorescent Protein FBS – Fetal Bovine Serum
FDA – Food and Drug Administration gc/mL – genome copies/mL
GCL – Ganglion Cell Layer GFP – Green Fluorescent Protein
GDNF – Glial cell-derived neurotrophic factor hCMV – humanized CMV
HEK293 – Human Embryonic Kidney cells IgG – Immunoglobulin G
INL – Inner Nuclear Layer IPL – Inner Plexiform Layer LacOs – Lactose Operator sites LCA – Leber's Congenital Amaurosis Luc – Luciferase
iv MC – Minicircle
mCpG – methylated CpG
MIDGE – Minimal Immunogenically Defined Gene Expression MP – Mini Plasmid
mRNA – messenger RNA ms – milli seconds
MTT – 3-(4,5-Dimethylthiazol-2-yl)-2,5-diphenyltetrazolium bromide NLS – Nuclear Localization Signal
OD – Optic Density ON – Over Night
ONL – Outer Nuclear Layer OPL – Outer Plexiform Layer ORI – Origin of Replication
ORT – Operator-Repressor Titration PBS – Phosphate Buffer Saline pDNA – plasmid DNA
PEDF – Pigment Epithelium-Derived Factor
pFAR – plasmid Free of Antibiotic Resistance gene PKC – Protein Kinase C
PP – Parental Plasmid PR – Photoreceptors
PSK – Post-Segregational Killing RAS – Renin-Angiotensin System RNA – Ribonucleic Acid
RNAi – RNA interferance RP – Retinitis Pigmentosa
RPE – Retinal Pigmented Epithelium rpm – rotations per minute
S/MAR – Scaffold/Matrix Attachment Region SV40 – Simian virus 40
thyA – thymidylate synthase A gene TLR9 – Toll-Like Receptor 9
VEGF – Vascular Endothelium Growth Factor
v
Abstract
In this work we have tested the efficiency of enhanced plasmids, based on pEPI-1 and pEPito backbones, for retinal gene expression. These plasmids contain a number of modifications to enhance the duration of gene expression, such as 1) a matrix attachment region sequence to permit replication as episomal particle, 2) lower CpG content, to avoid silencing of the plasmid and 3) different promoters, including a tissue-specific promoter, RPE65, for targeted expression for RPE cells.
For this purpose, we have transfected three different cell lines: HEK293 and two human RPE cell lines (D407 and ARPE-19) and our results, obtained by flow cytometry, show that plasmids with the tissue-specific RPE65 promoter have lower transfection efficiencies compared with plasmids containing either CMV or hCMV promoter. Despite the lower transfection efficiency observed for the plasmids containing the RPE65 promoter, these can originate stable transfected colonies that are able to maintain the plasmid during, at least, 32 days.
When injected in postnatal retinas of C57Bl6 mice, GFP expression was sustained for at least 32 d.p.i for all tested plasmids, including the one with the RPE65 promoter.
This study shows that this type of plasmids, containing S/MARs, lower CpG content and strong promoters may be a good system for gene transfer to the retina because they are able to maintain the transgene expression for a prolonged period of time.
vi
Resumo
O objectivo de estudo do nosso laboratório é o desenvolvimento de vectores não virais para a terapia génica ocular.
O principal objectivo da terapia génica é a introdução de material genético no interior das células. Em teoria, o veículo ideal para a terapia génica é aquele que consegue penetrar eficientemente a membrana celular e libertar o material genético, sem desencadear uma resposta imunológica agressiva.
Os vectores virais são os mais utilizados actualmente em terapia génica. Estes são eficientes mas apresentam algumas limitações. Os vectores não virais podem ser uma alternativa aos vectores virais quando for possível ultrapassar a sua principal desvantagem: níveis de expressão muito baixos. Existem três razões que contribuem para esta baixa expressão: i) capacidade do vector entregar o material genético no núcleo; ii) os plasmídeos não terem capacidade de se replicar durante a divisão celular; e iii) por serem de origem bacteriana, os plasmídeos contêm inúmeros motivos CpG não metilados no seu backbone, que são detectados pelo sistema imunitário, o que leva a um silenciamento do vector. O desenvolvimento de plasmídeos capazes de se multiplicaram aquando da divisão celular e que contenham o menor número possível de motivos CpG poderá ter a máxima importância para uma terapia génica não viral eficaz.
No sentido de desenvolver vectores não virais, no nosso laboratório existem duas vertentes de trabalho: i) manipulação de polímeros para construção do veículo de transporte ideal e ii) utilização de sistemas de expressão para tentar optimizar a terapia génica baseada em vectores não virais, onde se enquadra o presente trabalho. Neste trabalho testámos a capacidade de plasmídeos baseados em dois backbones diferentes, pEPI-1 e pEPito, expressarem genes em células da retina. Estes plasmídeos contêm i) uma sequência (S/MAR) que permite a replicação do plasmídeo durante a mitose; ii) um baixo conteúdo em motivos CpG, no caso dos plasmídeos baseados no plasmídeo pEPito, impedindo assim o silenciamento do vector; e, por fim, iii) diferentes promotores, entre os quais um promotor específico da retina, RPE65, de modo a conferir uma expressão em células específicas da retina.
Começámos por realizar ensaios de transfecção e para isso utilizámos três linhas celulares diferentes: HEK293 (como controlo de transfecção, uma vez que é uma linha celular muito bem estabelecida e fácil de transfectar), e duas linhas celulares humanas de epitélio pigmentar da retina: D407 e ARPE-19. Os resultados do ensaio de transfecção, obtidos por citometria de fluxo, mostram que os plasmídeos contendo o promotor específico RPE65 dão origem a uma eficiência de transfecção
vii mais baixa quando comparada com aquela obtida utilizando os plasmídeos com o promotor CMV ou hCMV.
Uma vez que estes plasmídeos contêm S/MARs, capazes de promover a replicação epissomal dos vectores em células mitoticamente activas, nós testámos a capacidade destes vectores formarem colónias estavelmente transfectadas. Para isso, as células D407 foram transfectadas com três plasmídeos que continham resistência à blasticidina (BSD): i) pEPito-CMV-eGFP-BSD; ii) pEPito-hCMV-eGFP-BSD e iii) pEPito-hCMV/RPE65-eGFP-BSD. Apesar de não nos ter sido possível obter um número exacto do número de colónias formadas, pudemos constatar que, no final da experiência, o plasmídeo que deu origem a um maior número de colónias foi o hCMV-eGFP-BSD, seguido do CMV-eGFP-BSD e por fim do pEPito-hCMV/RPE65-eGFP-BSD, que foi o plasmídeo que deu origem a um menor número de colónias estáveis. Assim, podemos concluir que apesar da baixa eficiência de transfecção do plasmídeo contendo o promotor RPE65 nas linhas celulares testadas, as células D407 transfectadas com este plasmídeo foram capazes de formar colónias estáveis, durante pelo menos 32 dias.
Posteriormente decidimos testar estes plasmídeos in vivo. Para isso, realizámos injecções intravítreas de cada um dos plasmídeos e avaliámos a expressão de GFP em 5 tempos pós injecção diferentes: 3, 7, 14, 21 e 32 dias após a injecção. Quando injectados em retinas de ratinhos C57Bl6, os plasmídeos deram origem a uma expressão que GFP que foi mantida por, pelo menos, 32 dias. Isto foi verificado para todos os plasmídeos, até mesmo para o pEPito-RPE65-eGFP:Luc, cuja sua expressão in vitro não tinha sido verificada.
Este trabalho demonstra que este tipo de plasmídeos, contendo S/MARs, baixo conteúdo em dinucleótidos CpG e promotores constitutivos podem ser utilizados como sistemas de expressão de genes na retina porque estes plasmídeos são capazes de manter a expressão durante um período de tempo prolongado, tanto in vitro como in vivo.
viii Index: Agradecimentos………ii Abbreviations………..………..iii Abstract………...………....v Resumo………...vi Index………..viii 1. Introduction………..…….……….1 1.1. Gene therapy.………1
1.2. The use of re-engineered plasmids for gene therapy...………..3
1.2.1. Minicircle: a plasmid devoid of bacterial backbone….……….………....4
1.2.2. MIDGE vectors……….………..6
1.2.3. pFARs: plasmids Free of Antibiotic Resistance gene.……….7
1.2.4. pEPito: a promising non-viral vector for gene therapy.………8
1.3. The eye as a target for gene therapy……….……….10
1.3.1. Retina and retinal diseases……….………...11
1.3.1.1. Retinitis Pigmentosa – photoreceptors affecting disease….……12
1.3.1.2. Diabetic Retinopathy………..….14
1.4. Purpose of the work……….…..17
2. Materials and Methods………...18
2.1. Materials………...18
2.1.1. Plasmids………....18
2.1.2. Cell lines………....18
2.1.3. Maintenance and propagation of cells………..19
2.2. Methods………....19
2.2.1. Preparation of E. coli GT115 competent cells by calcium chloride (CaCl2) method………..19
ix
2.2.2. Preparation of LB agar plates………....19
2.2.3. Bacterial transformation………..20
2.2.4. Plasmid extraction and restriction analysis..………20
2.2.5. Transfection assay and flow cytometry analysis……….20
2.2.6. Colony-forming assay……….20
2.2.7. Intravitreal injection of pEPI-1 and pEPito vectors in C57Bl6 mice….21 2.2.8. Analysis of GFP expression in the retina of C57Bl6 animals…………22
2.2.9. Statistical analysis………22
3. Results and Discussion………...23
3.1. Plasmid propagation and restriction analysis……….23
3.2. Transfection efficiency and GFP expression………..27
3.3. Colony-forming assay in RPE cells………..37
3.4. Intravitreal injection and expression in the mouse retina……….40
4. Conclusions……….45
5. Future Work……….47
1
1. Introduction:
1.1. Gene Therapy:
The principle of gene therapy involves intracellular delivery and expression of exogenous DNA. This approach can either block a dysfunctional gene or deliver a functional copy of a gene, to treat genetic diseases [1]. Gene-based therapies have several advantages over those using conventional drugs, since once inside the cell genes are capable of being expressed for longer periods of time, thus prolonging the therapeutic effect. Gene therapy allows one to manipulate the genome and treat diseases caused by genetic defects [2]. Moreover, at their root, the therapy could be targeted and regulated using specific promoters and regulatable systems controlled by agents such as antibiotics and other drugs [3].
In theory, the ideal vehicle for gene therapy should penetrate the cell membrane and efficiently deliver genes to target cells, without being toxic or immunogenic. The genes must be directed to the nucleus and integrate the host genome in a non-mutagenic way or be maintained as an episome for a long time. It is also desirable that the corrective gene is delivered to both mitotic and no post-mitotic cells, and finally, it should be easily manufactured [4, 5].
Nowadays, the most common vectors used in gene delivery are viral vectors. Some examples are adeno-associated virus, adenovirus and lentivirus [5]. Viruses present a wide range of advantages: i) they can incorporate DNA very efficiently; ii) can infect cells and some viruses have tropism for certain cell types, allowing the therapy to be targeted and iii) have high transgene expression [1, 3]. On the other hand, i) some virus stimulate a strong immune response; ii) can cause mutation due to genomic integration and iii) the size of inserted transgene is limited [1, 3]. For these reasons, there is a great interest in developing non-viral strategies that can be an alternative to viral vectors. These include the development of nanoparticles as carriers for DNA, and optimization of plasmid for enhanced gene expression.
There are different types of non-viral systems used for gene delivery, including cationic lipids, polymers, dendrimers and peptides [6]. They promote the complexation of DNA by electrostatic interactions between the negative charge of DNA (conferred by the phosphate groups) and the positive charge of the material that are usually amine groups. These kinds of carriers protect the DNA from endonucleases and have the advantage of being biocompatible and able to be produced in large-scale [6, 7]. Apart from the use of nanoparticles, many other physical manipulations have been developed
2 to improve naked DNA delivery, as electroporation, gene gun, ultrasound and hydrodynamic injection [7]. These, however, have limitations such as depth of penetration and can cause undesirable side effects.
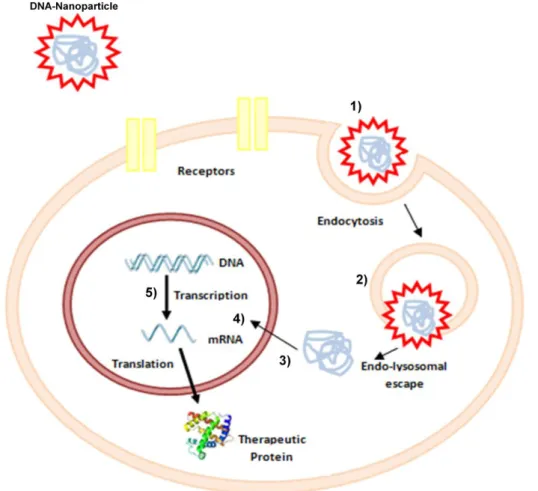
Before the gene of interest is expressed, DNA should overcome three main barriers as depicted in Figure 1.1:
Cross the plasma membrane: DNA is an anionic molecule and cannot cross the also negatively charged cell membrane [8]. The use of nanoparticles as carriers can minimize this problem, promoting cellular uptake by endocytosis. Once inside the cell, the carrier is localized in endosomes that could be “re-fused” with the cell membrane, releasing their contents to the exterior of the cell (exocytosis), or be targeted to lysosomes for degradation. By then, the vector should be able to disrupt the lysosome and release the DNA [9].
Cross the cytoplasm: the cytoskeleton limits the plasmid transport to the nucleus because of mechanical resistance [8].
Cross the nuclear membrane: the simplest way to direct DNA to the nucleus is during mitosis, when there is a breakdown of the nuclear membrane. However, it can cross the nuclear membrane by simple diffusion throughout nuclear pores, or by facilitated diffusion, through the action of nuclear pore complexes. But the nuclear pore has a small diameter, in which only small size fragments (about 100 nanometres) can cross it [8].
The use of DNA plasmids (pDNA) for gene therapy is very advantageous because they can be easily produced in large-scale and seen do not trigger the concern associated with viral vectors. However, they have shorter transgene expression [10]. The later is the main limitation and the reason of the interest in optimizing plasmids, in order to i) enhance pDNA uptake by the cells; ii) enhance its transport from cytoplasm to the nucleus; iii) control the level of gene expression; iv) extend the time of expression and v) eliminate the undesired immune response to the transgene [10].
3
1.2. The use of re-engineered plasmids for gene therapy:
As stated before, the use of pDNA may be an alternative to treat several diseases with a genetic basis. Nevertheless, as was mentioned before, pDNA has a short transgene expression, in part due to the silencing of the vector.
In a general way, pDNA can be divided into two different parts, the transcription cassette and the bacterial backbone. The transcription cassette carries the target gene and its regulatory elements, like the promoter and enhancers. The bacterial backbone contains all the machinery required for bacterial propagation, such as origin of replication (ORI) and antibiotic resistance gene, both which contain unmethylated CpG motifs [10]. A CpG motif is a cytosine monophosphate (C) residue followed by a guanine monophosphate residue (G) present in a nucleotide sequence [11]. CpG
Figure 1.1. Cellular barriers to gene transfer. DNA protected by a cationic nanoparticle enters into the cell by endocytosis (1). Once inside the cell, the complex DNA-Nanoparticle should escape lysosomal degradation (2), cross the cytoplasm (3) and the nuclear envelope (4) and finally gain access to the cellular transcription machinery (5).
4 dinucleotides are present in a high percentage in the bacterial backbone and are usually unmethylated, but in the genome of eukaryotic cells, the content of CpG motifs is lower and they are usually methylated, giving rise to 5-methyl-cytosine (mCpG) [10, 11]. These causes the unmethylated sequences to be recognized as “non-self”, activating the innate immune system, by binding to Toll-like receptor 9 (TLR9) of antigen-presenting cells. The binding of CpG motifs to TLR9 leads to an inflammatory response that includes the activation of B and T cells, monocytes, macrophages and natural killer cells [10, 12]. While this stimulation of immune system induced by CpG motifs could be useful for vaccination purposes, it is not desirable for gene therapy [10]. Therefore, the use of pDNA devoid of bacterial elements, like minicircles, minimalistic immunogenically defined gene expression (MIDGE) vectors and plasmids free of antibiotic resistance markers (pFARs), has been developed in order to overcome the drawbacks of bacterial DNA plasmids.
1.2.1. Minicircle: a plasmid devoid of bacterial backbone
Minicircles are supercoiled recombinant DNA molecules that just contain the therapeutic expression cassette. They were first described in 1997 by Darquet et al [13]. Since 1999 [14], minicircles have been extensively used as vector for gene therapy as described in references [14-24]. In all these studies, minicircles originated higher transgene expression than parental plasmid.
To originate minicircles, the expression cassette present in the parental plasmid (PP) is flanked by two recombinase recognition sequences. Inside the bacterial cell, the expression of the specific recombinase results in the removal of all the DNA sequences located between the recombinase recognition sequences. This recombination process originates two supercoiled molecules derived from PP: i) a minicircle (MC) molecule, which contains the therapeutic expression cassette and ii) a miniplasmid (MP) that carries the undesired bacterial backbone (Figure 1.2) [10].
The yield of minicircles is highly affected by the recombination technique used. The first type of site-specific recombination strategy uses bacteriophage λ integrase, but the yield of recombinated plasmid is low [13, 14]. Other recombination strategy is mediated by the Cre loxP system [25]. However, this recombination process can be bidirectional and reversible, leading to the production of unwanted PP, miniplasmids and concatamers [10].
5 Another recombination process uses phage Phi31 integrase to catalyze recombination and produce minicircles [16]. The advantage of this type of recombination mediated by phage Phi31 integrase is that it is strictly unidirectional, thus avoiding the production of concatamers [10].
After the recombination step, the molecule of interest, the minicircle, needs to be purified. Initially, purification was done through using a two-step procedure, in which the PP and miniplasmid were linearized with restriction enzymes and the minicircle was then separated via ultracentrifugation in a cesium chloride gradient [13, 14]. There are major disadvantages to this method, such as the low yield of minicircle, high costs of restriction enzymes and labor intensive procedure associated to the cesium chloride ultracentrifugation [26]. To overcome this issue, Chen and his group developed a strategy in which there is a coexpression of an endonuclease that degrades the remaining PP and miniplasmid, into the bacteria [26]. After that, the minicircle is simply purified by a commercial affinity column [26]. In 2008, Mayrhofer and coworkers described a new approach based on protein-DNA interaction, that could produce minicircles in large scale [27]. This approach is based on affinity chromatography in which short recognition sites are integrated in the PP at a position that is located on the minicircle after the recombination. The minicircle contains a tandem repeat of mutated lactose operator sites (LacOs) that can specifically and reversibly bind to the
Rec
Rec
Promoter MC
Rec
Figure 1.2. Schematic illustration of the production of minicircle. After the recombination process, the parental plasmid originates a minicircle (MC) and miniplasmid (MP). Rec, recombination sequence; Ori, origin of replication; Amp, ampicillin resistance gene.
Recombination Amp. MP Ori Transgene Amp. Poly-A Tail Ori Rec Promoter Transgene Parental Plasmid
6 chromatography matrix carrying the corresponding repressor protein of the lactose operon, the LacI protein. Only the minicircles containing these recognition sites can bind to the matrix, enabling its separation from other DNA lacking such sites [27].
1.2.2. MIDGE vectors:
MIDGE vectors are linear molecules containing just a promoter, a transgene and a RNA-stabilizing sequence, flanked by two hairpin oligonucleotide sequences, arranged in a covalently closed dumbbell-shaped molecule [28, 29]. They are obtained from the enzymatic digestion of a plasmid DNA and subsequent ligation of the resulting fragments to hairpin oligonucleotides (Figure 1.3).
Promoter Ori Amp. Poly-A Tail Plasmid Transgene Enzymatic digestion ACTG
ACTG Promoter Transgene Poly-A Tail
Figure 1.3. Schematic illustration of MIDGE vectors. MIDGE vectors are obtained from enzymatic digestion of the plasmid and posterior ligation of hairpin oligonucleotides.
7 After that, MIDGE vectors are purified by anionic exchange column chromatography [29]. Like minicircles, MIDGE have some advantages over “traditional” plasmids: i) small size, ii) absence of an antibiotic resistance gene and iii) low content of CpG motifs [28]. Hairpin oligonucleotides present in MIDGE are able to anchor molecules such as peptides, proteins or sugars to DNA [8].
Examples of molecules that could be added to MIDGE vectors are nuclear localization signals (NLS) peptides, in order to target the DNA to the nucleus [28].
1.2.3. pFARs: plasmids Free of Antibiotic Resistance gene
Although minicircles and MIDGE vectors have no antibiotic resistance genes, the parental plasmid that originates those vectors is produced by dividing bacteria in the presence of antibiotics. Besides unmethylated CpG motifs, the use of antibiotic resistance genes can contribute to the appearance of multidrug-resistance organisms [30]. For that reason, plasmids free of antibiotic resistance genes (pFAR) were developed. There are several systems to replace antibiotic resistance gene, like auxotrophy complementation (AC), post-segregational killing (PSK) and operator-repressor titration (ORT) [31].
The AC system is based on an auxotrophic strain (obtained by mutation) for a crucial metabolite, such as a mutation in thyA gene that encodes for the thymidylate synthase, an enzyme necessary for DNA precursor synthesis [30, 31]. Auxotrophy can be overcome by adding the exogenous metabolite to the growth medium [30]. In the absence of the specific metabolite, only the stains that have the plasmid encoding a t-RNA allowing the translation of the metabolite can grow [30]. The PSK system is dependent of equilibrium between toxin and antitoxin encoded by genome and plasmid, respectively. If a cell loses the plasmid, the antitoxin will be degraded and the cell will be killed by the toxin encoded by their genome. However, this kind of system is unable to maintain the plasmid during long-term bacterial culture [31]. Finally, the OTR system uses plasmids with lac operator sequences that encode a repressor bound to an essential promoter or operator region [30]. In the case of plasmid loss, there is no expression of the repressor and this leads to the death of the bacteria [31].
8
1.2.4. pEPito: a promising non-viral vector for gene therapy
One of the major disadvantages of gene therapy using non-viral plasmid-based systems is their loss during mitosis, due to the their inability to replicate in mammalian cells [32]. Some viral-vectors have the ability to replicate their genomes episomaly in some eukaryotic cells, and this replication is dependent of the interaction with virally encoded trans-acting factors. An example is the replication of the SV40 virus, which requires a viral protein, called large T-antigen. But the presence of these viral elements can induce immortalization and tumor formation in transfected mammalian cells [33].
A newly engineered non-viral vector, pEPI-1, was created by Piechaczek and coworkers and seems to be an alternative for gene transfer in mammals, allowing a stable maintenance in cells for about 100 generations [33]. In pEPI-1, the gene coding for the SV40 T-antigen was replaced by the scaffold/matrix attachment region (S/MAR or MARS) from the 5’-region of the human interferon β-gene [33]. S/MARs are AT-rich DNA elements that anchor chromosomal loops to the nuclear matrix. They are usually found at the borders of chromatin domain, either in nontranscribed regions or within transcription units (close to promoters, enhancers and ORIs), but not in coding regions, suggesting they may act to link those regions to matrix-bound DNA/RNA enzymatic machineries [34, 35].
S/MARs seem to be involved in DNA duplex destabilization and strand opening, which suggests that S/MARs can be involved in DNA replication and gene expression [35]. The transition from the double stranded state to open stranded is required for replication and transcription [35].
Some viruses, such as the SV40 virus, contain S/MARs in their genome, which are part of the large T-antigen coding region. Without S/MARs, the virus is unable to maintain the episomal status for a long period of time [34].
Additionally, S/MARs-containing vectors are able to prevent epigenetic silencing by shielding the transgene sequence from adjacent regulatory sequences and heterochromatinization. This feature allows the maintenance of the vector in a transcriptionally active state, conferring mitotic stability [32]. S/MARs also mediates the association of the episome with the metaphase scaffold and facilitate the use of the centromere of the host cells [34].
The original pEPI-1 vector contains two mammalian transcription units and a total of 305 CpG motifs, most of them located in the elements of the vector required for bacterial propagation. In order to reduce the CpG content in pEPI-1’s bacterial backbone and obtain increased transgene expression in vitro and in vivo, a new non-viral vector, named pEPito, was created [11]. pEPito was constructed by cloning the
9 pEPI-1 plasmid replicon in a plasmid backbone lacking CpG motifs and excluding the second transcription unit [11].
Vectors based on the backbone of the pEPI-1 present a pUC ORI for bacterial proliferation, a S/MARs sequence and second transcription unit for bacterial or mammalian selection purposes. Ultimately, the pEPI-1 backbone has 206 CpG motifs. The backbone of pEPito includes a R6K ORI for bacterial production, β-lactamase gene for bacterial selection, a S/MARs sequence and has no second mammalian transcription unit (Figure 1.4). Thus, pEPito contains only 37 CpG motifs [11]. These plasmids, containing a CpG-rich transcription unit in a CpG-depleted bacterial backbone, seem to show similar expression patterns to minicircles and other CpG-free plasmids [11].
Haase et al [11] tested different pEPito constructs, in vitro and in vivo, and compared the results with the ones for pEPI-1 constructs. In all in vitro studies, the pEPito based vector shows better results than those for the pEPI-1 vector using HEK293 and NIH3T3 cell lines [11]. The same results were observed in vivo: fourteen days after hydrodynamic injection of pEPI-1 and S/MAR-free pEPito, almost no luciferase expression was observed in the liver [11]. On the other hand, the animals injected with pEPito containing S/MAR have shown luciferase expression up to thirty-two days post-injection [11].
B) A)
Figure 1.4. pEPI-1 (A) and pEPito (B) vectors. Vectors based on pEPI-1’s backbone contain two transcription units and 206 CpG motifs. Vectors based on pEPito’s backbone contain only one transcription unit and 37 CpG motifs.
pEPito pEPI-1
10
1.3. The eye as a target for gene therapy:
The eye is an attractive target for gene therapy. Due to the eye relative small size, it is only necessary a small amount of a drug to obtain a significant therapeutic effect. The eye also contains different cell types (Figure 1.5), allowing a targeted therapy based on vector’s tropism [36].
It is an accessible and immune-privileged organ because it possesses a blood-retinal-barrier (BRB) that prevents the diffusion of substances from the blood to the retina and vice-versa. This is of great importance for gene therapy, since it means that inflammatory reactions towards the vector will not be an issue [36, 37]. The feature of the BRB is an advantage for eye gene therapy; however it is also one of the major barriers for delivery to treat ocular diseases, because systemic administration of the therapeutic agent is not effective. After systemic administration, only 1-2% of the drugs arrive at retinal pigment epithelium (RPE) and neural retina [37]. Similarly, topical administration of drugs, such as drops or ointments, is also inefficient for retinal gene/drug delivery to the retina because of the limited penetration of the cornea and diffusion through the vitreous humor to reach the retina is against the normal flow of the aqueous humor [1, 37]. Thus, subretinal and intravitreal injection are most commonly used for retinal gene delivery in vivo [1, 37]. Injection into the subretinal space allows for an increased contact time between the injected DNA and the retinal layers. However, the contact area is restricted to the local of the injection, it can induce lesions in RPE cells and causes retinal detachment, limiting the amount of liquid that can be injected. Intravitreal injection is less invasive than subretinal injection but does not allow for efficient targeting of the outer retina, closer to the sclera. The major drawback of prolonged treatment of chronic diseases that require repeated injections is that it can induce infections and retinal detachment [1, 37].
11
1.3.1. Retina and retinal diseases:
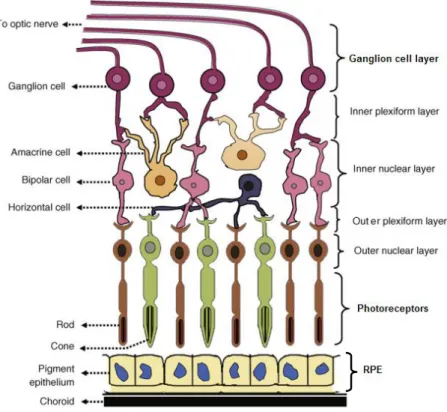
The retina is the most metabolically active tissue of the human body, with a fast rate of glucose and oxygen consumption [38]. It is the sensory tissue that lines the back of the eye and it consists of seven layers, composed mainly by three cell types (Figure 1.5) [1, 37]:
Photoreceptors (cones and rods): rods are responsible for low-light vision and are located throughout the peripheral retina. By contrast, cones are located at the central part of the retina (macula) and are responsible for central and color vision [1].
Neural cells (ganglion cells): are the output neurons. The axons of ganglion cells, that constitute the optic nerve, transmit the visual information from the retina to the brain [1].
Retinal pigment epithelium (RPE): responsible for light absorption, epithelial transport, ion homeostasis, visual cycle, phagocytosis, secretion of
Figure 1.5. Schematic representation of the retina, showing the seven layers of the retina and the cells types present in these layers. Adapted from [1]
12 neurotrophic factors and immune response. The RPE should be able to defense efficiently the retina against free radicals, photo-oxidative exposure and light energy [39].
Retinal diseases are good targets of ocular gene therapy because in most cases the genetic etiology is known and there is easy access to the photoreceptors or the RPE by subretinal injection [40].
Diseases affecting the retina, like glaucoma, retinitis pigmentosa (RP) and age-related macular degeneration (AMD) are blinding disorders that are influenced by genetic and environmental factors. Altogether contribute to more than 25% of blindness cases [1]. Another retinal disease that has been showing a huge impact on developed civilizations is diabetic retinopathy (DR) due to the worldwide number of persons with diabetes mellitus [41]
The fact that the current treatment for these diseases is ineffective makes them ideal targets for gene therapy [1].
1.3.1.1. Retinitis Pigmentosa:
Retinitis pigmentosa is family of inherited retinal diseases characterized by progressive degeneration of the photoreceptors with subsequent degeneration of the RPE [42]. The term RP comprises a wide spectrum of disorders with a varied chromosomal, metabolic and morphologic feature, in which Leber Congenital Amaurosis (LCA) is the most common form of RP, leading to visual impairment in children [42, 43]. The genetics of RP is varied. The inheritance modes include autosomal dominant, responsible for 15-20% of all RP cases; autosomal recessive that counts for 20-30% of cases and is most the frequent inherited type of RP; and X-linked recessive is the least common inherited type, occurring in 6-10% of the cases. Rarer forms of RP also exist, including digenic RP (when mutated genes for RP occur in two different chromosomes), mitochondrial RP and X-linked dominant RP [40, 42]. At least 50 genes have been identified that are involved in the different forms of RP [44]. These genes encode proteins implicated in the rod phototransduction cascade, cytoskeletal and structural proteins, signaling and intracellular trafficking proteins [1].
In general, RP is confined to the eye. However, some times is associated with other systemic diseases, such as Usher syndrome (in which there is a congenital neurosensory hearing loss) and Bassen-Kornzweig syndrome (characterized by a malformation of the red blood cells with associated neuromuscular disturbance) [40, 42]. Usually, the rod-cone dystrophy is the most common form of RP, in which night
13 blindness is the first symptom and the peripheral visual field is progressively reduced [40].
Currently, the potential treatments for RP are diverse and include i) gene therapy to correct specific mutations, ii) cell transplantation to restore lost cells, iii) the use of drugs to help protect photoreceptors and iv) the use of neuroprosthetic systems to create visual perception [42].
As RP is an inherited disease, gene therapy can be easily used as a therapeutic option. Depending on the inheritance form, different strategies are used:
Gene replacement, in the case of recessive forms [42];
Ribozymes, in autosomal dominant forms. In this case, the ribozymes are designed to cleave a mutant mRNA and reduce the amount of altered protein. Even if ribozymes do not eliminate all mutant mRNA, the reduction is sufficient to show positive results [42];
RNA interference (RNAi), that function in the same way that ribozymes, causing destruction of the mutant RNA [42]. RNAi is as potent as ribozymes, is less dependent on RNA secondary structure and does not need a specific sequence motif [40].
In cell transplantation stem cells and retinal cells can be used; however retinal cell transplantation is preferred over stem cells because they express specific retinal cell markers [42]. One of the major disadvantages of cell transplantation is the failure of transplanted tissue to form connections with the hosts’ neurons. In addition, the inflammatory reaction associated with the immunologic rejection is another disadvantage associated with cell transplantation [42].
Some neurotrophic factors, like ciliary neurotrophic factor (CNTF) and glial cell line-derived neurotrophic factor (GDNF) can be used as drugs, in order to protect photoreceptors from degeneration [40].
1.3.1.2. Diabetic Retinopathy:
With the increased survival of individuals with diabetes, diabetic retinopathy (DR) remains the major cause of vision loss in developed countries, affecting working-age adults [41].
Diabetic retinopathy is a specific microvascular complication of diabetes that leads to the neovascularization within the retina [37, 41]. The pathophysiology underlying diabetic retinopathy is yet unknown, but is believed that the chronic
14 exposure to hyperglycaemia and other risk factors, like hypertension, initiate a cascade of biochemical and physiological changes that originate microvascular damage and retinal dysfunction [41]. Many biochemical mechanisms have been proposed to be responsible for its pathogenesis, which the affect cellular metabolism, signaling and synthesis of growth factors. The mechanisms involved include the accumulation of sorbitol and advanced glycation end-products (AGEs), oxidative stress, protein kinase C activation (PKC), inflammation, upregulation of the renin-angiotensin system (RAS) and of VEGF [41, 45, 46]. Altogether, these biochemical mechanisms contribute to structural and physiological changes, including arteriolar dilatation, which in turn increases retinal capillary pressure. This increase in pressure leads to capillary wall dilatation, leakage and burst, contributing to the formation of microaneurysms, edema and hemorrhages (figure 1.6), respectively [reviewed in 14-16].
In a normal retina, RPE expresses a small amount of vascular endothelial growth factor (VEGF) and high levels of pigment epithelium-derived factor (PEDF), an anti-angiogenic molecule. Due to hypoxia during diabetes, the balance between pro- and anti-angiogenic molecules is disrupted, leading to up-regulation of VEGF and down-regulation of PEDF. As a consequence of this imbalance, there is the promotion of neovascularization and vision loss [37].
There are two types of neovascularization, in both of which VEGF has a crucial role:
Subretinal neovascularization (present in AMD) that arises when new vessels grow under the retina and/or RPE [47].
Retinal neovascularization (occurs in diabetic retinopathy and retinopathy of prematurity) that takes place on the inner surface of the retina and grow into vitreous, causing hemorrhages, scar tissue, retinal detachment and vision loss [47].
15 There are some strategies to prevent the progression of diabetic retinopathy, which include laser and surgical interventions. The most frequent treatment is laser-induced photocoagulation. The laser is used in order to treat retinal neovascularization, through alleviating ischemia and then prevent vision loss [37, 41]. However, laser photocoagulation is associated with serious risks, since laser treatment can cause damages to the retina itself, and does not stop the progression of the disease in all patients [37]. Vitrectomy is also used to treat complications of advanced retinopathy such as vitreous hemorrhage and retinal detachment. Through the removal of the vitreous, there is a reduction of the risk of retinal neovascularization and macular edema, but increases the risk of iris neovascularization and cataract [41].
Recently, other treatments are emerging and most of them have VEGF as target [41]. Three VEGF antagonists were approved by Food and Drug Administration (FDA) to treat AMD and are presently under investigation as a therapeutic for DR: Pegaptanib, Ranibizumab and Bevacizumab [37].
Pegaptanib is an RNA aptamer that acts binding VEGF165 isoform, the prevalent
isoform present in human eye and responsible for eye’s normal and pathogenic
Figure 1.6. Patophysiology of diabetic retinopathy. Hyperglycaemia and hypertension initiates a cascade of events that leads to retinal microvascular dysfunction.
16 neovascularization [48-50]. A 2006 clinical trial using Pegaptanib showed regression of neovascularization in patients with proliferative diabetic retinopathy [48, 51]. Ranibizumab is an anti-VEGF recombinant humanized monoclonal antibody fragment with specificity for all known isoforms of human VEGF: VEGF121, VEGF145, VEGF165,
VEGF189 and VEGF206 [48, 49]. Bevacizumab is a full-length humanized monoclonal
antibody that blocks VEGF at the same way of Ranibizumab [48]. Nevertheless, Bevacizumab has a half-time of only 17-21 days [49].
Other strategy that could be used is VEGF receptor (VEGFR) blockers [49, 52]. These blockers consist in the extracellular portion of VEGFR1 and VEGFR2 receptors that are attached to the Fc part of immunoglobulin G (IgG). It binds selectively to VEGF-A receptor and inhibit its interaction with VEGF-A ligand [49]. Other proteins, like endostatin, trombospondin and angiostatin, are able to inhibit endothelial cell differentiation and VEGF stimulation by inhibiting cell proliferation and migration, inducing endothelial cell-specific apoptosis and, due to this, these proteins can also be used as a therapeutic application [52].
17
1.4. Purpose of the work:
The purpose of this work was to test the capacity of vectors pEPI-1 and pEPito to express genes of interest in retinal cells, both in vitro and in vivo. For this purpose we have used three different cell lines: Human Embrionic Kidney cells (HEK293) and two human RPE cell lines (D407 and ARPE-19); and we evaluated the transfection efficiency of each vector using flow cytometry. The tested vectors differ among them in terms of backbone and promoters, and were as follows:
pEPI-1 (with CMV promoter);
pEPito-CMV-eGFP (with CMV promoter);
pEPito-hCMV-eGFP (with human CMV);
pEPito-RPE65-eGFP:Luc (with a RPE-specific promoter RPE65 of mouse);
pEPito-hCMV/RPE65-eGFP:Luc (with an hCMV enhancer element and RPE-specific promoter RPE65 of mouse);
In order to evaluate the transgene expression profile along the time, in vivo, we also tested these vectors at five different time-points: 3, 7, 14, 21 and 32 days post-injection (d.p.i). For this we have injected, intravitreally, the vectors tested in vitro in C57Bl6 mice at postnatal days between 3 and 5, and evaluated GFP expressionin sections of the retina, by fluorescence microscopy. As a control, we used a viral particle based on Adeno-Associated Virus with CMV promoter (AAV2.8-CMV-eGFP).
To evaluate the ability of our vectors containing S/MARs to be maintained in culture for long time, we performed a colony-forming assay using plasmids equivalent to the ones described above, but with a blasticidin (BSD) resistance gene. The plasmids used were:
pEPito-CMV-eGFP-BSD;
pEPito-hCMV-eGFP-BSD;
18
2. Materials and Methods:
2.1. Materials: 2.1.1. Plasmids:
In this study we used five different plasmid vectors that were kindly provided by Dr. Rudolf Haase from University of Munich.
We tested plasmids constructed with two different backbones: i) pEPI-1 and ii) pEPito. Plasmids with the backbone of pEPI-1 had a CMV promoter and kanamycin resistance gene. Plasmids with the backbone of pEPito had the ampicillin resistance gene and had four different promoters: a) a CMV promoter (pEPito-CMV-eGFP); b) an humanized CMV promoter (pEPito-hCMV-eGFP) that is supposed to be less affected by epigenetic silencing events [11]; c) a RPE promoter of mice (pEPito-RPE65-eGFP); and d) an hCMV enhancer element and a RPE promoter (pEPito-hCMV/RPE65-eGFP:Luc). RPE65 is a tissue-specific component of the RPE. It is highly conserved in vertebrates and has an important role in RPE/photoreceptors vitamin A cycle [53]. This promoter was already used to restore the vision in Briard dogs [54].
2.1.2. Cell lines:
In vitro experiments were performed in three different cell lines, HEK293, D407 and ARPE-19. We used HEK293 cell line as a transfection control, since it is a very well characterized and very easily transfected cell line. D407 and ARPE-19 are human RPE cell lines, which have been extensively used as in vitro models of RPE cells, since they retain their phagocytic capacity [55, 56].
The D407 cell line is derived from the eye of a 12 year-old male [55]. These cells are aneuploid (presents trisomy) [55], with a cobblestone-shaped morphology and presents RPE-specific markers such as Cellular Retinaldehyde-Binding Protein (CRALBP) [55] and RPE65 [57]. This is an immortal cell line that can be the result of the aneuploidy [56]. The D407 cells have a higher mitotic rate than the ARPE19 cells (personal observation).
The ARPE-19 cell line is derived from the normal eye of a 19 year-old male. It expresses the RPE-specific markers, RPE65 and CRALBP [56]. These cells are diploid and have cuboidal to columnar morphology, which is characteristic of epithelial cells [56]. Unlike D407 cells, ARPE-19 cells are able to produce pigment [56]. ARPE-19 cells have a doubling time of approximately 24 h [56].
19
2.1.3. Maintenance and propagation of cells:
We cultured the cells at 37 ºC, under a 5% CO2 atmosphere using the
appropriate medium (Annex I). When the cells reached 70-80% of confluence, we subcloned them. For the cell line subcloning, we removed the culture medium and we washed the cell monolayer with phosphate buffered saline (PBS, see Annex II). Then, we covered the monolayer with a 0.25% trypsin/EDTA (PAA) solution for 3 min after which we added medium to count the cells and split them into new T-flasks.
2.2. Methods:
2.2.1. Preparation of E. coli GT115 competent cells by calcium chloride (CaCl2) method:
The bacterial strain that we used in this study was E. coli GT115 (Invivogen), because they are able to use the R6K Ori present in pEPito vectors, unlike other bacterial strains.
The bacteria were grown in LB broth medium (Fluka), without antibiotic, overnight (ON) at 37 ºC and 250 rotations per minute (rpm). About 16 h later, we transferred 500 µL of the bacterial culture into 100 mL of LB broth medium (without antibiotic) and let bacteria grow at 37 ºC and 250 rpm. Approximately 3 h later, using 1 mL of bacterial culture measured the optic density (OD) at 600 nm. When the OD600 reaches 0.5, which corresponds to exponential the phase of bacterial growth, we stopped the culture, keeping it on ice for 10 min and we centrifuged the culture, in pre-chilled flasks, for 10 min, at 4 ºC and 4000 rpm. Then, discarded the supernatant and resuspended the bacterial pellet in 50 mL of 50 mM CaCl2, at 4 ºC. Next, we incubated
the bacterial suspension for 30 min, on ice, and then centrifuged it for 10 min, at 4 ºC and 4000 rpm. The supernatant was discarded and the pellet resuspended in 5 mL of 100 mM CaCl2 plus 14% glycerol, at 4 ºC. This bacterial suspension was incubated for
30 min, on ice, and divided in 100 µL aliquots for further storage at -80 ºC.
2.2.2. Preparation of LB agar plates:
For subsequent bacterial propagation, we prepared LB agar (Sigma) plates with either kanamycin (Sigma) for pEPI-1 vectors or ampicillin (Sigma) for pEPito vectors, at a final concentration of 100 µg/mL.
20
2.2.3. Bacterial transformation:
For bacterial transformation, we thawed aliquots of competent bacteria and kept them on ice. Then added 30 ng of each plasmid to 100 µL of competent bacteria suspension and incubated the mixture on ice for 15 min, followed by a heat shock at 42 ºC, for 90 sec. We added 300 µL of SOC medium (see annex II), at 37 ºC and we incubated the bacterial suspension for 30 min, at 37 ºC and 250 rpm. Thirty min later, we platted 100 µL of transformed bacteria in a pre-warmed LB plate, containing either kanamycin or ampicillin, depending on the bacterial selection marker, and we allowed them to incubate ON, at 37 ºC.
2.2.4. Plasmid extraction and restriction analysis:
The plasmids were extracted from the bacteria using the QIAprep® Spin Miniprep Kit or the QIAGEN® Plasmid Maxi Kit (QIAGEN), according to the manufacturer’s instructions.
We confirmed that the plasmids were as sent by Dr Rudolf Haase by restriction digestion and gel electrophoresis of the digested fragments.
2.2.5. Transfection assay and flow cytometry analysis:
We seeded 200 000 cells/well in a 6 well culture plate and after 24 h removed the medium and we proceeded with the transfection. We performed the transfection using 1 µg of plasmid and FuGENE® HD (Promega) as transfection reagent, according to the manufacturer’s instructions.
24 h after transfection, the fluorescence of the cells was visualized using an inverted fluorescence microscope (Leica DMIL with a Leica DC500 camera).
48h after transfection, the cells were trypsinized, washed three times with PBS and analyzed in a FACSCalibur cytometer for expression of green fluorescent protein (GFP).
All the experiments were made in quadruplicates.
2.2.6. Colony-forming assay:
After flow cytometry analysis, the ability of D407 and ARPE-19 cell lines to form stably transfected colonies was evaluated. To evaluate this the cells were transfected with three different plasmids containing the blasticidin resistance gene (BSD; Sigma): i) pEPito-CMV-eGFP-BSD; ii) pEPito-hCMV-eGFP-BSD and iii) pEPito-hCMV/RPE65-eGFP:Luc-BSD.
21 % viable
cells
Since in the literature there were contradictory reports about the amount of BSD to use in such an assay for these cells in particular, we have firstly determinate the concentration of BSD needed to kill untransfected cells in one week. We decided to test six different concentrations of BSD: 10 µg/mL; 5 µg/mL; 3 µg/mL; 1 µg/mL; 0.1 µg/mL and 0.01 µg/mL. A 48 well culture plate was used to seed 15 000 cells per well and during one week, we replaced the medium containing antibiotic. One week after the start of the experiment we performed a colorimetric MTT [3-(4,5-dimethyl-2-thiazolyl)-2,5-diphenyl-2H-tetrazolium bromide] assay by added 25 µL of MTT solution (Sigma; 5 mg/mL in PBS 1x) to each well and incubate for three hours, in order for the cleavage of the MTT to occur. After this period, in wells containing live cells the formazan produced will appear as dark purple. After this incubation, we added 300 µL of a solution of Isopropanol/HCl (0.04 N HCl in Isopropanol) to each well. The HCl converts the phenol red in the culture medium to a yellow color, that will not interfere with the absorbance, and the isopropanol dissolves the formazan to give a homogeneous dark purple solution suitable for absorbance measurement. The absorbance was measured on a microplate reader (Tecan M200) at 570 nm and 630 nm. Formazan solution absorbs light at 550-570 nm but not at 620-650nm. 620-650 nm absorbency results from cell debris and well imperfections. Percentage of viable cells is expressed as:
= (absorbance treated wells / absorbance of control wells) x 100%
After evaluating the ideal concentration of BSD necessary to induce death in untransfected cells, we seeded 200 000 cells/well in a 6 well tissue plate and then transfected as described before (in section 2.2.5). 48 h after transfecting the cells were tripsinized and seeded in 10 mm Petri dishes with the appropriate concentration of BDS, determined by the MTT test described above. We maintained the cells for 32 days, replacing the culture medium every two days.
2.2.7. Intravitreal injection of pEPI-1 and pEPito vectors in C57Bl6 mice:
To test the efficiency of transfection in vivo, we injected the plasmids into the eye of C57Bl6 mice pups. For this, we prepared the sample by adding 2 µg of each plasmid to 30 µL of PBS 1x, with FuGENE® HD as the transfection reagent. The pups at postnatal age between 3 and 5 days (P3-P5) were anesthetized on ice. One the animal was anesthetized the still shut eyelid at this postnatal stage was opened with a
22 Dummond #5 forceps. The eye was gently removed from the eye socket to allow for easier access and, using a 31G needle, we puncted the sclera in the temporal side. Using a Hamilton syringe with a 33G needle, we injected 1 µL of the sample into the vitreous space. After the injection a topical ointment consisting of gentamicin and prednisolone acetate was applied to reduce the risk of infaction and pain. Finally, the pups were returned to the nursing dams.
As a control, we used an AAV viral particle carrying GFP as a reporter gene AAV2.8-CMV-eGFP. We also injected 1 µL of virus sample, at a concentration of 1x10¹² gc/mL.
In this experiment, for each plasmid, we injected 5 mice per time-point and only one eye. The contralateral eye was used as a control.
2.2.8. Analysis of GFP expression in the retina of C57Bl6 animals: After intravitreal injection of each plasmid, we analyzed the GFP expression at five different time-points, 3, 7, 14, 21 and 32 d.p.i. To this, we sacrificed the animals, enucleated the eyes and immersed them in ice-cold 4% paraformaldehyde in PBS 1x (PFA; Electron Microscopy Sciences) for, at least, 24 h. After fixation in PFA the eyes were included either in OCT, for cryosection, or in paraffin. For cyosection, we immersed the eyes in 30% of saccharose, ON, and then we embedded them in OCT (TissueTek) and stored them at -80 ºC. For paraffin embedded eye’s, we washed them in PBS 1x, for at least 3 times, during 15 min. Since paraffin is insoluble in water, we dehydrated the eyes, in ascending concentrations of each ethanol. After that, ethanol was replaced by xylol (VWR) that is replaced by liquid paraffin (Merck). The samples are then included in paraffin blocks. Finally, the samples are sectioned in 10 µm thick serial sections, and mounted mowiol-based mounting media.
We analyzed the GFP expression using an Axio Imager Z2 Fluorescence microscope, with magnifications of 50x, 100x, 200x and 400x.
2.2.9. Statistical analysis:
Our data was analyzed using an ANOVA test to compare the mean values (SPSS statistic software). We used Duncan test to analyze the statistical significance considering P<0.05 value as significant.
23
3. Results and Discussion:
In this work we tested the capacity of vectors pEPi-1 and pEPito to express genes of interest in the retina. For this, we used five different plasmids that differ among them in terms of backbone and promoters and we evaluated the transfection efficiency of each vector in three different cell lines HEK293, D407 and ARPE-19, using flow cytometry and in vivo through injection in C57Bl6 mice.
3.1. Plasmid propagation and restriction analysis:
To make sure that no kind of recombination occurred during bacterial transformation, we decided to confirm the restriction map of all the plasmids that we were going to use throughout the entire work.
After bacterial transformation, we extract the plasmids using the QIAprep® Spin Miniprep Kit. Then, we confirmed the plasmids performing a digestion with restriction enzymes and visualized the digestion products using gel electrophoresis.
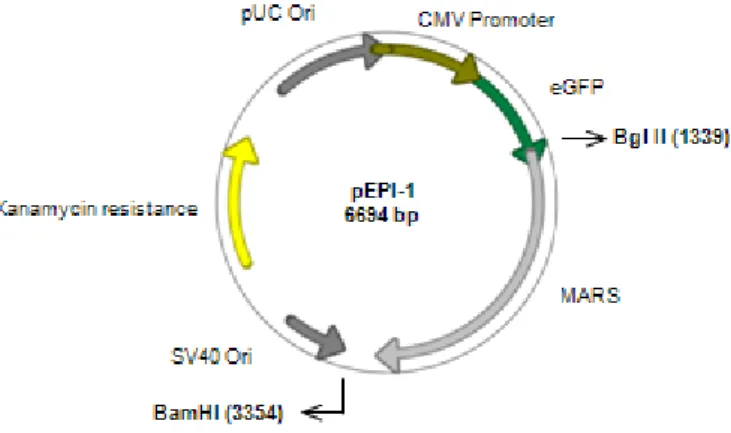
We confirmed the restriction map of pEPI-1 using BglII and BamHI (New England Biolabs) restriction enzymes that are single cutters for this plasmid (Figure 3.1).
The double digestion with Bgl II and BamHI originates two fragments, with 4679 bp and 2015 bp, which is according to the expected from the restriction map (Figure 3.2).
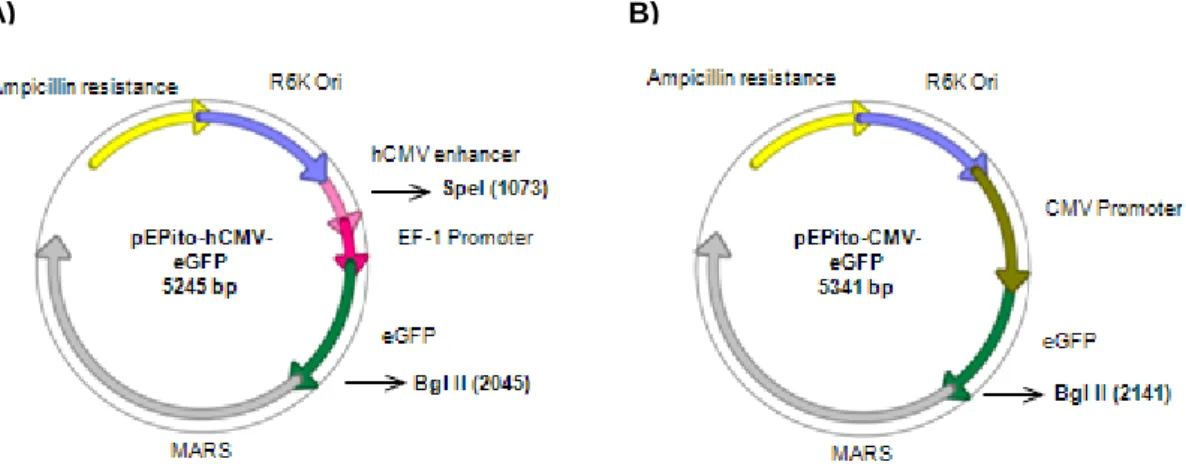
24 To confirm the restriction map of pEPito-CMV-eGFP and pEPito-hCMV-eGFP, we digested both plasmids with the restriction enzymes SpeI and BglII (Takara). The restriction site for SpeI is only present in pEPito-hCMV-eGFP, while the restriction site for BglII is present in both plasmids (Figure 3.3).
A) B)
Figure 3.3 – Restriction maps of pEPito-hCMV-eGFP and pEPito-CMV-eGFP with the restriction sites for SpeI and Bgl II.
Figure 3.2 – Digestion of pEPI-1. Lane 1 – 1kb DNA Ladder (New England Biolabs); Lane 2 – undigested pEPI-1; Lane 3 – pEPI-1 digested with Bgl II and BamHI;
1 kb 2 kb 5 kb 4 kb
25 As expected, digestion of pEPito-hCMV-eGFP with both enzymes originates two fragments, with 4273 bp and 972 bp, corresponding to double digestion with SpeI and BglII. The digestion of pEPito-CMV-eGFP originated only one fragment, with 5341 bp, that corresponds to the linearized plasmid (Figure 3.4).
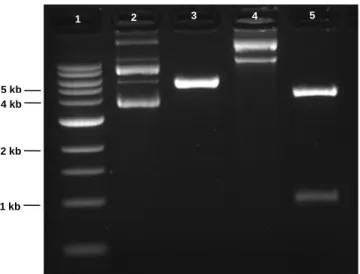
To verify the restriction map of RPE65-eGFP:Luc and pEPito-hCMV/RPE65-eGFP:Luc, we digested both plasmids with the enzyme SnaBI (Roche). The restriction site for SnaBI is only present in pEPito-hCMV/RPE65-eGFP:Luc, but absent in pEPito-RPE65-eGFP:Luc (Figure 3.5).
Figure 3.4. Digestion of CMV-eGFP and pEPito-hCMV-eGFP. Lane 1 – 1kb DNA Ladder (New England Biolabs); Lane 2 – undigested pEPito-CMV-eGFP; Lane 3 – pEPito-CMV-eGFP digested with SpeI and Bgl II; Lane 4 – undigested pEPito-hCMV; Lane 5 – pEPito-hCMV-eGFP digested with SpeI and Bgl II.
1 kb 2 kb 5 kb 4 kb
26 As expected, the digestion of pEPito-hCMV/RPE65-eGFP:Luc with SnaBI originated only one fragment with approximately 8 kb , which corresponds to the linearized plasmid (Figure 3.4). For pEPito-RPE65-eGFP:Luc, we did not observe any digested fragments, as expected. The pattern observed was the same that could be observed in the lane 2 with the undigested plasmid as control (Figure 3.6).
A) B)
Figure 3.5. Restriction maps of A) pEPito-RPE65-eGFP:Luc and B) pEPito-hCMV/RPE65-eGFP:Luc with the restriction site for SnaBI.
6 kb
Figure 3.6. Digestion of pEPito-hCMV/RPE65-eGFP:Luc and pEPito-RPE65-eGFP:Luc with SnaBI. Lane 1 – 1kb DNA Ladder (New England Biolabs); Lane 2 – undigested pEPito-RPE65-eGFP:Luc; Lane 3 –pEPito-RPE65-eGFP:Luc digested with SnaBI; Lane 4 – undigested pEPito-hCMV/RPE65-eGFP:Luc; Line 5 –pEPito-hCMV/RPE65-eGFP:Luc digested with SnaBI
1 2 3 4 5
8 kb
27 These results show that the plasmids did not suffer any alterations during bacterial transformation and they are in accordance with the restriction maps sent by Dr. Rudolf Haase.
Based on these results, we proceeded to the in vitro transfection assay, in order to evaluate the ability of these plasmids to transfect cells in culture, in particular retinal pigment cells, using two RPE-derived cell lines D407 and ARPE-19.
3.2 – Transfection efficiency and GFP expression:
To evaluate the transfection efficiency of the five plasmids described above:
pEPI-1;
pEPito-CMV-eGFP;
pEPito-hCMV-eGFP;
pEPito-RPE65-eGFP:Luc;
pEPito-hCMV/RPE65-eGFP:Luc;
We evaluated the expression of GFP using flow citometry. In vitro experiments were performed using three different cell lines: HEK293, D407 and ARPE-19.
We have used HEK293 as a transfection control, since these cells have been used for this purpose.
For the HEK293 cell line 24 h post transfection we observed that the cells transfected with pEPito-CMV-eGFP seemed present a higher number of fluorescent cells (Figure 3.7-A) than the wells transfected with pEPito-hCMV-eGFP (Figure 3.7-B). Relatively to wells transfected with pEPI-1, we observed that the number of fluorescence-presenting cells was similar to the observed in the wells transfected with pEPito-CMV-eGFP. However, we verified that the intensity of the fluorescence of the cells transfected with pEPI-1 was lower than that of cells transfected with either pEPito-CMV-eGFP or pEPito-hpEPito-CMV-eGFP (Figure 3.7-C). Despite this being a subjective evaluation, we believe this to be accurate since the exposure time needed to visualize the cells transfected with pEPI-1 was higher than that necessary to visualize the cells transfected with pEPito-CMV-eGFP and pEPito-hCMV-EGFP. As expected, we did not observed fluorescent cells in the wells transfected with pEPito-RPE65-eGFP:Luc and pEPito-hCMV/RPE65-eGFP:Luc, since RPE-65 is a RPE-specific promoter and HEK293 are kidney cells.
28 In summary, these results show that pEPito-CMV-eGFP and pEPI-1 confer similar transfection efficiency in HEK293 cell line and pEPito-hCMV-eGFP gave rise to less fluorescent cells.
For the D407 cell line in general, the number of cells containing fluorescence was lower than for HEK293 cell line (Figure 3.8). Similarly to what was observed for the HEK293 cell line, pEPito-CMV-eGFP was the plasmid that originated the higher number of fluorescent cells and with the highest intensity of fluorescence (Figure 3.8-A). The wells transfected with pEPI-1 presented a fluorescence intensity lower than the one observed in wells transfected with pEPito-CMV-eGFP and pEPito-hCMV-eGFP (Figure 3.8-C), as observed for the HEK293 cell line. However the number of transfected seemed present lower than that obtained in the wells transfected with pEPito-CMV-eGFP. Unexpectedly, we did not observe any fluorescence in the wells transfected with pEPito-hCMV/RPE65-eGFP:Luc and pEPito-RPE65-eGFP:Luc,
Figure 3.7. Fluorescence microscopy of HEK293 cell line 24 h post transfection with: A) pEPito-CMV-eGFP (exposure time: 107 ms); B) pEPito-hCMV-pEPito-CMV-eGFP (exposure time: 148 ms); and C) pEPI-1 (exposure time: 310 ms); Magnification: 100x
A) B)
29 contrarily to what was expected. Since these cells are derived from the RPE cells of the retina, we expected these cells to be able to express GFP under the control of the RPE-specific promoter.
Similarly to HEK293, pEPito-CMV-eGFP was the plasmid that apparently originates the higher transfection efficiency, followed by pEPito-hCMV-eGFP and pEPI-1.
ARPE-19 was the cell line which presented the lowest number of transfected cells (Figure 3.9). pEPito-CMV-eGFP was the plasmid that originated the highest number of fluorescent cells (Figure 3.9-A). The wells transfected with pEPito-hCMV-eGFP presented a very low number of fluorescent cells (Figure 3.9-B). The wells transfected with pEPI-1 showed a comparable number of fluorescent cells to the ones transfected with pEPito-CMV-eGFP (Figure 3.9-C). But once again, the fluorescence intensity was lower than that observed in the wells transfected with pEPito-CMV-eGFP
Figure 3.8. Fluorescence microscopy of D407 cell line 24 h post transfection with: A) pEPito-CMV-eGFP (exposure time: 406 ms); B) pEPito-hCMV-eGFP (exposure time: 460 ms); and C) pEPI-1 (exposure time: 630 ms); Magnification: 100x
A) B)
C)
30 and pEPito-CMV-eGFP. Again, we did not observed fluorescent cells in the wells transfected with pEPito-hCMV/RPE65-eGFP:Luc and pEPito-RPE65-eGFP/Luc, contrarily to what was expected , because ARPE-19 are also derived from RPE cells.
Similarly to HEK293, the transfection efficiency can be summarized as follows: pEPito-CMV-eGFP > pEPI-1 > pEPito-hCMV-eGFP
To corroborate these results we have used flow cytometry (Figure 3.10) to assess GFP expression, 48 h post-transfection. The analysis of GFP positive cells showed that for HEK293 cell line, the percentage of cells transfected with pEPito-CMV-eGFP reached values of 60% (Figure 3.11).
Figure 3.9.Fluorescence microscopy of ARPE-19 cell line 24 h post transfection with: A) pEPito-CMV-eGFP (exposure time: 864 ms); B) pEPito-hCMV-pEPito-CMV-eGFP (exposure time: 907 ms); and C) pEPI-1 (exposure time: 1520 ms); Magnification: 100x
B)
C) A)
31 The observations done with the fluorescence microscope seemed to indicate that the number of cells transfected with pEPito-hCMV-eGFP was lower, as compared with the number of cells transfected with pEPito-CMV-eGFP. However, flow cytometry and posterior statistical analysis shows that in fact, it is not like this and the percentage of cells transfected was around 54%, that is not significantly different from the values obtained for pEPito-CMV-eGFP (Figure 3.11). For pEPI-1, the percentage of transfected cells was about 57% (Figure 3.11).
Surprisingly, although we have not seen fluorescence using the fluorescence microscope, a small percentage of HEK293 cells transfected with pEPito-RPE65-eGFP:Luc (around 6%) presented fluorescence (Figure 3.11). This is most likely because the intensity of the fluorescence was too low to be detected by fluorescence microscopy, but could be detected by flow cytometry, which is a more sensitive technique. The same was observed for cells transfected with pEPito-hCMV/RPE65-eGFP:Luc, in which we obtained a transfection efficiency of 39% (Figure 3.11). Compared with the transfection efficiency observed for pEPito-RPE65-eGFP:Luc, the transfection efficiency conferred by pEPito-hCMV/RPE65-eGFP:Luc was substantially higher, most likely due to the presence of hCMV enhancer.
Figure 3.10. Flow citometry of HEK293 cell line 48 h post transfection. A) Untransfected cells; B) Cells transfected with pEPito-CMV-eGFP; C) Cells transfected with pEPito-hCMV-eGFP; D) Cells transfected with pEPI-1; E) Cells transfected with pEPito-RPE65-eGFP:Luc; F) Cells transfected with pEPito-hCMV/RPE65-eGFP:Luc