AR
TICLE
1 Instituto de Medicina Social, Universidade do Estado do Rio de Janeiro. R. São Francisco Xavier 524/1006 A, Maracanã. 20550-900 Rio de Janeiro RJ Brasil. fatima.marinho@ saude.gov.br
2 Escola de Enfermagem, Universidade Federal de Minas Gerais (UFMG). Belo Horizonte MG Brasil. 3 Faculdade de Medicina, UFMG. Belo Horizonte MG Brasil.
4 Instituto de Saúde Coletiva, Universidade Federal da Bahia. Salvador BA Brasil.
Changes in health and disease in Brazil and its States in the 30
years since the Unified Healthcare System (SUS) was created
Abstract The Unified Healthcare System (SUS) was created to ensure the population’s right to universal, free and comprehensive healthcare. This study compares the health indicators mea-sured in 1990 to those meamea-sured in 2015 in Brazil and its states. The goal is to contribute to under-standing the role SUS played in changing the na-tion’s health profile. Analyses use estimates in the Global Burden of Disease (GBD) study for Brazil and its states, and compares 1990 and 2015. The main results are increased life expectancy, as well as an increase in the population’s longevity mea-sured in health-adjusted life expectancy. These in turn are due to a sharp decline in mortality due to transmissible diseases, in maternal and infant morbi-mortality, and avoidable causes of death. NTCDs are the leading cause of death, followed by violence. Poor diet is the leading risk factor, fol-lowed by metabolic issues. Tobacco use decreased over the period, as did infant malnutrition. In the thirty years since the SUS was created, health in-dicators in this country have improved, and ma-jor progress has been made to reduce inequality
across the country’s regions.
Key words Healthcare policies, Child mortality, Unified Healthcare System, Non-Transmissible, Chronic Diseases (NTCDs), Violence
Maria de Fátima Marinho de Souza 1
Deborah Carvalho Malta 2
Elisabeth Barboza França 3
Souza MFM Introduction
Congress approved a democratic constitution in 1988, and health is included as a right. The Uni-fied Healthcare System (SUS) was then created to ensure the population’s right to free and compre-hensive healthcare1.
Over the past 30 years, Brazil has undergone structural changes and become an emerging na-tion2. In terms of the SUS, we point to structur-ing measures and programs such as the Family Health Strategy (FHS), created in 1994 to guide the healthcare model to a more comprehensive approach, focusing on primary care and seeking to provide universal access to all Brazilians3. The Family Health Strategy has expanded greatly in the past decade, prioritizing vulnerable areas. According to the National Health Survey3, it now covers 53.4% of the population. The Brazilian National Vaccination plan, created in 1973, is an efficient provider of vaccines against numerous transmissible diseases. In fact, vaccine coverage in this country has helped reduce the number of immune preventable diseases4. The SUS also created a national policy to provide free and universal access to essential drugs5. In the past decade, the government decided that drugs to treat Non-Communicable Diseases would be provided to the population free of cost6,7, and created a program of Budget drugstores known
as Aqui Tem Farmácia Popular. The Ministry of
Health has ensured free and universal anti-retro-viral treatment to those living with HIV/AIDS, and has taken numerous disease-prevention and health-promotion measures8,9. In 2006, the National Health Promotion Policy prioritized intersectoral measures as well as certain health determinants and conditionants10. Although Brazil is the world’s 2nd largest tobacco producer, it has played a key role in tobacco control, im-plementing regulatory measures that range from prohibiting tobacco advertising to the Tobac-co-Free Environments Law signed in 2014. These measures have helped reduce smoking around the world11,12. In 2004, Brazil signed the World Health Organization’s Global Treaty on Diet, Physical Activity and Health to prevent obesity and Non-Communicable diseases13. In the past decade a pre-hospital service was created to care for the growing number of cardiovascular diseas-es, external causes among the population, etc.14.
Population ageing, decreasing fertility rates and other transformations in Brazilian society have brought with them new challenges for the healthcare system15. Demographic and
epide-miological transitions have resulted in different health and disease patterns in different regions and states15.Studies show that the expansion of the SUS system over the past 30 years helped re-duce the burden of disease in the population, and the inequalities across regions in this country15. Thus, it is important to analyze how the disease scenario has changed in Brazil over the past de-cades.
The current study compared the health indi-cators prevalent in 1990 and 2015 in Brazil and its states. The goal was to help understand the role SUS plays in changing the nation’s health profile.
Methods
To analyze how the health of the Brazilian pop-ulation has changed over time, this study used estimates published in the 2015 GBD (Global Burden of Disease) covering the country and the individual states16. In 2015, a GBD study by the University of Washington Institute for Health Metrics and Evaluation (IHME) analyzed 249 causes of death, 310 diseases and injuries, 2,619 unique sequelae and 70 risk factors using stan-dardized methodology and different sources of data in 195 countries and territories16-18.
The first element of the GBD study’s analyt-ical approach is an estimate of overall mortality to correct under notified deaths. This includes estimating the probability of death among those younger than 5 years of age (5q0), adult mortal-ity (45q15), specific mortalmortal-ity by age and the in-clusion of the possible effects of epidemics such as HIV/Aids, natural disasters and other fatal dis-continuities17. The main sources of data on mor-tality among those younger than five in Brazil were the death records in the Mortality Informa-tion System, demographic censuses, household surveys - PNAD, the Sample-Based Household Survey, and PNDS, the National Survey of De-mographics and Health, as well as the complete (PNDS) and abbreviated (censuses and PNAD) birth records. The estimating process used statis-tical models to adjust the different sources and address any possible inconsistencies between
them19,20.
aúd
e C
ole
tiv
a,
23(6):1737-1750,
2018
incomplete diagnoses, and entered as garbage19-21, were reassigned to non-garbage codes for each age-gender-year using specific redistribution al-gorithms. Causes of death were modeled using CODEm (Cause of Death Ensemble Model)19,20
The main sources of data for risk factor anal-yses were surveys such as the National Health Survey (PNS), Vigitel (telephone chronic disease risk factor surveillance and protection), the Na-tional Household Sample Survey (PNAD), and the National Student Health Survey (PeNSE), among others22.
The following metrics were used to describe the burden of disease in 1990 and 2015: absolute number of deaths, infant deaths per 1,000 live births at the country and state level, mortality for standardized causes by age (for the overall pop-ulations), death and disability adjusted life years (DALY), life expectancy and health-adjusted life expectancy (HALE), as well as ranked lists of the main causes of death and risk factors in 1990 and 2015. Greater details about the metrics are avail-able in other publications16-20.
Metrics are shown with their uncertainty in-tervals (UI), which reflect the uncertainty in the parameter estimates for each state and period of study. Greater details are available in other pub-lications.
Results
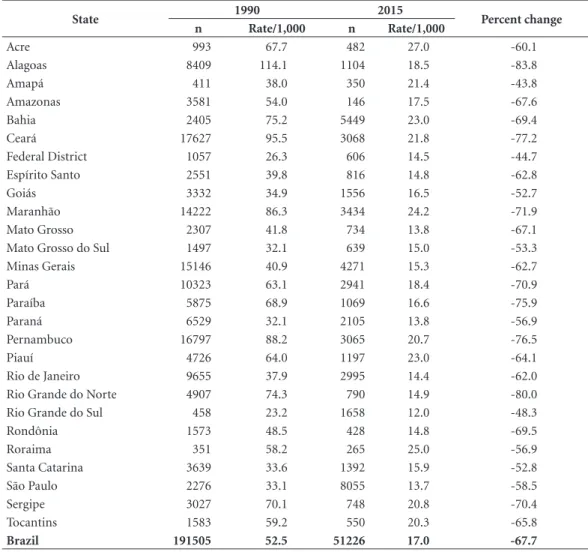
Table 1 shows an estimate of deaths and mortal-ity rates for those under the age of 5 at the coun-try and state level in 1990 and 2015. Mortality in Brazil was 52.5/1,000 live births in 1990, and 17.0/1,000 live births in 2016, a 67.6% drop. In 1990, 9 of the 11 states with the highest mortal-ity rates for those under 5 are in the Northeast, all with rates over 60/1,000 live births. There was a 4.9-fold difference between the state with the highest mortality (Alagoas, 114.1/1,00 LB) and the state with the lowest mortality (Rio Grande do Sul, 23.2/1,000 LB), a difference of 91 deaths per 1,000 live births. By 2015 this had dropped to 2.3-fold between the state with the highest mor-tality (Acre, 27.0/1,000 LB) and the one with the lowest (Rio Grande do Sul, 12.0/1,000 LB), a dif-ference of 15 deaths per 1,000 LB. In 2015, four of the ten states with the highest mortality rates were in the North.
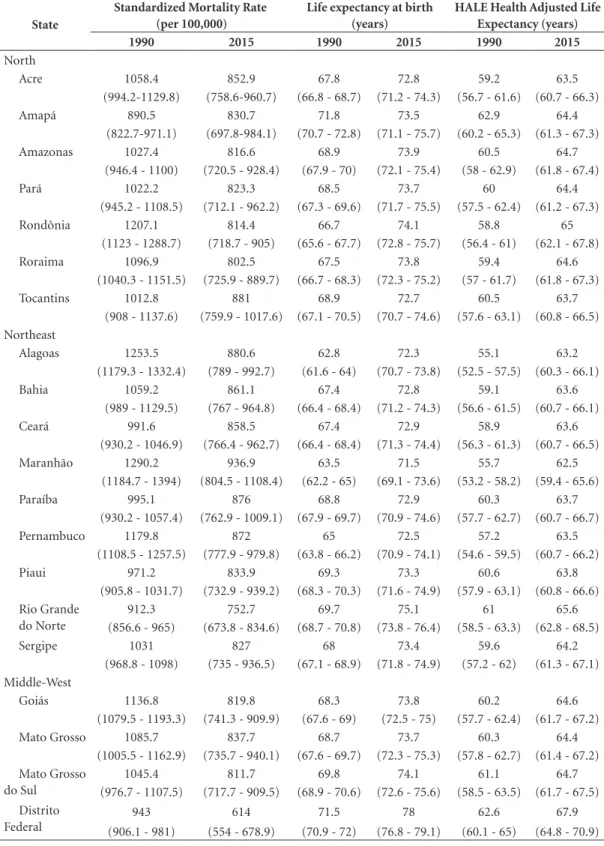
Between 1990 and 2015, life expectancy at birth in Brazil increased 6.5 years, from 67.9 to 74.4, and health adjusted life expectancy (HALE) increased 5.4 years, from 59.4 to 64.8. The fact
and overall life expectancy and HALE show a similar increase in the number of years lived in good health. (Table 2)
Age-standardized mortality rates for both genders dropped 28.7% (UI: 26.1-31.1) be-tween 1990 and 2015, from 1,102.2 (UI: 1,085,9-1,118,6) to 786.2 per 100,000 inhabitants (UI: 761.2-810.3). (Table 2) Age-standardized mor-tality rates dropped across Brazil, however at dif-ferent rates depending on the region. The largest decreases were recorded in the more developed regions - the South (30%) and Southeast (32%), while the smallest ones were in the North (20%) and Northeast (21%). (Table 2)
The Federal District performed better in all health metrics. In 2015, the state of São Paulo - the wealthiest in the nation - came in second and third in terms of life expectancy and HALE at birth respectively. In 2015, the lowest life expec-tancy at birth was in states of the northeast: Ma-ranhão, Alagoas and Pernambuco at 71.5 years (UI=69.1-73.6), 72.3 years (70.7-73.8) and 72.5 years (70.9-74.1) respectively. However, these states also had the largest increase in life expec-tancy compared to 1990 - 12.6% for Maranhão, 15.1% for Alagoas and 12.1 for Pernambuco (Ta-ble 2).
Souza MFM
56%, neonatal causes 56.7% and nutritional causes 50.2% (Table 3).
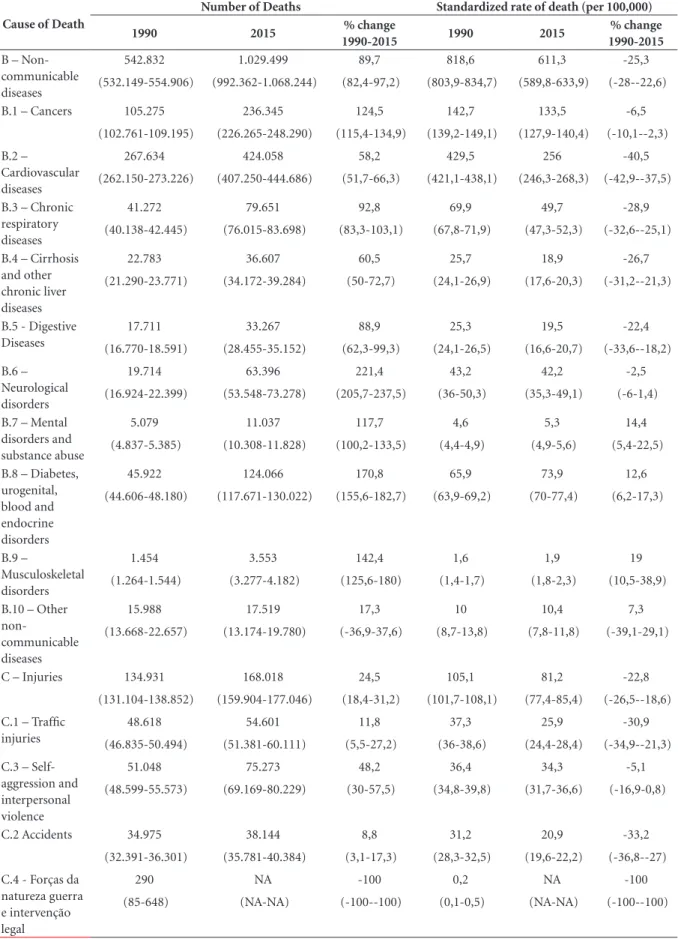
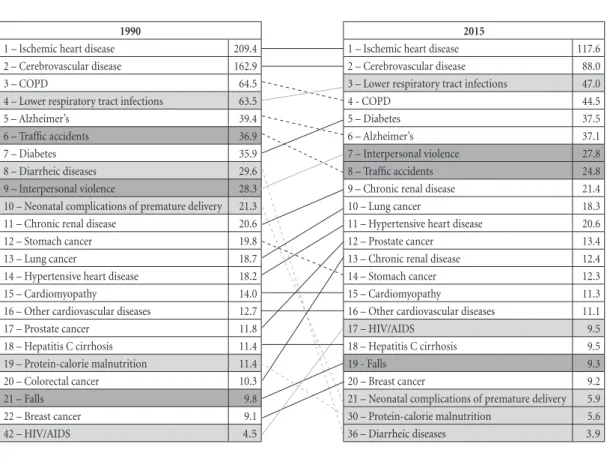
Figure 1 compares the main causes of mor-tality in 1990 and 2015. Ischemic heart diseas-es were the leading cause of death in 1990 and 2015, followed by cerebrovascular disorders. Alzheimer’s dropped from 5th to 6th place. Low-er respiratory tract infections came in third in 2015, while COPD dropped from 3rd to 4th place. Diabetes went from 7th to 5th and interpersonal violence from 9th to 7th. In 2015, traffic accidents were the 8th leading cause of death, followed by chronic kidney disease (9th) and lung cancer (10th). Diarrhea as a cause of death dropped sig-nificantly - from 8th in 1990 to 36th place in 2015, as did malnutrition (18th to 31st), and premature labor (19th to 30th).
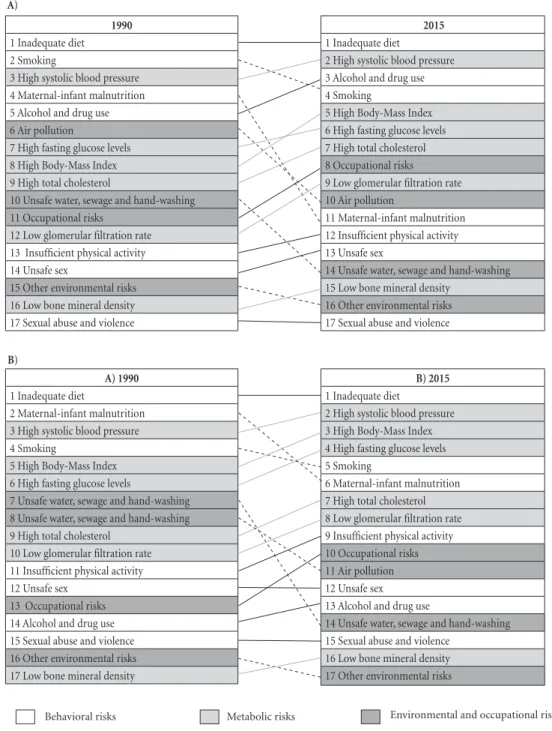
Figure 2 shows the changes in the main risk factors for all-cause DALY by gender between
1990 and 2015. In 1990, inadequate diet, smok-ing, high blood-pressure and maternal-infant malnutrition were the main risk factors for DALY among men and women. Inadequate diet topped the list throughout, with high blood pressure moving from 2nd to 3rd place among both men and women. Infant and child malnutrition dropped significantly, from 4th to 11th place among boys, and from 2nd to 6th place among girls. Smoking went from 2nd to 4th place among men, and from 4th to 5th among women (Figure 2).
Over this period, BMI went from 8th to 5th among men, and from 5th to 3rd among women. Drug and alcohol use went from 5th to 4th among men, and high fasting glucose levels from 6th to 4th among women. Other behavioral factors also contributed to worsening DALY, such as insuffi-cient physical activity, unsafe sex and all meta-bolic risks. Environmental risk factors, including
Table 1. Mortality of children under 5 per 1,000 live births. Brazil and its states, 1990 and 2015.
State 1990 2015 Percent change
n Rate/1,000 n Rate/1,000
Acre 993 67.7 482 27.0 -60.1
Alagoas 8409 114.1 1104 18.5 -83.8
Amapá 411 38.0 350 21.4 -43.8
Amazonas 3581 54.0 146 17.5 -67.6
Bahia 2405 75.2 5449 23.0 -69.4
Ceará 17627 95.5 3068 21.8 -77.2
Federal District 1057 26.3 606 14.5 -44.7
Espírito Santo 2551 39.8 816 14.8 -62.8
Goiás 3332 34.9 1556 16.5 -52.7
Maranhão 14222 86.3 3434 24.2 -71.9
Mato Grosso 2307 41.8 734 13.8 -67.1
Mato Grosso do Sul 1497 32.1 639 15.0 -53.3
Minas Gerais 15146 40.9 4271 15.3 -62.7
Pará 10323 63.1 2941 18.4 -70.9
Paraíba 5875 68.9 1069 16.6 -75.9
Paraná 6529 32.1 2105 13.8 -56.9
Pernambuco 16797 88.2 3065 20.7 -76.5
Piauí 4726 64.0 1197 23.0 -64.1
Rio de Janeiro 9655 37.9 2995 14.4 -62.0
Rio Grande do Norte 4907 74.3 790 14.9 -80.0
Rio Grande do Sul 458 23.2 1658 12.0 -48.3
Rondônia 1573 48.5 428 14.8 -69.5
Roraima 351 58.2 265 25.0 -56.9
Santa Catarina 3639 33.6 1392 15.9 -52.8
São Paulo 2276 33.1 8055 13.7 -58.5
Sergipe 3027 70.1 748 20.8 -70.4
Tocantins 1583 59.2 550 20.3 -65.8
Brazil 191505 52.5 51226 17.0 -67.7
aúd
e C
ole
tiv
a,
23(6):1737-1750,
2018
Table 2. Comparison of the Standardized Mortality Rate (per 100,000, Life Expectancy at Birth (years),
Health-Adjusted Life Expectancy (years) by state, 1990 and 2017.
State
Standardized Mortality Rate (per 100,000)
Life expectancy at birth (years)
HALE Health Adjusted Life Expectancy (years)
1990 2015 1990 2015 1990 2015
North
Acre 1058.4 852.9 67.8 72.8 59.2 63.5
(994.2-1129.8) (758.6-960.7) (66.8 - 68.7) (71.2 - 74.3) (56.7 - 61.6) (60.7 - 66.3)
Amapá 890.5 830.7 71.8 73.5 62.9 64.4
(822.7-971.1) (697.8-984.1) (70.7 - 72.8) (71.1 - 75.7) (60.2 - 65.3) (61.3 - 67.3)
Amazonas 1027.4 816.6 68.9 73.9 60.5 64.7
(946.4 - 1100) (720.5 - 928.4) (67.9 - 70) (72.1 - 75.4) (58 - 62.9) (61.8 - 67.4)
Pará 1022.2 823.3 68.5 73.7 60 64.4
(945.2 - 1108.5) (712.1 - 962.2) (67.3 - 69.6) (71.7 - 75.5) (57.5 - 62.4) (61.2 - 67.3)
Rondônia 1207.1 814.4 66.7 74.1 58.8 65
(1123 - 1288.7) (718.7 - 905) (65.6 - 67.7) (72.8 - 75.7) (56.4 - 61) (62.1 - 67.8)
Roraima 1096.9 802.5 67.5 73.8 59.4 64.6
(1040.3 - 1151.5) (725.9 - 889.7) (66.7 - 68.3) (72.3 - 75.2) (57 - 61.7) (61.8 - 67.3)
Tocantins 1012.8 881 68.9 72.7 60.5 63.7
(908 - 1137.6) (759.9 - 1017.6) (67.1 - 70.5) (70.7 - 74.6) (57.6 - 63.1) (60.8 - 66.5) Northeast
Alagoas 1253.5 880.6 62.8 72.3 55.1 63.2
(1179.3 - 1332.4) (789 - 992.7) (61.6 - 64) (70.7 - 73.8) (52.5 - 57.5) (60.3 - 66.1)
Bahia 1059.2 861.1 67.4 72.8 59.1 63.6
(989 - 1129.5) (767 - 964.8) (66.4 - 68.4) (71.2 - 74.3) (56.6 - 61.5) (60.7 - 66.1)
Ceará 991.6 858.5 67.4 72.9 58.9 63.6
(930.2 - 1046.9) (766.4 - 962.7) (66.4 - 68.4) (71.3 - 74.4) (56.3 - 61.3) (60.7 - 66.5)
Maranhão 1290.2 936.9 63.5 71.5 55.7 62.5
(1184.7 - 1394) (804.5 - 1108.4) (62.2 - 65) (69.1 - 73.6) (53.2 - 58.2) (59.4 - 65.6)
Paraíba 995.1 876 68.8 72.9 60.3 63.7
(930.2 - 1057.4) (762.9 - 1009.1) (67.9 - 69.7) (70.9 - 74.6) (57.7 - 62.7) (60.7 - 66.7)
Pernambuco 1179.8 872 65 72.5 57.2 63.5
(1108.5 - 1257.5) (777.9 - 979.8) (63.8 - 66.2) (70.9 - 74.1) (54.6 - 59.5) (60.7 - 66.2)
Piaui 971.2 833.9 69.3 73.3 60.6 63.8
(905.8 - 1031.7) (732.9 - 939.2) (68.3 - 70.3) (71.6 - 74.9) (57.9 - 63.1) (60.8 - 66.6) Rio Grande
do Norte
912.3 752.7 69.7 75.1 61 65.6
(856.6 - 965) (673.8 - 834.6) (68.7 - 70.8) (73.8 - 76.4) (58.5 - 63.3) (62.8 - 68.5)
Sergipe 1031 827 68 73.4 59.6 64.2
(968.8 - 1098) (735 - 936.5) (67.1 - 68.9) (71.8 - 74.9) (57.2 - 62) (61.3 - 67.1) Middle-West
Goiás 1136.8 819.8 68.3 73.8 60.2 64.6
(1079.5 - 1193.3) (741.3 - 909.9) (67.6 - 69) (72.5 - 75) (57.7 - 62.4) (61.7 - 67.2)
Mato Grosso 1085.7 837.7 68.7 73.7 60.3 64.4
(1005.5 - 1162.9) (735.7 - 940.1) (67.6 - 69.7) (72.3 - 75.3) (57.8 - 62.7) (61.4 - 67.2) Mato Grosso
do Sul
1045.4 811.7 69.8 74.1 61.1 64.7
(976.7 - 1107.5) (717.7 - 909.5) (68.9 - 70.6) (72.6 - 75.6) (58.5 - 63.5) (61.7 - 67.5) Distrito
Federal
943 614 71.5 78 62.6 67.9
(906.1 - 981) (554 - 678.9) (70.9 - 72) (76.8 - 79.1) (60.1 - 65) (64.8 - 70.9)
Souza MFM
air pollution, deceased, while occupational risks increased (Figure 2).
Discussion
These findings show that in the 25-year period analyzed (1990 to 2015), which covers much of the SUS existence, there have been many chang-es in the health/disease profile of the Brazilian population, most of them positive. It also shows a decrease in the inequalities in health indicators across the states.
A sharp decline in mortality due to transmis-sible diseases, in maternal-infant morbi-mortal-ity and avoidable causes of death have increased life expectancy and increased the population’s longevity measured in healthy life-years. NCD re-main the leading cause of death, despite an over-all reduction in mortality rates and in death due to cardiovascular and respiratory diseases. On the other hand, deaths due to diabetes increased in this period. Violence killed over 168 thousand Brazilians in 2015. As these can be fully avoid-ed, a decrease in this rate is a major challenge for the coming decades. Poor diet is the leading risk factor, followed by metabolic factors. In the
25-year period smoking decreased substantially, as did infant malnutrition. All of these changes co-incided with re-democratization and significant economic growth. A number of social protection policies were instated at this time, along with the unified healthcare system (SUS), the definitive strategy to promote a society with a healthcare system suited to its needs. Along with econom-ic and social advances, there is evidence that the SUS contributed to the changes observed, and in particular to reduce the inequality that prevails in this country.
The GBD study is innovative as it records the nation’s health-disease burden using corrected estimates, new metrics such as DALY, and expect-ed health-adjustexpect-ed life expectancy, all of which provide new data on population health and new views for healthcare professionals and managers24. Between 1990 and 2015 overall mortality in Brazil dropped and life expectancy at birth went up. Higher life expectancy at birth is the result of socioeconomic income distribution policies, programs such as Bolsa Familia (family stipend), increased employment in the past decade and other policies to reduce inequality15. Better cover-age and access to healthcare services and a rapid change in the population age pyramid also
con-State
Standardized Mortality Rate (per 100,000)
Life expectancy at birth (years)
HALE Health Adjusted Life Expectancy (years)
1990 2015 1990 2015 1990 2015
Southeast Espírito Santo
1062.5 763.7 68.9 74.6 60.5 65.1
(1003.3 - 1129.3) (677.1 - 853.8) (68 - 69.8) (73.2 - 76.1) (57.8 - 63) (62.1 - 67.9) Minas
Gerais
1107.5 758.8 68.5 74.9 60.1 65.5
(1049.9 - 1168.3) (682.4 - 841.7) (67.7 - 69.3) (73.6 - 76.2) (57.7 - 62.4) (62.5 - 68.3) Rio de
Janeiro
1205.5 798.1 66.6 74.2 58.6 64.9
(1158.4 - 1252.4) (729.7 - 869.9) (66 - 67.3) (73.1 - 75.3) (56.4 - 60.8) (62.1 - 67.4)
São Paulo 1082.5 711.9 69 76.1 59.9 65.7
(1040.4 - 1124.7) (640.7 - 780) (68.5 - 69.6) (74.9 - 77.2) (57.4 - 62.3) (62.6 - 68.5) South
Paraná 1125 805.8 69.2 74.3 60.7 64.7
(1067.7 - 1184) (721.5 - 902.4) (68.5 - 69.9) (72.9 - 75.6) (58.1 - 62.9) (61.8 - 67.3) Rio Grande
do Sul
1063.7 756.8 70.1 75.2 61.6 65.6
(1001.3 - 1126.1) (661.7 - 860.7) (69.4 - 70.9) (73.7 - 76.7) (59 - 63.8) (62.7 - 68.4) Santa
Catarina
1087.3 735.1 69.6 75.6 61.3 66.1
(1024.8 - 1151.5) (650.9 - 826.4) (68.8 - 70.4) (74.1 - 77) (58.9 - 63.5) (63 - 68.9)
Brazil 1.102.2 786.2 67.9 74.4 59.4 64.8
(1,085.9-1,118.6) (761.2-810.3) (67.5-68.2) (73.9-74.9) (56.9-61.7) (62.1-67.3)
Source: Global Burden of Disease study.
Table 2. Comparison of the Standardized Mortality Rate (per 100,000, Life Expectancy at Birth (years),
aúd
e C
ole
tiv
a,
23(6):1737-1750,
2018
tributed25,26. Life expectancy improved in Brazil more than in other Latin American countries such as Argentina, Chile, Colombia and Mexico17.
Successful aging, or increased health-adjust-ed life expectancy (HALE) are often ushealth-adjust-ed as in-dictors of quality of life27. HALE estimates the
expected number of “healthy years” for a popu-lation of a given age27. This indicator includes a dimension of quality of life3, as long-life may not be the same as healthy-life27.
Szwarcwald et al.27 analyzed data from the National Health Survey and found significant
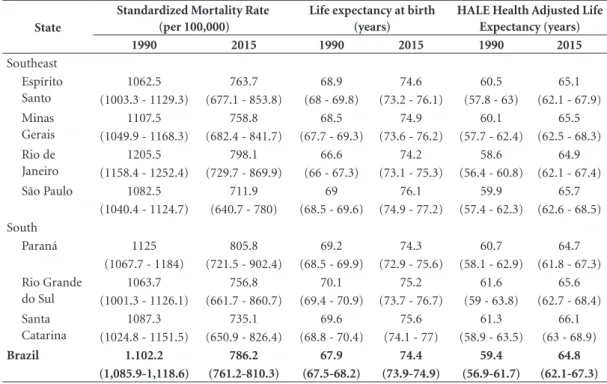
Table 3. Number of deaths and age-standardized rates for selected causes of death in both genders Brazil, 1990, 2015.
Cause of Death
Number of Deaths Standardized rate of death (per 100,000)
1990 2015 % change
1990-2015 1990 2015
% change 1990-2015
All causes 911.317 1.357.434 49 1.102,2 786,2 -28,7
(896.944-925.847) (1.312.612-1.400.906) (43,8-54,5) (1085,9-1118,6) (761,2-810,3) (-31,1--26,1) A –
Transmissible, maternal, neonatal and nutritional diseases
233.554 159.917 -31,1 178,5 93,8 -47,1
(222.998-240.244) (139.858-170.945) (-38,7--26,5) (168,3-183,4) (81,4-100,7) (-52,7--43,6)
A.1 HIV/ AIDS and tuberculosis
13.740 26.812 94,9 12,8 12,5 -2,6
(11.664-15.402) (23.412-31.197) (62,5-140,2) (10,7-14,8) (10,9-14,6) (-19,2-20,3)
A.2 – Diarrhea, lower
respiratory tract diseases and other infectious causes
119.418 85.657 -27,3 101,6 52,9 -47,2
(111.562-124.075) (65.814-94.532) (-41,7--20,4) (92,4-105,8) (40,7-58,6) (-56,6--42,1)
A.2.1 – Diarrheic diseases
46.035 6.343 -86,2 29,6 3,9 -86,8
A.2.6 – Meningitis (5.942-6.732) (-87,3--85) (28,3-31) (3,6-4,2) (-87,8--85,7)
A.2.11 - Measles 8.027 2.785 -67,2 4,8 1,5 -70,7
(6.256-8.844) (2.515-3.530) (-70,4--49,9) (3,7-5,2) (1,3-1,9) (-73,4--55,8) A.2.11 -
Sarampo
1.109 3 -99,7 0,6 0 -99,7
(806-1.492) (2-5) (-99,8--99,6) (0,4-0,7) (0-0) (-99,7--99,5) A.3 – Neglected
tropical diseases and malaria
9.541 7.486 -21,4 10,9 4,2 -61,7
(9.121-9.962) (6.918-8.049) (-27,9--14,9) (10,4-11,4) (3,9-4,5) (-65--58,4)
A.4 – Material disorders
3.081 1.972 -36 2 0,9 -56
(2.896-3.299) (1.786-2.165) (-43,2--27,9) (1,8-2,1) (0,8-0,9) (-61--50,4) A.5 – Neonatal
disorders
69.532 25.137 -63,9 35,8 15,5 -56,7
(67.501-71.533) (22.843-27.716) (-67,3--59,8) (34,7-36,8) (14,1-17,1) (-60,7--51,8) A.6 –
Nutritional disorders
13.570 9.568 -29,4 12,2 6 -50,2
(10.445-14.964) (7.584-10.585) (-35,5--23,1) (9,7-13,4) (4,8-6,7) (-54,1--46,3)
A.7 – Other transmissible maternal, neonatal and nutritional diseases
4.672 3.285 -29,2 3,3 1,7 -48,2
(3.734-5.905) (2.986-3.510) (-43,2--13,1) (2,8-4) (1,6-1,8) (-55,9--40,3)
Souza MFM
Cause of Death
Number of Deaths Standardized rate of death (per 100,000)
1990 2015 % change
1990-2015 1990 2015
% change 1990-2015
B – Non-communicable diseases
542.832 1.029.499 89,7 818,6 611,3 -25,3
(532.149-554.906) (992.362-1.068.244) (82,4-97,2) (803,9-834,7) (589,8-633,9) (-28--22,6)
B.1 – Cancers 105.275 236.345 124,5 142,7 133,5 -6,5
(102.761-109.195) (226.265-248.290) (115,4-134,9) (139,2-149,1) (127,9-140,4) (-10,1--2,3) B.2 –
Cardiovascular diseases
267.634 424.058 58,2 429,5 256 -40,5
(262.150-273.226) (407.250-444.686) (51,7-66,3) (421,1-438,1) (246,3-268,3) (-42,9--37,5)
B.3 – Chronic respiratory diseases
41.272 79.651 92,8 69,9 49,7 -28,9
(40.138-42.445) (76.015-83.698) (83,3-103,1) (67,8-71,9) (47,3-52,3) (-32,6--25,1)
B.4 – Cirrhosis and other chronic liver diseases
22.783 36.607 60,5 25,7 18,9 -26,7
(21.290-23.771) (34.172-39.284) (50-72,7) (24,1-26,9) (17,6-20,3) (-31,2--21,3)
B.5 - Digestive Diseases
17.711 33.267 88,9 25,3 19,5 -22,4
(16.770-18.591) (28.455-35.152) (62,3-99,3) (24,1-26,5) (16,6-20,7) (-33,6--18,2) B.6 –
Neurological disorders
19.714 63.396 221,4 43,2 42,2 -2,5
(16.924-22.399) (53.548-73.278) (205,7-237,5) (36-50,3) (35,3-49,1) (-6-1,4)
B.7 – Mental disorders and substance abuse
5.079 11.037 117,7 4,6 5,3 14,4
(4.837-5.385) (10.308-11.828) (100,2-133,5) (4,4-4,9) (4,9-5,6) (5,4-22,5)
B.8 – Diabetes, urogenital, blood and endocrine disorders
45.922 124.066 170,8 65,9 73,9 12,6
(44.606-48.180) (117.671-130.022) (155,6-182,7) (63,9-69,2) (70-77,4) (6,2-17,3)
B.9 –
Musculoskeletal disorders
1.454 3.553 142,4 1,6 1,9 19
(1.264-1.544) (3.277-4.182) (125,6-180) (1,4-1,7) (1,8-2,3) (10,5-38,9)
B.10 – Other
non-communicable diseases
15.988 17.519 17,3 10 10,4 7,3
(13.668-22.657) (13.174-19.780) (-36,9-37,6) (8,7-13,8) (7,8-11,8) (-39,1-29,1)
C – Injuries 134.931 168.018 24,5 105,1 81,2 -22,8
(131.104-138.852) (159.904-177.046) (18,4-31,2) (101,7-108,1) (77,4-85,4) (-26,5--18,6) C.1 – Traffic
injuries
48.618 54.601 11,8 37,3 25,9 -30,9
(46.835-50.494) (51.381-60.111) (5,5-27,2) (36-38,6) (24,4-28,4) (-34,9--21,3) C.3 –
Self-aggression and interpersonal violence
51.048 75.273 48,2 36,4 34,3 -5,1
(48.599-55.573) (69.169-80.229) (30-57,5) (34,8-39,8) (31,7-36,6) (-16,9-0,8)
C.2 Accidents 34.975 38.144 8,8 31,2 20,9 -33,2
(32.391-36.301) (35.781-40.384) (3,1-17,3) (28,3-32,5) (19,6-22,2) (-36,8--27) C.4 - Forças da
natureza guerra e intervenção legal
290 NA -100 0,2 NA -100
(85-648) (NA-NA) (-100--100) (0,1-0,5) (NA-NA) (-100--100)
Source: Global Burden of Disease Study
aúd
e C
ole
tiv
a,
23(6):1737-1750,
2018
Figure 1. Standardized mortality rates (100,000 deahts) for the main causes of death, Level 3, GBD 2015. Brazil, 1990
and 2015.
Source: Global Burden of Disease Study. https://vizhub.healthdata.org/gbd-compare/ 1990
1 – Ischemic heart disease 209.4
2 – Cerebrovascular disease 162.9
3 – COPD 64.5
4 – Lower respiratory tract infections 63.5
5 – Alzheimer’s 39.4
6 – Traffic accidents 36.9
7 – Diabetes 35.9
8 – Diarrheic diseases 29.6
9 – Interpersonal violence 28.3
10 – Neonatal complications of premature delivery 21.3
11 – Chronic renal disease 20.6
12 – Stomach cancer 19.8
13 – Lung cancer 18.7
14 – Hypertensive heart disease 18.2
15 – Cardiomyopathy 14.0
16 – Other cardiovascular diseases 12.7
17 – Prostate cancer 11.8
18 – Hepatitis C cirrhosis 11.4
19 – Protein-calorie malnutrition 11.4
20 – Colorectal cancer 10.3
21 – Falls 9.8
22 – Breast cancer 9.1
42 – HIV/AIDS 4.5
2015
1 – Ischemic heart disease 117.6
2 – Cerebrovascular disease 88.0
3 – Lower respiratory tract infections 47.0
4 - COPD 44.5
5 – Diabetes 37.5
6 – Alzheimer’s 37.1
7 – Interpersonal violence 27.8
8 – Traffic accidents 24.8
9 – Chronic renal disease 21.4
10 – Lung cancer 18.3
11 – Hypertensive heart disease 20.6
12 – Prostate cancer 13.4
13 – Chronic renal disease 12.4
14 – Stomach cancer 12.3
15 – Cardiomyopathy 11.3
16 – Other cardiovascular diseases 11.1
17 – HIV/AIDS 9.5
18 – Hepatitis C cirrhosis 9.5
19 - Falls 9.3
20 – Breast cancer 9.2
21 – Neonatal complications of premature delivery 5.9 30 – Protein-calorie malnutrition 5.6
36 – Diarrheic diseases 3.9
differences in HALE by state – as much as seven years –, and by socioeconomic class. The current study found that HALE had increased signifi-cantly between 1990 and 2015, but also found differences by state. The highest HALE was found in the Federal District and Santa Catarina, al-though both within the UI.
This study shows that between 1990 and 2015, Child Mortality dropped significantly in all states, and there was also a major decline in the differences between states. Mortality dropped more significantly in the northeast states23,28. A 2013 UN Report29 pointed to the decline in Child Mortality in Brazil, highlighting intersectoral measures and the Unified Healthcare System (SUS) offering things such as pre-natal, delivery and infant (first-year of life) care. The Family Health Strategy also had a positive impact on reducing Child Mortality29, especially neonatal mortality. Measures to address malnutrition and diarrhea, and campaigns to foster
breastfeed-ing helped keep down Child Mortality rates in the period28. Other measures, such as increasing the number of high-risk beds and easier access to care during delivery helped reduce neonatal death23,28. The report also highlights social service policies such as the Bolsa Família (Family Sti-pend) income transfer program29, and a number of improvements in living conditions and infant and child healthcare23.
Souza MFM
Figure 2. 17 main level 2 risk factors for all-cause DALYs for (A) men and (B) women, 1990 and 2015 GBD
Brazil, 2015.
Source: Malta et al.22. 1990 1 Inadequate diet 2 Smoking
3 High systolic blood pressure 4 Maternal-infant malnutrition 5 Alcohol and drug use 6 Air pollution
7 High fasting glucose levels 8 High Body-Mass Index 9 High total cholesterol
10 Unsafe water, sewage and hand-washing 11 Occupational risks
12 Low glomerular filtration rate 13 Insufficient physical activity 14 Unsafe sex
15 Other environmental risks 16 Low bone mineral density 17 Sexual abuse and violence
2015 1 Inadequate diet
2 High systolic blood pressure 3 Alcohol and drug use 4 Smoking
5 High Body-Mass Index 6 High fasting glucose levels 7 High total cholesterol 8 Occupational risks 9 Low glomerular filtration rate 10 Air pollution
11 Maternal-infant malnutrition 12 Insufficient physical activity 13 Unsafe sex
14 Unsafe water, sewage and hand-washing 15 Low bone mineral density
16 Other environmental risks 17 Sexual abuse and violence
A) 1990 1 Inadequate diet
2 Maternal-infant malnutrition 3 High systolic blood pressure 4 Smoking
5 High Body-Mass Index 6 High fasting glucose levels
7 Unsafe water, sewage and hand-washing 8 Unsafe water, sewage and hand-washing 9 High total cholesterol
10 Low glomerular filtration rate 11 Insufficient physical activity 12 Unsafe sex
13 Occupational risks 14 Alcohol and drug use 15 Sexual abuse and violence 16 Other environmental risks 17 Low bone mineral density
B) 2015 1 Inadequate diet
2 High systolic blood pressure 3 High Body-Mass Index 4 High fasting glucose levels 5 Smoking
6 Maternal-infant malnutrition 7 High total cholesterol 8 Low glomerular filtration rate 9 Insufficient physical activity 10 Occupational risks 11 Air pollution 12 Unsafe sex 13 Alcohol and drug use
14 Unsafe water, sewage and hand-washing 15 Sexual abuse and violence
16 Low bone mineral density 17 Other environmental risks A)
B)
Behavioral risks Metabolic risks Environmental and occupational risks
of causes of death. The past 25 years in Brazil have also seen major changes in the nation’s de-mographics. As the population ages. the country is also experiencing a transition in epidemiology,
re-aúd
e C
ole
tiv
a,
23(6):1737-1750,
2018
sult of different measures, among them increased healthcare for adults33, and the nation’s commit-ment to the theme, defining targets to control NCD32. In 2011, the government launched a plan to address NCDthat includes health promotion, disease prevention and care6. In 2011, voluntary agreements with the food industry reduced the amount of salt in ultra-processed foods, and eliminated trans-fats6,7. In 2014, the government launched the Healthy Nutrition Guide34, and in 2011 the Academia da Saúde (Health Gym) cre-ated incentives for physical activity and other health promotion measures35. Universal access to all three levels of healthcare (primary, second-ary and tertisecond-ary)36,37 is another important mea-sure. In the case of cardiovascular diseases this includes access to drugs such as blood pressure drugs, beta-blockers, statins, etc.36.
Patients with diabetes have access to oral hy-poglycemics and insulin. National Health Survey data shows that more than 80% of those with di-abetes and/or hypertension in Brazil have access to healthcare services and medicines and, when required, to experts, tests and hospitalization38.
The study shows that inadequate diet is the main contributor to the burden of disease, mea-sured by DALYs, and particularly Non-Commu-nicable Diseases (NCD)39. It is essential to invest in measures to deter the increase in obesity, such as regulatory measures to tax unhealthy foods such as soft-drinks and other ultra-processed foods6,7,22,33.
Smoking has fallen in the ranking of risk factors, as the number of smokers in Brazil has declined sharply11,12,39. In 1989 36.4% of the pop-ulation smoked, while in 2013 this was down to 15%, one of the lowest rates in the world12. Reg-ulatory measures such as forbidding advertising and health warnings, among others, explain this
drop11,12,40. The Tobacco Free Environment Law,
signed in 2011 and regulated by Presidential De-cree in 2014, prohibits smoking in closed public environments, prohibits cigarette advertising and promotions, and expanded the warning messages on tobacco packaging. Taxes on tobacco products also increased12,40.
Over the past decade, the Ministry of Health created a broad system to monitor NCD, which includes health surveys and Health Information Systems to monitor trends, risk factors and pro-tection against NCD7,41.
Finally, the results point to external causes of death, which did drop over the period, but are still quite prevalent, especially interpersonal vio-lence and traffic accidents. These are particularly
prevalent among young people and contribute to premature mortality during the productive years16. Also worth noting are premature deaths due to HIV and its rising importance as a cause of early death in recent decades, and SUS actions to ensure access to diagnosis and treatment. Bra-zil led global measures to break patents to man-ufacture generic drugs, especially those used to treat HIV, offering ample access to medication to those with the disease8,9.
Conclusion
The SUS faces many challenges, among them new epidemics, neglected diseases, vector control, the magnitude of NCD and violence. Understanding the pattern of health and the associated trends over the past decades allows us to take a critical look at healthcare policies and the SUS, and to assess progress made and limitations in address-ing health issues. This study is innovative as it contributes new metrics to monitor the health of the population, such as Health-Adjusted Life Ex-pectancy (HALE), and Disability-Adjusted Life Years (DALY), among others.
In terms of SUS activities, we highlight the expansion of the Family Health Strategy, emer-gency and pre-hospital care, expanded treatment of cancer and cardiovascular diseases, a more ex-tensive vaccine calendar and health promotion and disease prevention measures. Other contri-butions are regulatory measures to reduce tobac-co use, programs to entobac-courage physical activities, and intersectoral violence-prevention programs, all of which helped improve the indicators an-alyzed in this paper. These positive findings are directly related to implementing highly cost-ef-fective interventions by the Unified Healthcare System, such as expanding primary care, drug distribution to those at high risk of developing cardiovascular diseases, and measures to control tobacco use39. Addressing ischemic heart disease is a dual challenge for the Brazilian healthcare system, as it includes health promotion measures and better specialized care to deliver better re-sults in managing cardiovascular diseases37.
Souza MFM amendment 95, which makes it impossible to grow the resources available for healthcare and other social policies, is a serious threat to these new demands42. Budget cuts will have an impact on population health indicators43, so studies to monitor trends such as those presented here are essential to measure the health and living condi-tions of the Brazilian population.
aúd
e C
ole
tiv
a,
23(6):1737-1750,
2018
References
1. Escorel S. O Programa de Saúde da Família e a cons-trução de um novo modelo para a atenção básica no Brasil. Rev Panam Salud Publica 2007; 21(2-3):164-176. 2. Paim JS. The Citizen Constitution and the 25th anni-versary of the Brazilian Unified National Health System (SUS). Cad Saude Publica 2013; 29(10):1927-1936. 3. Malta DC, Santos MAS, Stopa SR, Vieira JEB, Melo EA,
Reis Ademar AC. A Cobertura da Estratégia de Saúde da Família (ESF) no Brasil, segundo a Pesquisa Nacio-nal de Saúde, 2013. Cien Saude Colet 2016; 21(2):327-338.
4. Victora C, Aquino EML, Leal MC, Monteiro VA, Barros FC, Szwarcwald CL. Maternal and child health in Brazil: progress and challenges. Lancet 2011; 377(9780):1863-1876.
5. Brasil. Portaria no 3.916, de 10 de novembro de 1998.
Diário Oficial da União 1990; 10 nov.
6. Malta DC, Morais Neto OL, Silva Junior JB. Apresenta-ção do plano de ações estratégicas para o enfrentamen-to das doenças crônicas não transmissíveis no Brasil, 2011 a 2022. Epidemiol. Serv. Saúde 2011; 20(4):425-438.
7. Malta DC, Oliveira TP, Andrade SSCA, Silva MMA, Santos MAS. Avanços do Plano de Ações Estratégi-cas para o Enfrentamento das Doenças CrôniEstratégi-cas não Transmissíveis no Brasil, 2011-2015. Epidemiol Serv
Saúde 2016; 25(2):373-390.
8. Carneiro-Proiettti AB, Sabino EC, Sampaio D, Proietti FA, Gonçalez TT, Oliveira CD, Ferreira JE, Liu J, Custer B, Schreiber GB, Murphy EL, Busch MP. Demograph-ic profile of blood donors in Brazil: Results from the International REDS II Study, 2007-2008. Transfusion 2010; 50(4):918-925.
9. Galvão J. Access to antiretroviral drugs in Brazil. Lancet 2002; 360(9348):1862-1865.
10. Brasil. Portaria n.º 2.446, de 11 de novembro de 2014. Redefine a Política Nacional de Promoção da Saúde (PNPS). Diário Oficial da União 2014; 12 nov. 11. Giovino GA, Mirza SA, Samet JM, Gupta PC, Jarvis MJ,
Bhala N, Peto R, Zatonski W, Hsia J, Morton J, Palipudi KM, Asma S; GATS Collaborative Group. Represen-tative cross-sectional household surveys. Lancet 2012; 380(9842):668-679.
12. Malta DC, Vieira ML, Szwarcwald CL, Caixeta R, Brito SMF, Reis AAC. Tendência de fumantes na população Brasileira segundo a Pesquisa Nacional de Amostra de Domicílios 2008 e a Pesquisa Nacional de Saúde 2013.
Rev Bras Epidemiol 2015; 18(Supl. 2):45-56.
13. Barreto SM, Pinheiro ARO, Sichieri R, Monteiro CA, Batista Filho M, Schimidt MI, Lotufo P, Assis AM, Gui-marães V, Recine EGIG, Victora CG, Coitinho D, Passos VMA. Análise da estratégia global para alimentação, atividade física e saúde, da Organização Mundial da Saúde. Epidemiol. Serv. Saúde 2005; 14(1):41-68. 14. Brasil. Portaria nº 2.657, de 16 de dezembro de 2004.
Estabelece as atribuições das centrais de regulação mé-dica de urgências e o dimensionamento técnico para a estruturação e operacionalização das Centrais SAMU-192. Diário Oficial da União 2004; 16 dez.
15. Barreto ML, Teixeira MG, Bastos FI, Ximenes RAA, Barata RA, Rodrigues LC, Successes and failures in the control of infectious diseases in Brazil: social and environmental context, policies, interventions, and re-search needs. Lancet 2011; 377(9780):1877-1889. 16. GBD 2015 Disease and Injury Incidence and
Prev-alence Collaborators. Global, regional, and national incidence, prevalence, and years lived with disability for 310 diseases and injuries, 1990-2015: a systematic analysis for the Global Burden of Disease Study 2015.
Lancet 2016; 388(10053):1545-1602.
17. GBD 2015 DALYs and HALE Collaborators. Global, regional, and national disability-adjusted life-years (DALYs) for 315 diseases and injuries and healthy life expectancy (HALE), 1990-2015: a systematic analysis for the Global Burden of Disease Study 2015. Lancet 2016; 388(10053):1603-1658.
18. GBD 2015 Risk Factors Collaborators. Global, region-al, and national comparative risk assessment of 79 be-havioural, environmental and occupational, and meta-bolic risks or clusters of risks, 1990-2015: a systematic analysis for the Global Burden of Disease Study 2015.
Lancet 2016; 388(10053):1659-1724.
19. GBD 2015 Mortality and Causes of Death Collabo-rators. Global, regional, and national life expectancy, all-cause mortality, and cause-specific mortality for 249 causes of death, 1980-2015: a systematic analysis for the Global Burden Disease Study 2015. Lancet 2016; 388(10053):1459-1544.
20. Estudo de carga global de doença 2015: resumo dos métodos utilizados. Rev. bras. epidemiol. 2017; 20(Supl. 1):4-20.
21. Brasil. Ministério da Saúde (MS). Sistema de
Informa-ções sobre Mortalidade (SIM) – 2014. Brasília: MS; 2015.
22. Malta DC, Felisbino-Mendes MS, Machado ÍE, Passos VMA, Abreu DMX, Ishitani LH, Velásquez-Meléndez G, Carneiro M, Mooney M, Naghavi M. Fatores de ris-co relacionados à carga global de doença do Brasil e Unidades Federadas, 2015. Rev. bras. epidemiol. 2017; 20(Supl. 1):217-232.
23. França EB, Lansky S, Rego MAS, Malta DC, França JS, Teixeira R, Porto P, Almeida MF, Souza MFM, Szwar-cwald CL, Mooney M, Naghavi M, Vasconcelos AMN. Principais causas da mortalidade na infância no Brasil, em 1990 e 2015: estimativas do estudo de Carga Global de Doença. Rev. bras. epidemiol. 2017; 20(Supl. 1):46-60.
24. Souza MFM, Barboza FE, Cavalcante A. Carga da doen-ça e análise da situação de saúde: resultados da rede de trabalho do Global Burden of Disease (GBD) Brasil.
Rev. bras. epidemiol. 2017; 20(Supl. 1):1-3.
Souza MFM 26. Instituto Brasileiro de Geografia e Estatística (IBGE).
Censo demográfico 2010. Rio de Janeiro: IBGE; 2015.
27. Szwarcwald CL, Montilla DER, Marques AP, Damacena GN, Almeida WS, Malta DC. Desigualdades na espe-rança de vida saudável por Unidades da Federação. Rev
Saude Publica 2017; 51(Supl. 1):7s.
28. Victora CG. Mortalidade por diarreia: o que o mundo pode aprender com o Brasil? J Pediatr 2009; 85(1):3-5. 29. United Nations Children’s Fund. Levels & trends in
child mortality: report 2015 estimates developed by the
UN Inter-agency Group for Child Mortality Estimation.
2015. [acessado 2014 Ago 25]. Disponível em: http:// www.childmortality.org/files_v20/download/igme%20 report%202015%20child%20mortality%20final.pdf 30. Macinko J, Marinho de Souza MF, Guanais FC, Simões
CCS. Going to scale with community-based prima-ry care: An analysis of the family health program and infant mortality in Brazil, 1999-2004. Soc Science Med 2007; 65(10):2070-2080.
31. Barros FC, Matijasevich A, Requejo JH, Giugliani E, Maranhao AG, Monteiro CA, Barros AJ, Bustreo F, Merialdi M, Victora CG. Recent trends in maternal, newborn, and child health in Brazil: progress toward Millennium Development Goals 4 and 5. Am J Public
Health 2010; 100(10):1877-1889.
32. Malta DC, França E, Abreu DMX, Perillo RD, Salmen MC, Teixeira RA, Passos V, Souza MFM, Mooney M, Naghavi M. Mortalidade por doenças não transmis-síveis no Brasil, 1990 a 2015, segundo estimativas do estudo de Carga Global de Doenças. Sao Paulo Med J 2017; 135(3):213-221.
33. Rasella D, Harhay MO, Pamponet ML, Aquino R, Bar-reto ML. Impact of Primary Health Care on Mortality from Heart and Cerebrovascular Diseases in Brazil: a Nationwide Analysis of Longitudinal Data. BMJ 2014; 349:g4014.
34. Brasil. Ministério da Saúde (MS). Guia Alimentar para
a População Brasileira. Brasília: MS; 2014.
35. Malta DC , Silva Júnior J.B. Policies to promote physical activity in Brazil. The Lancet, 2012; 380(9838):195-196. 36. Bonita R, Magnusso R, Bovet P, Zhao D, Mal-ta DC, McKee M, Beaglehole R, on behalf of The Lancet NCD Action Group. Contrie Action Country actions to meet UN commitments on non-communicable diseases: a stepwise approach
Lancet 2013; (381)575-584
37. Ribeiro AL, Duncan BB, Brant LC, Lotufo PA, Mill JG, Barreto SM. Cardiovascular Health in Brazil: Trends and Perspectives. Circulation 2016; 133(4):422-433. 38. Malta DC, Iser BPM, Chueiri PS, Stopa SR, Szwarcwald
CL, Schmidt MI, Duncan BB. Cuidados em saúde entre portadores de diabetes mellitus autorreferido no Bra-sil, Pesquisa Nacional de Saúde, 2013. Rev. bras. epide-miol. 2015; 18(Supl. 2):17-32.
39. World Health Organization (WHO). WHO Global
ac-tion plan for the prevenac-tion and control of noncom-municable disease 2013-2020. Geneva: WHO; 2013. [acessado 2014 Fev 20]. Disponível em: http://www. who.int/nmh/events/ncd_action_plan/en/
40. Malta DC, Iser BPM, Sá NNB, Yokota RTC, Moura L, Claro RM, Luz MG, Bernal RI. Trends in tobacco con-sumption from 2006 to 2011 in Brazilian capitals ac-cording to the Vigitel survey. CadSaude Publica 2013; 29(4):812-822.
41. Malta DC, Morais Neto OL, Silva MMA, Rocha D, Castro AM, Reis AAC, Akerman M. Política Nacional de Promoção da Saúde (PNPS):capítulos de uma ca-minhada ainda em construção. Cien Saude Colet 2016; 21(6):1683-1694.
42. Brasil, 2016. Emenda Constitucional nº 95, de 15 de dezembro de 2016. Altera o Ato das Disposições Cons-titucionais Transitórias, para instituir o Novo Regime Fiscal, e dá outras providências. Diário Oficial da União 2016; 15 dez.
43. Stuckler D, Basu S. A Economia Desumana: Por-que Mata A Austeridade. Cad Saude Publica [pe-riódico na Internet]. 2016 Dez [acessado 2017 Dez 01]; 32(11):e00151116. Disponível em: http://www. scielo.br/scielo.php?script=sci_arttext&pid=S-0102-311X2016001108001
44. Rasella D, Aquino R, Santos CAT, Paes-Sousa R, Barreto ML. Effect of a conditional cash transfer program on childhood mortality: a nationwide analysis of Brazilian municipalities. Lancet 2013; 382(9886):57-64. 45. Victora CG, Barreto ML, Leal MC, Monteiro CA,
Sc-midt MI, Paim J, Bastos FI, Almeida C, Bahia L, Travas-sos C, Reichenheim M, Barros FC and the Lancet Brazil Series Working Group. Health conditions and health-policy innovations in Brazil: the way forward.
Lancet 2011; 377 (9782):2042-2053.
Article submitted 12/01/2018 Approved 30/01/2018
Final version submitted 27/02/2018
This is an Open Access article distributed under the terms of the Creative Commons Attribution License