CERNE
Historic: Received 03/12/2017 Accepted 26/02/2018
Keywords: Gypsum-bonded fiberboard RSM ANN Hydration MOR Bagasse Kenaf Glass fiber
1 Shahid Beheshti University, University of Zabol, Tehran, Iran 2 University of Zabol, Iran
3 University of Zabol, Iran 4 University of Zabol, Iran
5 Shahid Beheshti University, Tehran, Iran +Correspondence:
morteza17172000@yahoo.com
DOI: 10.1590/01047760201824012484 v.24 n.1 2018
Morteza Nazerian1+, Meysam Kamyabb2, Mohammad Shamsianb3, Mohammad Dahmardehb4, Mojtaba Kooshaa5
COMPARISON OF RESPONSE SURFACE METHODOLOGY (RSM) AND ARTIFICIAL NEURAL NETWORKS (ANN) TOWARDS EFFICIENT OPTIMIZATION OF FLEXURAL PROPERTIES OF GYPSUM-BONDED FIBERBOARDS
NAZERIAN, M.; KAMYABB, M.; SHAMSIANB, M.; DAHMARDEHB, M.; KOOSHAA, M. Comparison of response surface methodology (RSM) and artificial neural networks (ANN) towards efficient optimization of flexural properties of gypsum-bonded fiberboards. CERNE, v. 24, n. 1, p. 35-47, 2018.
HIGHLIGHTS
The higher non-wood extractives causes to the higher setting time of the gypsum paste,
while temperature decreases.
The ANN prediction model is a quite effective tool for modeling bending strength of
gypsum-bonded fiberboard.
Maximum MOR is achieved by increase in bagasse, kenaf and glass fibers content and
reaches to 10.81 MPa and 11MPa by RSM and ANN at optimum condition.
ABSTRACT
In this study, the hydration behavior of gypsum paste mixed with bagasse and kenaf fibers as lignocellulosic material and fiberglass as inorganic material is evaluated. Moreover, the properties of gypsum-bonded fiberboard (GBFB) are examined using bagasse fibers (Saccharum officinarum.L),
kenaf fibers (Hibiscus cannabinus.L) and industrial fiberglass. The weight ratios of fiberglass (at three levels 0, 3 and 6%), bagasse fiber (at three levels 0, 7.5 and 15%) and kenaf fiber (at three levels 0, 7.5 and 15%) to gypsum are used to make the gypsum-bonded fiberboard with
the nominal density 1.10 g.cm-3 . After preparing the fiberboard, its flexural properties were
examined. Response surface methodology (RSM) and artificial neural network (ANN) were used to model the bending strength of gypsum-bonded fiberboard. According to the hydration tests, it was determined that as the extractives in the lignocellulosic materials increased, the temperature of the mixture decreased and its setting time increased. According to the bending
test results, it was determined that there is an ideal consistency between the predicted values
and the observed data, so that as bagasse and kenaf fiber increased, the modulus of rupture (MOR) increased. Maximum MOR of panel was predicted to be 10.81 MPa and 11MPa by RSM
and ANN at optimum condition. Based on the statistical analysis, the training and validation
INTRODUCTION
Panels with mineral binders have extensive applications in flooring, inner lining of walls, ceiling and partition walls. These panels, such as gypsum-bonded fiberboard, have a better linear stability than similar wood-based panels, and when exposed to fire, they show a higher
resistance than other wood composite products. Adding
cellulose fibers to a certain amount has a strengthening
effect, and beyond the certain amount, they have negative
effects. Moreover, the way the fibers are distributed in the mixture does not change the results. The comparison of the specimens containing fibers and the control specimens
in a research by Rapoport et al. (2005) showed that the
cracks observed due to the shrinkage from drying were narrower. For some time, organic fibers were added to gypsum, but artificial fibers were mainly used, such as fiberglass (Eve et al. 2002). Fiberglass increases the
flexural load-bearing capacity of the composites (Lempfer
et al. 1990). Fiberglass has a proper strength and stiffness,
preserves its mechanical properties at high temperatures, has proper resistance to moisture and corrosion and is rather cheap. The relationship between adding natural
fibers to gypsum matrix and the mechanical properties of
the composites was evaluated (Coutts 1990, Hernández -Olivares et al. 1992).
According to the properties of any binder, gypsum and cement improvement must lead to a product with better mechanical properties and higher
resistance to moisture. Analysis of the extractives in
the organic compounds is very important and can delay the hydration of the mineral binders and hence, it can affect the internal bonding and mechanical properties of
gypsum-wood particleboards (Ahn and Moslemi 1980, Simatuupang et al. 1989). In a research on the chemical relationship between wood and cement, Hachmi and
Campbel (1990) studied the wood extractives and wood-cement setting. Accordingly, extractives are complex
compounds that contain resin, fatty acids, terpenes, phenols, tannins and sugars. These elements are largely different in terms of their solubility and their contents are different in different species. The most important
constraint for making fiberboard using mineral binders
is the highly variable compatibility between wood and mineral binders.
Various factors can affect the compatibility,
such as the solubility of the extractives into water or alkaline environment (Hofstrand et al. 1984, Semple et al. 2000, Hachmi and Moslemi 1989, Moslemi and Lim 1984). Species containing more than 7% of the
extractives dissolved into hot water can be considered
as incompatible materials (Hachmi and Moslemi 1989).
Compounds of the extractives can delay the hydration. For reducing the incompatibility, it is suggested that extractives are obtained from wood using hot water and
chemical additives (Moslemi et al. 1983, Zhengtian and Moslemi 1985). Conductimetry studies showed that for
delaying the gypsum set in the system, the extractives
delay the overall reaction. A comparative study of the penetration of acetic acid and phenolic compounds showed that these factors are the main reason of the
slow-down of gypsum set. Improvement of mineral
binders (cement, gypsum and soil) has become the main issue of concern in recent decades. It is tried to replace
mineral reinforcing factors (fiberglass or asbestos fibers) by organic fibers such as sisal and craft pulp, or cellulose fibers (Coutts 1083, Coutts et al. 1994).
Natural fibers slow down the gypsum set due to
the presence water-soluble compounds (Dalmay et al.
2010). The lack of wood and forest in many countries,
cheapness and abundance of lignocellulosic resources during the seasons of the year are some main reasons of using agricultural wastes. Replacement of agricultural wastes with wood can help the improvement of environmental conditions, because resources are used correctly. According to what was mentioned above, many researches are conducted on using agricultural wastes
and artificial fibers. Their effects on panel properties will be different due to the different shape of bagasse, kenaf and glass fibers, different chemical compositions and
their different morphological and anatomical properties. As mentioned above, the results obtained from
experimental studies showed that many variables significantly affect the bending strength, such as different fiber types and additives. Hence, optimal conditions
of manufacturing must be found, which provide a balance between product properties and manufacturing
cost. However, it is too costly and time-consuming to determine the influence of each parameter on
the bending strength. Thus, most recent researches have been focused on prediction of properties of different composites by modeling tools rather than
comprehensive experimental procedures. Artificial neural network (ANN) can give a chance to achieve
the logical values of bending properties by doing some
experimental treatments because of its capability to determinate complex and non-linear relationship in the
data structure (Kalogirou 2001, Zhang et al. 1998). Due to the advantages mentioned, ANN methods are applied in several studies for predicting mechanical and physical
et al. (2015) used the ANN approach for modeling the internal bond strength of particleboard. Ozsahin (2013)
developed an artificial neural network (ANN) model
for predicting the effects of some production factors on physical properties of oriented strand board (OSB).
Demirkir et al. (2013) employed the same approach for
modeling the plywood bonding strength. In literature, the effects of various factors on the mechanical and
physical properties of wood-based composites are
discussed mostly in detail, and ANN methods are used to predict the properties of these composites. However, it is shown that no information is available to investigate
and predict the effects of fibers obtained from different resources on the bending strength of gypsum-bonded fiberboard. Hence in the present study, we aimed to investigate and predict the bending strength of gypsum-bonded fiberboard manufactured from different fibrous resources with a proper weight ratio of bagasse, kenaf and glass fiber to gypsum, and determine the best composition for producing gypsum-bonded fiberboard.
MATERIAL AND METHODS
Origin of data
Bagasse (Saccharum Ossicinarum L.) was prepared
from the southwest regions of Iran. Some worn-out kenaf sacks (Hibiscus cannabinus L.) were prepared also from a
warehouse in Zabol. Fiberglass rolls were also prepared
and transferred to the laboratory. The mineral binder
was Omid-e-Semnan gypsum. The coarse particles of gypsum were first removed by a Mesh 40 Sieve, and fine particles were prepared to make the samples.
Chemical analysis
For chemical analysis of lignocellulosic materials,
lignin content, extractives soluble in alcohol-benzene
solution and ash and silica of the raw kenaf and bagasse
fibers were determined according to TAPPI T 222 om-98 (1998), TAPPI T 204 cm-97 (2004) and TAPPI T 211
om-85 (2009) standards, respectively. Ten specimens were used for each test. The results are shown in Table 1.
Hydration test and compressive strength
The hydration test was performed on the gypsum paste sample using calorimetric method to evaluate the compatibility of the materials used with gypsum by determining the temperature emitted when gypsum was
mixed with or without kenaf, bagasse or glass fibers and water containing extractives. The paste’s setting time is
a good index of the hydration reaction rate. Vicat test
was performed to determine the consistency progress
of the gypsum paste by recording the initial and final
setting times during the change of the penetration depth
of the needle of the Vicat apparatus over time. For this
purpose, different weight ratios were used including 300g gypsum, 150 ml water and 15 g powder of lignocellulosic material for the treatments c, f and i, respectively, and
300 g gypsum, 150 ml pure water or extractives for the treatments g, a, b, d, e, h, j and k, respectively. For specimens with or without powder of fibers, the initial and final setting times were recorded that are a reliable parameter for determining the hydration speed. From
the treatments mentioned above, specimens were also prepared in 20×20×30 mm mould for performing the compressive strength test.
Panel preparation
The effect of independent variables was examined
on the modulus of rapture of the boards prepared,
including fiberglass at three levels 0, 3 and 6%, bagasse fibers at three levels 0, 7.5 and 15% and kenaf fibers at
three levels 0, 7.5 and 15%. Other preparation factors were constant such as the amount of water (40% of dry
weight of gypsum), board’s density (1.10 g.cm-3), press
closing speed (4.5 mm.s-1), press pressure (15 Kg.cm-2),
press temperature (25 ºC), press time (24h), board’s thickness (10mm) and etc. The preparation process was a semi-dry process. First, water containing citric acid
(99.95% water+100% citric acid 0.05) was sprayed on
the dry fibers. After moistening the fibers in a laboratory mixer for 5 minutes, gypsum was sprinkled on them and they were remixed in a high speed mixer until a smooth homogeneous mixture of gypsum-fibers was obtained. The mixture was then put into a 30×30 cm wooden
mold to prevent from changes in the cake’s thickness and density in the final board. The cake was then put
under the cold press. The boards were maintained by a clamp for 24 h at a constant pressure. After removing the clamps, the prepared boards were put into plastic bags for 48 h in order to complete the hydration process. Then, after removing the boards from plastic bags, they
were exposed to the open air for 5 days in order that the
moisture is balanced. After the boards were hardened, TABLE 1 Analysis of fibers, from the species teste d.
Species Cellulose (%)
Lignin (%)
Ash (%)
Extractives (%)
Silica (%)
Silica in ash (%)
Slenderness ratio
Bagasse 47.6 23. 1.7 4.1 0.9 42.9 68.8 Kenaf 57.1 12. 5.5 2.9 - - 150.9
their moisture ranged from 16 to 20%. So they had
to be dried to achieve the desirable strength. For this
purpose, the boards were dried into an oven at the temperature 50ºC for 4 h under permanent ventilation. The boards were dried until the moisture 5 to 7%
was reached. The fi nal boards had the dimensions
1×35×35 cm. After drying, cutting and preparing the test specimens, modulus of rupture (MOR) was computed according to EN 319 Standard (1999). MOR
was determined by HOUNS Field H25ks Mechanical
Testing Machine.
Experimental design
Response surface methodology
After performing bending strength test, the results
were analyzed as the response surface using experimental
data that presented mathematical relations based on the quadratic regression model. This technique was used for developing a mathematical model as multivariate regression equations for the properties of the boards made. Using the response surface methodology, the independent variables were considered as functions of a mathematical model. The mathematical model is denoted by a general quadratic (regression) Equation 1 for the response surface y (Balasubramanian et al. 2008),
where xi and xj are input or independent factors, β0 is
the free term of the equation, the coeffi cients β1, β2, βi are linear terms; β11, β22, βiiare quadratic terms; β12, β13,
βi-1,j are the interaction terms and the ϵ represents the random error.
variables (percentage of bagasse fi bers, kenaf fi bers and fi berglass) is [3]. When the regression analysis was
performed, the response errors were obtained. The number of the independent variables, their codes and
levels and the experimental design used are presented
in Tables 2 and 4.
All coeffi cients of the cube’s central axis were obtained using Expert Design software package. After determining the signifi cance of the coeffi cients (at the level of confi dence 95%), the fi nal model was described only using the coeffi cients (Lakshminarayanan and Balasubramanian 2009). It is recommended that the
six-center test is used for three variables (William and Cochran 1992). Hence, based on the equation
2 where n is the number of variables and k is the number of repetitions at the cube’s center, the total
number of tests required for three independent
[1]
[2]
[3]
[4]
FIGURE 1 The ANN architecture used as the prediction model for MOR.
TABLE 2 A Coded and actual levels of variables.
Species Cellulose (%)
Lignin (%)
Ash (%)
Extractives (%)
Silica (%)
Silica in ash (%)
Slenderness ratio
Bagasse 47.6 23. 1.7 4.1 0.9 42.9 68.8 Kenaf 57.1 12. 5.5 2.9 - - 150.9
Fiberglass - - - 300
Artifi cial neural network
ANNs are more powerful techniques in predicting
non-linear relationships than the RSM technique, because
they require many more experiments than the RSM. However, while the statistical relationships between input and output districts were signifi cant according to the design of experiments (obtained by RSM), ANN methods can also work correctly even with logical
small data (Shanmugaprakash and Sivakumar 2013).
Therefore, the experimental data achieved by RSM
could be adequate to organize ANN model effectively.
A multilayer perceptron (MLP) was selected as a
feed-forward ANN consisting of three main layers called the input (operated using the hyperbolic tangent sigmoid
transfer function), hidden and output layers (operated
NAZERIAN et al.
A MLP was developed in MATLAB (The Mathworks, Inc., R2014a) with three input neurons
representing the glass fi ber, kenaf fi ber and bagasse fi ber
content, a single hidden layer of neurons, and one output
neurons representing the MOR of gypsum-bonded fi berboard. As seen from MLP architecture (Figure 1),
the number of neurons required in the hidden layer is determined by adding the weighted inputs and the related bias (Equation 5) and also leading the input data towards a more nonlinear situation; so at least 8 neurons were
needed to fi x the fi nal model using the data obtained
to develop the RSM, and the addition of more neurons
made the model overfi tting possible (Cheok et al. 2012, Madadlou et al. 2009).
The results showed that the fi nal setting time of the gypsum increased at the maximum temperature
at the presence of the lignocellulosic material or
extractives from washing the lignocellulosic material (Figure 2), and then, the maximum temperature of the mixture decreased. In addition, the increase or decrease
of the hydration at different times depends on the
type of the lignocellulosic material and the extractives content. Generally, kenaf with less extractives (Table 3) has a higher maximum hydration temperature and
lower hydration time.
According to Zhou and Kamdem (2002), the
decrease in maximum temperature may be due to the
presence of the hygroscopic sponge tissue in pith or
extractives in lignocellulosic materials that prevents from
heat generation due to water absorption. The results
indicate that as raw lignocellulosic material or water-soluble extractives obtained from washing lignocellulosic
material are added, the hydration temperature decreases
and the fi nal setting time increases. In Figure 2, among
the test treatments with two types of lignocellulosic
msaterials (bagasse and kenaf) and along with treatments with extractives from washing with hot and cold water, maximum hydration temperature was related to the treatment of gypsum+citric acid 0.05 with kenaf fi ber extractives washed with cold water, showing the
temperature 42 ºC and the fi nal setting time 235 min.
Since the extractives in bagasse are 1.5 times more
FIGURE 2 Hydration temperature and time of the test samples (fi berglass was excluded).
[5]
To obtain the fi nal model, all experimental data sets
were divided evenly into three subsets: 70% of data sets
(14 samples) were used for training the network, 15%
(3 samples) were used for validation and the last 15% (3 samples) were used for testing sets. The number of neurons in the input layer is determined by the number of inputs, and those in the output layer are determined by the
number of outputs (Wang and Wan 2009). The number of
neurons in the hidden layer is determined by repetition in
testing a number of neural networks until the mean square
error (MSE) value of the output reaches a minimum.
RESULTS AND DISCUSSION
Hydration Test
The effect of the type of lignocellulosic material
and the water-soluble extractives of these materials
was evaluated on hydration process of gypsum paste
by measuring the fi nal setting time (tmax) and maximum
hydration temperature (Tmax) of the gypsum+
lignocellulosic material (bagasse and kenaf) mixture or gypsum+ extractives (from washing the lignocellulosic material with hot and cold water) mixture.Tmax andtmax values of the test samples are given in Table 3.
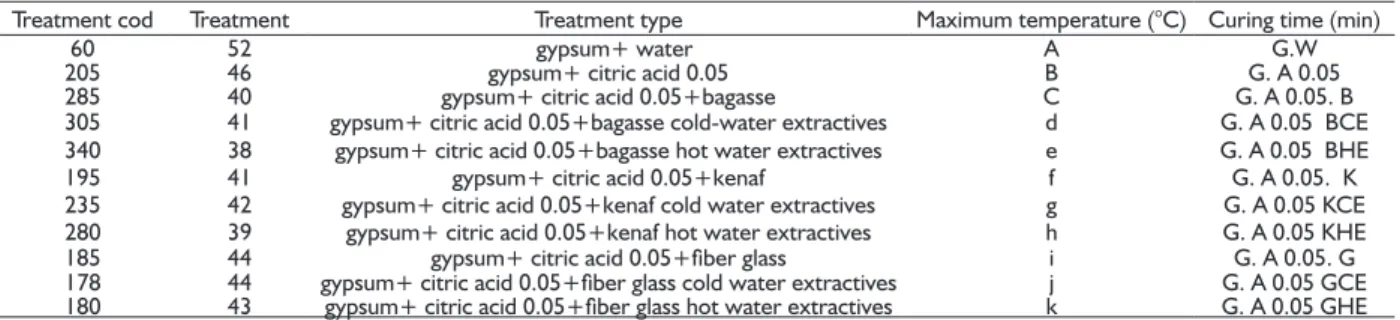
TABLE 3 Hydration temperature and time to reach the maximum temperature.
Treatment cod Treatment Treatment type Maximum temperature (°C) Curing time (min)
60 52 gypsum+ water A G.W
205 46 gypsum+ citric acid 0.05 B G. A 0.05
285 40 gypsum+ citric acid 0.05+bagasse C G. A 0.05. B 305 41 gypsum+ citric acid 0.05+bagasse cold-water extractives d G. A 0.05 BCE 340 38 gypsum+ citric acid 0.05+bagasse hot water extractives e G. A 0.05 BHE
195 41 gypsum+ citric acid 0.05+kenaf f G. A 0.05. K
235 42 gypsum+ citric acid 0.05+kenaf cold water extractives g G. A 0.05 KCE 280 39 gypsum+ citric acid 0.05+kenaf hot water extractives h G. A 0.05 KHE
185 44 gypsum+ citric acid 0.05+fi ber glass i G. A 0.05. G
178 44 gypsum+ citric acid 0.05+fi ber glass cold water extractives j G. A 0.05 GCE 180 43 gypsum+ citric acid 0.05+fi ber glass hot water extractives k G. A 0.05 GHE Note: Different weight ratios included 300g gypsum, 150 ml water and 15 g lignocellulosic material for the treatments c, f and i, and 300 g gypsum, 150 ml water for
than those in kenaf (Table 1), and washing with hot water contains more extractives, minimum hydration
temperature was for the treatment of gypsum+citric
acid 0.05 with bagasse fi ber extratives washed with hot
water, showing the temperature 38 ºC and the longest
fi nal setting time 340 min.
Analysis of the results in Tables 1, 3 and Figure
2 shows that washing the lignocellulosic material with
hot water results in the solution of more extractives that
changes the hydration temperature and setting time of gypsum paste.
During the gypsum hydration process, like calcium hydroxide, calcium sulfate increases the pH of the gypsum paste when adding water to the hydration process. On
the other hand, the extractives of plant fi bers are generally
acidic and they delay the minerals set due to the presence
of sugar and extractives. Therefore, the system pH
will change that may change the speed of the hydrated compounds formation; Hence, the hydration process can
be negatively affected. Alkaline hydrolysis of hemicellulose
and lignin is due to the formation of lignin calcium salts, polysaccaride and decrease of some sugar substances(Singh 1979). These soluble salts or deposits interfere with the hydration of the mineral physically and chemically and even can change the composition and morphology of the hydrated product (Roberts, 1967). In addition, sugar substances of wood are active hydrophilic materials. Besides setting, sugar substances added to water in the
mixture of gypsum mineral create a thin layer of densifi ed
water on the surface of gypsum grains as impenetrable gel under the effect of absorbency and coherence of the molecule. Although tiny gypsum particles are not compact, they are out of access of water. Therefore, the progress of hydration process is impossible and its speed slows down (Vaickelionis and Vaickelionis 2006).
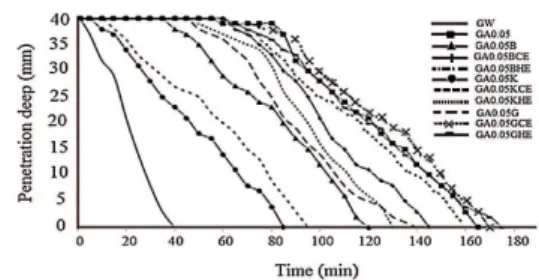
Vicat
The effect of the type of lignocellulosic material
and extractives on the setting time of gypsum paste during the vicat test is shown in fi gure 3.The setting time
of the gypsum paste was 40 min without any additive. Acid solvent (citric acid 0.05%) was used to delay the setting speed of the gypsum paste, and the setting time increased to 165 min. Among the test treatments, the
lowest setting time was for the mixture of pure gypsum
and water followed by the treatment f (gypsum+ citric
acid 0.05+kenaf), i.e. 85 min. The reason can be the high volume of fi bers, higher contents of cellulose and lower extractives in the lignocellolosic material (kenaf). In other words, the lower the extractives of the lignocellulosic
material in gypsum paste, the shorter the setting time of the paste.
In addition, the paste of the mixture of gypsum and bagasse fi bers has led to water absorption by
cell walls due to the low density and bagasse sponge structure. The increase in water absorption increases the concentration of gypsum paste, so that the penetration of
vicat needle into the mixture is prevented while gypsum hydration has not completed yet. In fact, bagasse, kenaf and glass fi bers act as fi ller and are the main factor of
the decrease in the setting time. The higher content of
extractives soluble in the gypsum paste resulting from
washing bagasse with hot water can be also an effective
factor and delays the gypsum’s setting time.
Compressive strength
The results from the compressive strength test
are shown in Figure 4. The strengths range from 1 to 7
MPa. The compressive strength of the pure gypsum with water was highest in certain times (3, 8, 24 and 72 h).
The results showed that increasing the time, the compressive strength of the samples increases. The highest strengths were in 72 hours and the highest strength was for the pure gypsum sample (6.5 MPa). Adding citric acid 0.05% as the retarder of dehydration, the compressive strength decreases. The compressive strength of the pure gypsum + water containing citric acid 0.05% decreased to 5.1 MPa after 72 h. This can be due to the delay of the dehydration process and prevents from the formation of gypsum crystal lattice (Sanda 1982). Samples containing extractives have lower strength. The FIGURE 3 Vicat test: penetration depth needle into of the
gypsum pastes.
NAZERIAN et al.
extractives delay the gypsum dehydration process and
this can prevent from completion of hydration process
and decreases the fi nal strength of the cured mixture.
On the other hand, for a constant wood to gypsum ratio, when the retarder of gypsum paste hydration is used, the
compressive strength decreases. Generally, the lowest strength is for gypsum + bagasse or/and kenaf fi bers samples. Values show that when lignocellulosic fi bers are used in the test mixture, there is a lower strength than treatments in which only extractives are applied.
RSM model
The effect of the variables including fi berglass (X1),
kenaf fi ber (X2) and bagasse fi ber (X3) on MOR predicted
by the RSM model was compared to the experimental
data, and the results can be observed in Table 4. The
results are plotted in Fgure 5 to provide the coeffi cient
of determination (R2= 0.9070).
Coeffi cients of each variable in the quadratic
model and its estimated multiple regression equation are presented in Table 5 and Equation 5.
According to the regression coeffi cient (Table 5), it is observed that the linear coeffi cients (α α α1, 2, 3 ) of MOR are positive. Positive values show that the
increase in fi berglass, bagasse and kenaf fi bers for making panels increases MOR. Maximum MOR is 11 MPa for the board Nº 16 (6% fi berglass, 15% bagasse fi bers and 15% kenaf fi bers), meeting the standard
FIGURE 5 Compression strength of gypsum paste samples.
TABLE 4 The experimentally obtained MOR of panels compared to that predicted by RSM model and ANN.
Run
Actual values of variabels
(%)
Experimental MOR (MPa)
RSM predicted MOR (MPa) &
Error
ANN predicted MOR (MPa) &
Error X1 X2 X3
1 0 15 15 6.70 7.02 (-0.32) 6.69 (0.0009) 2 3 7.5 7.5 6.30 6.34 (-0.04) 6.175 (0.125) 3 3 15 7.5 8.10 7.87 (0.23) 8.1 (-0.0003) 4 3 7.5 7.5 6 6.34 (-0.34) 6.175 (-0.175) 5 6 15 0 9.3 9.63 (-0.32) 9.943 (-0.643) 6 0 0 0 1.9 2.02 (-0.12) 1.9 (-0.000009) 7 0 15 0 5.9 5.83 (0.065) 5.49 (0.407) 8 3 7.5 7.5 6.5 6.34 (0.16) 6.175 (0.325) 9 3 7.5 7.5 6.3 6.34 (-0.04) 6.175 (0.125) 10 6 0 15 8.9 8.49 (-0.41) 8.902 (-0.0026) 11 3 0 7.5 5 4.81 (0.19) 4.99 (0.00064) 12 3 7.5 15 7.4 7.53 (-0.13) 7.4 (-0.0008) 13 3 7.5 0 5.3 5.15 (0.15) 5.3 (-0.0016) 14 6 7.5 7.5 8.70 8.46 (0.24) 8.7 (0.000008) 15 0 7.5 7.5 5.6 5.12 (0.48) 6.1 (0.699) 16 6 15 15 11 10.81 (0.2) 11.00 (-0.0002) 17 3 7.5 7.5 6.4 6.34 (0.06) 6.175 (0.225) 18 6 0 0 4.8 4.91 (-0.11) 4.79 (0.007) 19 3 7.5 7.5 6.00 6.34 (-0.34) 6.175 (-0.175) 20 0 0 15 5.5 5.6 (-0.1) 4.96 (-0.53)
(X1), kenaf fi ber (X2) and bagasse fi ber (X3)
Bison (Hz) (1978) and EN 634-2 (2007), that is 9 MPa. It is clear from Table 5 that the quadratic terms (glass fi ber (X12)), interactive term (glass fi ber × kenaf fi ber (X
1X2) and kenaf fi ber × bagasse fi ber (X2X3)) and linear terms
(glass fi ber (X1), kenaf fi ber (X2) and bagasse fi ber (X3))
have large effects on the MOR due to their higher F values as well as lower p-values.
ANOVA was used to illustrate which variables
are statistically signifi cant in the determination of MOR at the confi dence interval 95% (Table 6). MOR values
range from 1.9 to 11 MPa. According to Table 6, the
Model F-value of 166.27 shows the model is signifi cant. In fact, there is no chance that a “Model F-Value” is
equal to this value due to the noise. Values less than 0.0500 for X1, X2, X3, X1X2, X2X3, X12 indicate that
these model terms are signifi cant, namely model
reduction may improve the model (Table 5). The value
2.65% for the “Lack of Fit F-value” shows that the Lack of Fit is not signifi cant relative to the pure error
which it is good. Moreover, a high F value (166.27) with a low probability (p=0.0001) indicates the high ability of the model in predicting the results. The predicted
R-squared of 0.9070 is in full agreement with the adjusted R-squared of 0.8812.
TABLE 5 Regression analysis of RSM model for the MOR of panels, with the associated statistical signifi cance of each coeffi cient.
Coeffi cient Value F-value p-value β0 6.39 123.45 < 0.0001 βx1 1.67 442.43 < 0.0001 βx2 1.53 371.36 < 0.0001 βx3 1.19 224.65 < 0.0001
βx1x1 0.59 15.00 0.0031
βx2x2 -0.014 0.00811 0.9300
βx3x3 -0.21 1.99 0.1886
βx1x2 0.22 6.42 0.0296
150.9, respectively, showing that the slenderness ratio of
fi berglass is much higher than that of bagasse and kenaf fi bers. It is observed that the higher the fi berglass used for making gypsum-bonded fi berboard compared to bagasse and kenaf fi bers, the fl exural strength properties (MOR) increase (Figure 7). The reason can be attributed to the
strong effective grid produced due to the connections
between gypsum particles and fi berglass surface. These fi bers are largely compatible with minerals and lead to a rather strong connection and mix with minerals desirably
(Eusebio and Suzuki 1990, Bogue 1964, Hachmi and
Moslemi 1990). Fiberglass is resistant to alkalis and
signifi cantly affects the composite quality due to its
surface activities and hence, it has desirable compatibility with mineral (Eusebio and Suzuki 1990). Due to their
high desire to form a bond with minerals, mineral fi bers
provide better and stronger bonding conditions for the
cohesion between wood, fi bers and cement(Mashima et
al. 1994, Eusebio and Suzuki 1990). Findings of Cao et
al. (2006) and Ganesan et al. (2007) showed that using
fi bers for making fi ber-cement composites improved the mechanical properties, especially the fl exural strength.
They attributed the reason to the high contact surface, formation of a more effective grid and increase in the
cohesion of fi bers with cement particles.
FIGURE 7 Direct effect of the glass, kenaf and bagasse fi ber contents on MOR.
FIGURE 6 Direct effect of the glass, kenaf and bagasse fi ber contents on MOR.
The direct effect of three variables on the MOR is shown in fi gure 6. When the content of glass fi ber, kenaf
fi ber and bagasse fi ber in the panel varied from 0 to 6%, 0
to 15% and 0 to 15%, respectively, MOR value increased
continuously, but the effect of glass fi ber content is greater than others as shown in fi gure 6 and Table 5.
The interactive effects of the variables (bagasse
× kenaf fi bers content and kenaf fi bers × glass fi ber) showed that increasing the content of glass, kenaf
and bagasse fi bers, the fl exural strength (MOR) also
increases (Figure 7).
The reason can be attributed to the high fl exibility and slenderness ratio of the fi bers (Mashima et al. 1994, Takahashi 1986). This fact affects the brittleness of gypsum composites. Due to their high slenderness ratio,
mineral fi bers such as fi berglass also improve the fl exural
strength and stiffness of the panels based on mineral
binders such as gypsum. This result was in agreement
with the previous study that using natural fi bers such as bagasse combined with other lignocellulosic waste
materials for making gypsum-bonded particleboard increases the fl exural strength due to their desirable fl exibility (Nazerian and Kamyab 2013). The lowest value
of MOR is related to the specimen without any fi ber (Figure 7). According to Table 1, the slenderness ratio of fi berglass, bagasse and kenaf fi bers is
≥
300, 68.8 andTABLE 6 Analysis of variance (ANOVA).
Source Sum of
squares df F-value P-value
Model 69.76 6 166.27 0.0001 Residual error 0.63 10 - Lack-of-fi t 0.74 8 2.65 0.1487
Pure error 0.17 5 -
NAZERIAN et al.
Artifi cial neural network
In order to determine the suitability of the model,
the experimental (actual) values of MOR were compared
to those predicted by ANN model. The experimental and predicted values for each experiment were plotted against the run numbers (Figure 8). This fi gure consists of the perfect fi t line y=x (predicted data = experimental data with a high degree of correlation) and best fi t line described by the best linear equation (y = mx + c) with a high coeffi cient of determination (R2 = 0.9837).
FIGURE 8 Correlation coeffi cient for mean MOR (ANN).
In order to predict the MOR values of gypsum-bonded fi berboard, the experimental data were grouped
into four data sets. The number of hidden neurons between 4 and 10 was selected and evaluated to determine a favorable ANN model. Mean square error (MSE) of the selected hidden neurons in the model was
calculated, including 4, 6, 8 and 10 (0.6, 0.065, 0.007
and 0.35, respectively). Hence, 8 hidden neurons were chosen for the model.
The results of MOR value prediction using the developed ANN model are exhibited in Table 4, which included an input layer with three neurons (content of
glass fi ber, kenaf fi ber and bagasse fi ber), an output layer
with one neuron (MOR value), and 8 hidden neurons. According to the data sets used in the ANN prediction model (Figure 9), the correlation coeffi cient (R) of the predicted values (output) versus the actual values (target) were 0.99946, 0.98783, 0.99942 and 0.99183 for the training, validation, testing and all data sets, respectively.
These R values between experimental response
and ANN predicted response showed in all the cases that
there was a good correlation between the experimental
and predicted values; so the developed ANN model
trained using experimental data predicted the studied
response (MOR) of panels precisely.
These R values between experimental and
predicted values showed in all the cases that there was a good correlation between the actual and predicted values;
FIGURE 9 Correlation coeffi cient for mean MOR (ANN).
FIGURE 10Comparison of RSM and ANN predictions with the experimental mean values of MOR.
and the developed ANN model, which was trained using actual values, predicted the panel MOR precisely. Also, R2 value suggests that 99.88% of the variation in the actual
and predicted values can be explained by the model.
Comparison of RSM and ANN
In order to estimate accurate prediction of the developed models, actual mean MOR values were compared with the mean MOR predicted values of
the ANN and RSM models as shown in fi gure 10. It is observed in the fi gure that the prediction of mean MOR
in both models is in full agreement with that of actual
ANN model predictions fit the line of perfect
prediction more than RSM model. Thus, ANN model is more capable of data generalization than RSM model. This higher accuracy of prediction by ANN can be related to its approximation ability through nonlinearity of the system (Maran et al.2013), whereas RSM belongs only
to a second-order polynomial (Shanmugaprakash and Sivakumar 2013). However, the negative effect of using
ANN technique lies in its limited prediction due to the application of some studied variables and factors through the training process (Rajkovic et al. 2013).
the models. The relationships between these values obtained using the CCRD and ANN models are shown
in figures 5 and 8, respectively. According to Figure 8,
R2 values in training, validating and testing the data sets for MOR are greater than 0.99%. This result implies
that the model designed is capable of explaining at least
0.99% of the measured data. These values also support the applicability of ANN. On the other hand, R2 values in quadratic model are 90.70% for MOR, which are desirable. These results indicated that the models used in both methods can be selected for accurate predictions,
since they both have high explanatory values. However, the normal probability diagram of the
measured-predicted values for ANN and quadratic models show that in the ANN model, data are more closely distributed
on straight line (Figure 8) than those in quadratic model (Figure 5). This means that the errors in ANN model
are distributed more normally. Hence, ANN model is selected as the regression model of MOR. Other studies
are carried out about the strength properties of
wood-based composites, but R2 values obtained by ANN and quadratic models in this study are higher compared to other studies (FERNANDEZ et al. 2008, DEMIRKIR et al. 2013, ESLAH et al. 2012).
The interactions among three parameters investigated for the bending strength of the panels are
examined using three dimensional surface plots (Figure11).
As it can be seen, there is a considerable similarity
between Figures 7 and 11. The relationship between the content of kenaf fiber and glass depicted in Figure 7. The figure shows both parameters interact with each other, which significantly affects the MOR value of the panels. MOR value of the panels is highest at the highest kenaf and glass fiber loading. As the loading of both kenaf and glass fibers decreases, MOR value of the panels decreases.
MOR value decreased from over 10.11 MPa to
less than 4MPa. Similarly, figure 11 shows MOR value
as a function of input parameters including the content
of kenaf fiber and bagasse fiber in three dimensional patterns. The lowest MOR value is observed at kenaf fiber content loading 0% and bagasse content 0%. Increasing the content of kenaf and bagasse fibers, MOR
value of panels increases; so, MOR value decreased from over 8.9 MPa to less than 2.4MPa.
CONCLUSSION
The study of the hydration process showed that
the higher the non-wood extractives, the higher the setting time of the paste containing the extractives. On
the other hand, the resulting temperature decreases.
TABLE 7 Performance evaluation of RSM and ANN models. Coefficient Value F-value p-value
β0 6.39 123.45 < 0.0001 βx1 1.67 442.43 < 0.0001 βx2 1.53 371.36 < 0.0001 βx3 1.19 224.65 < 0.0001
βx1x1 0.59 15.00 0.0031
βx2x2 -0.014 0.00811 0.9300
βx3x3 -0.21 1.99 0.1886
βx1x2 0.22 6.42 0.0296
βx1x3 0.13 1.98 0.1894
ANN predicted values of the experimental
samples of MOR and their errors are given in Table 4. The model showed good prediction performance. Moreover, the results indicated that the values predicted by ANN had a low percent of error that is satisfactory for predicting MOR values.
R2, Adjusted R2, RMSE and MAE values used to evaluate the performance of ANN and quadric models developed in this study are given in Table 7. The calculated R2 and adjusted R2 of the ANN model were 0.9837 and 0.9619, respectively; however, the determination
coefficients and adjusted determination coefficients for
RSM models were 0.9070 and 0.8812, respectively.
The high value of R2 obtained for ANN model is
indicative of its better fit (Joglekar and May 1987). The
model’s generalizability can be verified by its prediction
accuracy for a validation data set (Eslah et al. 2012). RMSE and MAE values for ANN were less than those for RSM as shown in Table 1. These results show that the predication of RSM model has a greater deviation than the prediction of ANN model. This also means that the
experimental data are fitted with a higher accuracy using
the ANN model.
As seen from the results, ANN approach has shown better prediction performance than the quadratic approach based on the evaluation criteria and has a
sufficient accuracy level in the prediction of MOR values. The determination coefficient (R2) between the measured
NAZERIAN et al.
Moreover, the longest setting time of the test treatments is related to pure gypsum with water. In addition, among
treatments in which only fi bers are used in the gypsum
paste, the longest setting time is related to the paste
containing bagasse fi bers.
Production of gypsum-bonded fi berboard using bagasse fi bers, kenaf fi bers and fi berglass as the reinforcing fi bers increases the bending strength of the boards. Increasing bagasse and kenaf fi bers when making
mineral composites, the MOR increase, but the effect of
fi ber glass was higher than others.
The fl exural properties modeling were developed
to predict the bending strength. The prediction of not only ANN model but also RSM were found to be in good
agreement with experimental data.
The predictive ANN model is found to be capable
of better predictions of fl exural properties within the
range that they had been trained. The results of the ANN
model indicate it is much more confi dent and accurate
in estimating the values of bending strength when compared with the response surface model
REFERENCES
AHN, W.Y.; MOSLEMI, A. SEM examination of wood-Portland cement bonds. Wood Science , v. 13, n. 2, p. 77-82, 1980.
BOARD, B.W. C. Bison-Report, Links, 1978.
BALASUBRAMANIAN, M.; JAYABALAN, V.; BALASUBRAMANIAN, V. A mathematical model to predict impact toughness of pulsed-current gas tungsten arc-welded titanium alloy. International Journal of Advanced Manufacturing Technology, v. 35, n. p. 852-858, 2008.
BOGUE, R. H. The chemistry of Portland cement, Reinhold publishing corporation, USA, 1964.
CAO, Y., SHIBATA, S.; FUKUMOTO, I. Fabrication and fl exural properties of bagasse fi ber reinforced biodegradable composites. Journal of Macromolecular Science, v. 45, n. 4, p. 463-474, 2006.
CHEOK, C. Y.; CHIN, N. L.; YUSOF, Y. A.; TALIB, R. A.; LAW, C. L. Optimization of total phenolic content extracted from Garcinia mangostana Linn. hull using response surface methodology versus artifi cial neural network. Industrial Crops and Products, v. 40, n. ,p. 247-253, 2012.
COOK, D. F.; CHIU, C. Predicting the internal bond strength of particleboard, utilizing a radial basis function neural network. Engineering Applications of Artifi cial Intelligence, v. 10, n. 2, p. 171-177, 1997.
COUTTS, R. Banana fi bres as reinforcement for building products. Journal of Materials Science Letters, v. 9, n. 10, p. 1235-1236, 1990.
COUTTS, R. Flax fi bres as a reinforcement in cement mortars. International Journal of Cement Composites and Lightweight Concrete, v. 5, n. 4, p. 257-262, 1983.
COUTTS, R.; NI, Y.; TOBIAS, B. Air-cured bamboo pulp reinforced cement, Journal of Materials Science Letters, v. 13, n. 4, p. 283-285, 1994.
DALMAY, P.; SMITH, A.; CHOTARD, T.; SHAY-TURNER, P.; GLOAGUEN, V.; KRAUSZ, P. Properties of cellulosic fi bre reinforced plaster: infl uence of hemp or fl ax fi bres on the properties of set gypsum. Journal of Material Science, v. 45, n. 3, p. 793-803, 2010.
DEMIRKIR, C.; OZSAHIN, S.; AYDIN, I.; COLAKOGLU, G. Optimization of some panel manufacturing parameters for the best bonding strength of plywood. International Journal of Adhesion and Adhesives, v. 46, p. 14-20, 2013.
EN 634-2, Cement-bonded particleboards-Specifi cations-Part 2: Requirements for OPC bonded particleboards for use in dry, humid and external conditions, European Standardization Committe, Brussels, Belgium, 2007.
ESLAH, F.; ENAYATI, A.; TAJVIDI, M.; FAEZIPOUR, M. Regression models for the prediction of poplar particleboard properties based on urea formaldehyde resin content and board density. Journal of Agricultural Science and Technology, v. 14, n. 6, p. 1321-1329, 2012.
EUSEBIO, D.; SUZUKI, M. Production and properties of plant materials cement-bonded composites, Bulletin of the Experiment Forests, Tokyo University of Agriculture and Technology, v. 27, p. 27-38, 1990.
EVE, S.; GOMINA, M.; GMOUH, A.; SAMDI, A.; MOUSSA, R.; ORANGE, G. Microstructural and mechanical behaviour of polyamide fibre-reinforced plaster composites. Journal of the European Ceramic Society, v. 22, n. 13, p. 2269-2275, 2002.
FERNANDEZ, F. G.; ESTEBAN, L. G.; DE PALASIOS, P.; NAVARRO, M.; CONDE, M. Prediction of standard particleboard mechanical properties utilizing an artificial neural network and subsequent comparison with a multivariate regression model. Forest Systems, v. 17, n. 2, p. 178-187, 2008.
GANESAN, K.; RAJAGOPAL, K. Thangavel, Evaluation of bagasse ash as supplementary cementitious material. Cement and Concrete Composites, v. 29, n. 6, p. 515-524, 2007.
HACHMI, M. H.; MOSLEMI, A. Correlation between wood-cement compatibility and wood extractives. Forest Products Journal, v. 39, n. 6, p. 55-58, 1989.
HACHMI, M. H.; MOSLEMI, A. Effect of wood pH and buffering capacity on wood-cement compatibility. Holzforschung, v. 44, n. 6, p. 425-430, 1990.
HERNANDEZ-OLIVARES, F.; OTEIZA, I.; DE VILLANUEVA, L. Experimental analysis of toughness and modulus of rupture increase of sisal short fiber reinforced hemihydrated gypsum. Composite Structures, v. 22, n. 3, p. 123-137, 1992.
HOFSRAND, A.; MOSLEMI, A.; GARCIA, J. F. Curing characteristics of wood particles from nine northern Rocky mountain species mixed with Portland cement. Forest Products Journal , v. 34, n. 2, p. 57-61, 1984.
JOGLEKAR, A.; MAY, A. Product excellence through design of experiments, Cereal Foods World, v. 32, p. 857-364, 1987.
KALOGIROU, S. A. Artificial neural networks in renewable energy systems applications: a review. Renewable and Sustainable Energy Reviews, v. 5, n. 4, p. 373-401, 2001.
LAKSKHMINARAYANAN, A.; BALASUBRAMANIAN, V. Comparison of RSM with ANN in predicting tensile strength of friction stir welded AA7039 aluminium alloy joints.Transactions of Nonferrous Metals Society of China, v. 19, n. ,p. 9-18, 2009.
LEMPFER, K.; HILBERT, T.; GUNZERODT, H. Development of gypsum-bonded particleboard manufacture in Europe. Forest Products Journal , v. 40, n. 6, p. 37-40, 1990.
MADADLOU, A.; EMAM-DJOMEH, Z.; MOUSAVI, M. E.; EHSANI, M.; JAVANMARD, M.; SHEEHAN, D. Response surface optimization of an artificial neural network for predicting the size of re-assembled casein micelles. Computers and Electronics in Agriculture, v. 68, n. ,p. 216-221, 2009.
MARAN, J. P.; SIVAKUMAR, V.; THIRUGNANASAMBANDHAM, K.; SRIDHAR, R. Artificial neural network and response surface methodology modeling in mass transfer parameters predictions during osmotic dehydration of Carica papaya L. Alexandria Engineering Journal, v. 52, n. 3, p. 507-516, 2013.
MASHIMA, M.; KOUSA, K.; OHNO, S. Fiber reinforced cement and concrete (in Japanese), Gihoudou Press, Japan, 1994.
MIRSOLEIMANI-AZIZI, S. M.; AMOOEY, A. A.; GHASEMI, S.; SALKHORDEH-PANBECHOULEH, S. Modeling the Removal of Endosulfan from Aqueous Solution by Electrocoagulation Process Using Artificial Neural Network (ANN), Industrial & Engineering Chemistry Research, v. 54, n. , p. 9844-9849, 2015.
MOSLEMI, A. Fiber and Particleboards Bonded with Inorganic Binders: International Conference: Papers, Forest Products and Research Society,1989.
MOSLEMI, A.; GARCIA, J. F.; HOFSTRAND, A. Effect of various treatments and additives on wood-Portland cement-water systems. Wood and Fiber Science, v. 15, n. 2, p. 164-176, 1983.
MOSLEMI, A.; LIM, Y. Compatibility of southern hardwoods with Portland cement. Forest Products Journal , v. 34, n. (7/8), p. 22-26, 1984.
Movagharnejad, K.; Nikzad, M. Modeling of tomato drying using artificial neural network, Computers and Electronics in Agriculture , v. 59, n. , p. 78-85, 2007.
NAZERIAN, M.; KAMYAB, M. Gypsum-bonded particleboard manufactured from agricultural based material. Forest Science and Practice, v. 15, n. 4, p. 325-331, 2013.
OZSAHIN, S. Optimization of process parameters in oriented strand board manufacturing with artificial neural network analysis, European Journal of Wood and Wood Products, v. 71, n. 6, p. 769-777, 2013.
RAJKOVIC, K. M.; AVRAMOVIĆ, J. M.; MILIĆ, P. S.; STAMENKOVIĆ, O. S.; VELJKOVIĆ, V. B. Optimization of ultrasound-assisted base-catalyzed methanolysis of sunflower oil using response surface and artifical neural network methodologies. Chemical Engineering Journal, v. 215-216, p. 82-8, 2013.
RAPOPORT, J. R.; SAHAH, S. P. Cast-in-place cellulose fiber-reinforced cement paste, mortar, and concrete. ACI Materials Journal, v. 102, n. 5, p. 299-306, 2005.
ROBERTS, M. H. Effect of admixtures on the composition of the liquid phase and early hydration reactions in Portland cement pastes, International Symposium on Admixtures for Mortar and Concrete /Belg/, 1967.
SEMPLE, K.; EVANS, P. D.; CUNNINGHAM, R. B. Compatibility of 8 temperate Australian Eucalyptus species with Portland cement. Europian Journal of Wood and Wood Products, v. 58, n. 5, p. 315-316, 2000.
SHAMUGAPRAKASH, M.; SIVAKUMAR, V. Development of experimental design approach and ANN-based models for determination of Cr (VI) ions uptake rate from aqueous solution onto the solid biodiesel waste residue. Bioresource Technology, v. 148, n. , p. 550-559, 2013.
SIMATUPANG, M.; LANGE, H.; KASIM, A., SEDDING, N. Influence of wood species on the setting of cement and gypsum, in: A.H. Moslemi, MP (Ed.) Fibre and particleboards bonded with inorganic binders. Forest Products and Research Society, Madison (WI), 1989, pp. 33-42.
SINGH, S. Investigations into the causes of poor strength of portland cement bonded lignocellulosic materials. Journal of the Indian Academy ofWood Science, v. 17, n. 10, p. 15-19, 1979.
T.TAPPI, 204 cm-97, Solvent extractives of wood and pulp, TAPPI test methods, 2004.
T.TAPPI, 211 om-16, Ash in wood, pulp, paper and paperboard: combustion at 525°C, TAPPI test methods, 2009.
T.TAPPI, 222 om-98, Modified procedure to determine acid-insoluble lignin in wood and pulp, TAPPI test methods, 1998.
TAKAHASHI, T. A feature of linen and ramie, Sen’i Gakkaishi (in Japanese), v. 42, n. 4, p. 319-321, 1986.
VAICKELIONIS, G.; VAICKELIONIENE, R. Cement hydration in the presence of wood extractives and pozzolan mineral additives. Ceramics-Silikáty, v. 50, n. 2, p. 115-122, 2006.
WANG, J.; WAN, W. Optimization of fermentative hydrogen production process using genetic algorithm based on neural network and response surface methodology, International Journal of Hydrogen Energy, v. 34, n. , p. 255-261, 2009.
WATANABE, K.; KORAI, H.; MATSUSHITA, Y.; HAYASHI, T. Predicting internal bond strength of particleboard under outdoor exposure based on climate data: comparison of multiple linear regression and artificial neural network. Journal ofWood Science , v. 61, n.2,p. 151-158, 2015.
WILLIAM, G. M. C.; COCHRAN, G. Experimental Designs, 2nd Edition, J. Willey and Sons, New York, USA, 1992.
ZHANG, G.; PATUWO, B. E.; HU, M. Y. Forecasting with artificial neural networks: The state of the art. International Journal of Forecasting, v. 14, n. 1, p.35-62, 1998.
ZHENGTIAN, L.; MOSLEMI, A. Influence of chemical additives on the hydration characteristics of western larch wood-cement-water mixtures. Forest Products Journal , v. 35, p. 37-43, 1985.