M
ASTER IN
F
INANCE
M
ASTER
’
S
F
INAL
W
ORK
P
ROJECT
E
QUITY
R
ESEARCH
–
S
ONANGOL
E.P.
H
ENRIQUE
J
ORGE DE
C
ARVALHO
S
ETAS
F
ERREIRA
M
ASTER
I
N
F
INANCE
M
ASTER
’
S
F
INAL
W
ORK
P
ROJECT
E
QUITY
R
ESEARCH
–
S
ONANGOL
E.P.
H
ENRIQUE
J
ORGE DE
C
ARVALHO
S
ETAS
F
ERREIRA
T
UTOR
:
PROF.
DOUTOR
CARLOS
MANUEL
COSTA
BASTARDO
RESUMO
Titular de uma posição preponderante no sector petrolífero, a Sonangol E.P. (designada daqui para frente como “Sonangol” ou “Grupo”) é a maior empresa pública a operar em Angola e umas das maiores a operar em África. Esta, detém uma linha de negócios que integra toda a cadeia de valor referente ao negócio petrolífero, nomeadamente, desde a extracção de petróleo e gás natural, até a sua transformação, distribuição e venda ao consumidor final. Com uma carteira de investimentos muito diversificada, o Grupo possui interesses e investimentos em outros sectores de actividade, que colocam a empresa no topo das maiores em termos de receitas e activos em África.
Contudo, sendo o principal veículo de desenvolvimento económico-financeiro em Angola, fruto dos avultados investimentos que realiza tanto no mercado doméstico como no internacional, a Sonangol E.P. depara-se com inúmeros desafios futuros consequentes da actual conjuntura macroeconómica vivida no País bem como a recente queda dos preços do petróleo.
Assim, este Trabalho Final de Mestrado tem como objetivo avaliar a Sonangol E.P. e determinar o valor intrínseco das suas acções, através de um processo exaustivo de análise do Grupo, da indústria e das previsões de crescimento. A avaliação foi realizada pelo método do
Free Cash Flow to the Firm (FCFF) que de acordo com a revisão de literatura abordada
pretende conciliar a teoria e prática de modo a se apurar o valor intrínseco das acções da empresa. Como resultado desta avaliação, foi possível concluir que a Sonangol detém um valor empresarial (enterprise value) de aproximadamente 15 mil milhões de euros, estando o valor intrínseco de cada acção a rondar os 9.23 euros.
Para finalizar, este trabalho providencia uma base sólida de análise para uma possível venda parcial ou total da empresa pelo estado Angolano, assim como para o lançamento de um possível IPO (initial public offer).
Palavras-chave: Avaliação de Empresas, Free Cash-Flow to Firm, Enterprise Value,
II
ABSTRACT
With a Key position in the sector of Energies, Sonangol E.P. (hereinafter “Sonangol” or “Group”) is the largest state-run oil company operating in Angola, the Africa’s second-largest crude producer. Holder of a business line that integrates the entire value chain of oil & gas business, since its extraction to its distribution and sale to the final costumer, Sonangol holds investments and interests in other sectors (transportation, real estate, education, healthcare, etc) which places the company on top of the largest firms in terms of assets and revenues operating in Angola. However, as the main driving force of the Angolan economy, Sonangol presents large future challenges due to the current macroeconomic situation lived in the country as well as the actual fall in oil prices.
This Master’s Final Work aims to determine the underlying enterprise value of Sonangol, through a thorough analysis of the Group and the industry as well as its growth prospects. The valuation was based on Free Cash Flow to the Firm methodology, which according to the established in the literature review, conciliate the theory and practice to reach the real value of Sonangol’s share price.
With this evaluation it was possible to conclude that Sonangol’s enterprise value is EUR 15.566bn, being the intrinsic value of each share EUR 9.23.
Therefore this study provides a solid basis of analysis, for possible sale of the company by the Angolan state, as well as turning the Group public through an IPO process (Initial Public
Offer).
Keywords: Equity Valuation; Free Cash Flow To The Firm; Enterprise Value; Energy
III
ACKNOWLEDGMENTS
The completion of this undertaking could not have been possible without the participation and assistance of so many people whose names may not all be enumerated. Their contributions are sincerely appreciated and gratefully acknowledged.
However, my first and foremost “thank you!” goes to my thesis advisor Professor Carlos Bastardo. Throughout this project he has been a source of inspiration and a provider of encouragement and insightful comments since the very beginning of this project.
I am also indebted to Dr. Ana Serrano, Head of Investment Banking Department at Standard Bank Angola for suggesting this theme and provide many valuable comments. I also wish to express my gratitude to all staff members of Investment Banking Department at Standard Bank Angola for providing all essential materials for this project (reports, papers and tools) as well as a creative, supportive and pleasant environment to work. Special thanks also to my colleague Helga Silva for the many deep and insightful discussions and the rewarding collaborative work.
I wish to thank and dedicate this project to my family and friends who always motivated and supported me throughout my academic career. Finally, I would like to thank my parents, especially my mother, Gina Carvalho, without her continuous support and encouragement I never would have been able to achieve my goal. This one is for you Mom!
IV
TABLE OF CONTENTS
RESUMO ... I ABSTRACT ... II ACKNOWLEDGMENTS ... III FORMULA INDEX ... VII LIST OF CHARTS ... VII LIST OF TERMS AND ABBREVIATIONS ... VIII
1. INTRODUCITON... 1
2. LITERATURE REVIEW ... 2
2.1. Brief Overview ... 2
2.2. Valuation Methods ... 3
2.2.1. Discounted Cash Flows – DCF ... 3
2.2.1.1. Equity Valuation Models ... 3
2.2.1.2. Firm Valuation Models ... 5
2.2.1.3. Adjusted Present Value Model – APV ... 10
2.2.2. Relative Valuation ... 11
2.2.3. Contingent Claim Valuation ... 12
2.2.4. Asset Based Valuation ... 13
3. COMPANY PRESENTATION ... 14
3.1 Business Portfolio ... 15
3.2 Strategy and Future Goals ... 15
3.3. Operational Performance ... 16
4. INDUSTRY AND MACROECONOMIC OVERVIEW ... 19
4.1 Macroeconomic Outlook ... 19
4.2 Industry Overview ... 22
5. STRATEGIC ANALYSIS ... 25
5.1 SWOT ... 25
5.2. PORTER’S FIVE FORCES ... 25
6. EVALUATION ... 26
6.1 Methodology ... 26
6.2 Assumptions ... 26
6.2.1 Operational Assumptions ... 26
V
6.2.3. Investments in Working Capital ... 29
6.2.5 Cost of Debt ... 31 6.2.6 WACC ... 32 6.2.7 FCFF ... 32 7. VALUATION RESULT ... 33 8. SENSITIVITY ANALYSIS ... 33 9. CONCLUSION ... 35 REFERENCES ... 36 APPENDIXES ... 39
Appendix 1 – Sonangol Geographical Presence ... 39
Appendix 2 – Economic Indicators ... 39
Appendix 3 – Oil and other Liquids Prices ... 42
Appendix 4 – AOA/EUR Exchange Rates ... 43
Appendix 5 – Sonangol Key Financial Ratios ... 43
Appendix 6 – Sonangol E.P. Forecasted Balance Sheet ... 44
Appendix 7 – Sonangol Pnl Summary ... 45
Appendix 8 – Sonangol E.P. Industry Analysis Using Porters Five Forces Result ... 45
Appendix 9 - Assumptions: Turnover Forecast ... 47
Appendix 10 - Assumptions: Investment in Working Capital ... 49
Appendix 11 - Assumptions: Cost of Debt ... 50
Appendix 12 - Assumptions: Unlevered Beta and Beta Leverage Calculations ... 50
Appendix 13 - Assumptions: WACC Rate ... 51
Appendix 14 - Assumptions: Sensitivity Analysis ... 51
VI
TABLE INDEX
Table I - Valuation Approaches ... 3
Table II - Beta Approaches ... 9
Table III - Multiples Valuation Approaches ... 12
Table IV - Sonangol Business Portfolio ... 15
Table V - Angola's GDP ∆% ... 19
Table VI - China's GDP ∆% ... 20
Table VII - India's GDP ∆% ... 21
Table VIII - Canada GDP ∆% ... 21
Table IX - South Africa GDP ∆% ... 22
Table X - Taiwan GDP ∆% ... 22
Table XI - Forecast Revenues Key Assumptions ... 27
Table XII - Sonangol's Turnover Forecast ... 27
Table XIII - Operating Costs Assumptions ... 28
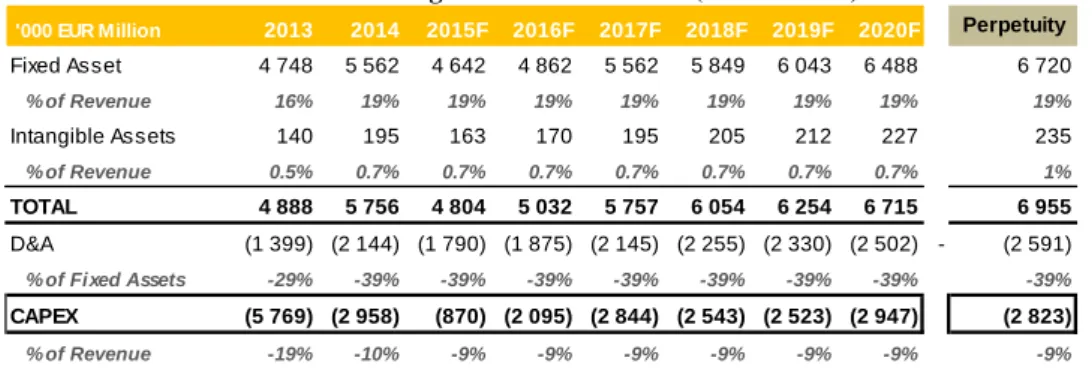
Table XIV - Sonangol's CAPEX Forecast (EUR Million) ... 29
Table XV - Key Assumption Regarding IWC ... 29
Table XVI - Cost of Equity Inputs ... 31
Table XVII - WACC Rate Inputs ... 32
Table XVIII - Sonangol E.P. FCFF Model (EUR Million) ... 32
Table XIX - Sonangol E.P. Valuation Result (EUR Million) ... 33
VII
FORMULA INDEX
Formula 1 - Dividend Discount Model: Stock Value ………...4
Formula 2 - Dividend Discount Model: Stock Value ………...4
Formula 3 - Equity Value (FCFE)………...5
Formula 4 – Free Cash Flow to the Firm………...6
Formula 5 – Free Cash Flow to the Firm ………....6
Formula 6 - Terminal Value or Value Continuity: Firm Value………...7
Formula 7 - WACC………...7
Formula 8 - Cost of Equity: CAPM……….8
Formula 9 - Adjusted Present Value Model (APV): Enterprise Value………..11
Formula 10 - Investment in Fixed Assets: CAPEX………...29
Formula 11 - Equity Risk Market………..31
Formula 12 - Cost of Debt………...31
LIST OF CHARTS Chart 1 – Global Oil & Gas Share Market in 2014……….24
Chart 2 – Global Oil and Gas Market Value Forecast………....24
VIII
LIST OF TERMS AND ABBREVIATIONS
APT – Arbitrage Pricing Theory APV – Adjusted Present Value
BMI – Business Monitor International BV – Book Value
CAGR – Compound Annual Growth Rate Capex – Capital expenditures
CAPM – Capital Asset Pricing Model CDS – Credit Default Swap
D – Debt
DCF – Discounted Cash Flow D/E- Debt to equity ratio
DDM – Dividend Discount Model DPS – Dividend per share
E – Equity
EBIT – Earnings before Interest and Taxes
EBITDA – Earnings before Interest, Taxes, Depreciation and Amortization EIA – Energy Information Administration
EPS – Earnings per share EV – Enterprise Value
EVA – Economic Value Added FCFE – Free Cash Flow to Equity FCFF – Free Cash Flow to Firm g- Perpetual Growth
IMF – International Monetary Fund IWC – Investments in Working Capital
OECD – Organization for Economic Cooperation and Development OPEC – Organization of the Petroleum Exporting Countries
PEG – Price/earnings to growth PER – Price-to-earnings ratio Re – Cost of Equity
Rd – Cost of Debt Rf – Risk Free Rate
IX ROA – Return on Assets
ROE – Return on Equity SOTP – Sum-of-the-Parts
WACC – Weighted Average Cost of Capital WB – World Bank
1
1. INTRODUCITON
The recent drop in oil prices was reflected in the deterioration of the main economies dependent on exports of this commodity. Angola, the second largest oil producer in Africa and holder of a very dependent economy on exports of oil was no exception. Therefore, Sonangol the national company that manages the hydrocarbon resource exploration in Angola whose operational and strategic performance in the past has been outstanding, presents now a lot of obstacles.
The aim of this project is to evaluate Sonangol and determine the intrinsic value of its shares, with the aim of proposing a possible sale of the company by the Angolan government. The dissertation structure addresses the most relevant issues and a common analysis of equity
research analysis, providing all the information available and necessary for an accurate and
plausible result.
Firstly will be conducted the literature review, where it will systematize the main studies and publications relating to methods of business valuation, the advantages that underlie each method, as well as their applicability.
Additionally, will be developed a detailed analysis of Sonangol E.P., in order to know its history, as well as its strategy, its portfolio and evolution of its operational performance.
After that, the macroeconomic and industry outlook will be presented in order to anticipate the main trends and prospects of the industry and identify the critical success factors that could impact the performance of Sonagol and therefore its intrinsic value. For the industry analysis a SWOT and Porter Strengths study will be presented.
At the end will be developed an economic-financial model based on a Free Cash Flow to the
Firm method (FCFF), which translate the collected information and assumptions in numbers
2
2. LITERATURE REVIEW 2.1. Brief Overview
Value is the defining dimension of measurement in a market economy. People invest in the expectation that when they sell, the value of each investment will have grown by a sufficient amount above its cost to compensate them for the risk they took. Therefore a company valuation is the process of determining the current worth / price of an asset or a company. According to Damodaran (2006) the value of any asset is a function of the cash flows generated by that asset, the life of the asset, the expected growth in the cash flow, and the riskiness associated with them.
In the world of corporate finance, understanding the mechanisms of company valuation is an indispensable requirement because “valuing the company and its business units helps identify sources of economic value creation and destruction within the company” (Fernández 2007)1. The valuation of companies is essential in many business contexts, particularly in active portfolio management and investment analysis (Damodaran 2002) where analysts and investors seek to identify companies whose shares are being traded below their intrinsic value in the hope of generating capital gains; mergers and acquisitions (Fernández 2007) identifying the maximum price the buyer is willing to pay, as well as the minimum price the seller is willing to receive; corporate finance (Goedhart 2005) it enables CEOs to “focus on long-term value creation confident that their stock’s market price will eventually reflect their efforts”2, litigation / bankruptcy proceedings (Jonathan Berk and Peter deMarzo 2013) intending to calculate the value of company assets to later proceed to its sale and meet commitments to creditors and shareholders.
In light of different valuation outcomes (Koller, Goedhart, & Wessels, 2005) argue that the final valuation depends on the subjectivity of the assumptions considered, as well as, the way that expectations are managed by the analyst/investor making all valuations biased
1 Fernández, P. (2007), Company Valuation Methods. The Most Common Errors in Valuations, IESE Business School 2 Goedhart, M., Koller, T. Wessels,D.(2005a), Measuring and Managing the Value of Companies, 4th Edition - The
3
(Damodaran 2002). The author stresses the fact that there are no precise valuations, and the direction and magnitude of the bias in valuations are directly proportional to who pays/required the service and how much it is paid.
2.2. Valuation Methods
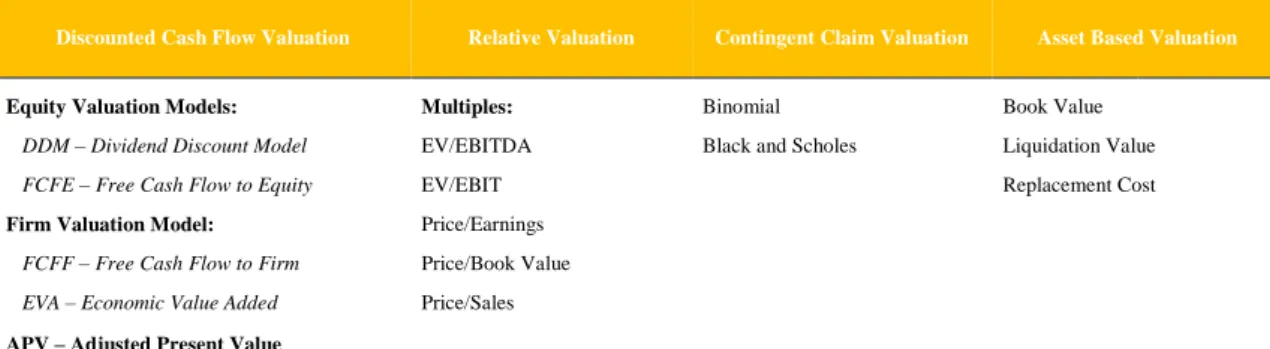
The existing valuation methods are grouped according to their authors. Fernández (2007) basis his valuation on 6 different groups, while Damodaran (2006) basis his valuation on 4 different groups – i) Discounted Cash-Flow Valuation, ii) Liquidation and Accounting Valuation, iii) Relative Valuation and iv) Contingent Claim Valuation.
Table I - Valuation Approaches
Discounted Cash Flow Valuation Relative Valuation Contingent Claim Valuation Asset Based Valuation
Equity Valuation Models: Multiples: Binomial Book Value
DDM – Dividend Discount Model EV/EBITDA Black and Scholes Liquidation Value
FCFE – Free Cash Flow to Equity EV/EBIT Replacement Cost
Firm Valuation Model: Price/Earnings
FCFF – Free Cash Flow to Firm Price/Book Value EVA – Economic Value Added Price/Sales
APV – Adjusted Present Value
Source: Damodaran, A. (2006), Valuation Approaches and Metrics: A Survey of the Theory and Evidence, Stern School of Business, New York University
2.2.1. Discounted Cash Flows – DCF
Discounted Cash Flow Valuation is a method that estimates the value of any asset by
discounting back the expected cash flows on that asset at a rate that reflects their riskiness (Damodaran 2006). As mentioned by the author an evaluation process measures the intrinsic value of an asset and the actual value of a company, and points out that “there are literally thousands of discounted cash flow models in existence”3 1e, to work around this, chooses to
categorize it into three groups: i) Equity Valuation; ii) Firm Valuation; iii) Adjusted Present
Value (APV) Valuation.
2.2.1.1. Equity Valuation Models
In equity valuation models, analysts/investors attempts to assess the company from the shareholders perspective where the cash flows are considered belonging to the equity holders and discounted at the rate of return required by them (cost of equity).
3Damodaran, A. (2002), Investment Valuation: Tools and Techniques for Determining the Value of Any Asset, 2nd Edition – University Edition, New York: John Wiley & Sons, Inc.
4
In this category it can be found two different models: i) Dividend Discount Model (DDM), in which the expected cash flow to the equity is equivalent to the expected shareholders dividends in perpetuity; ii) Free cash flow to the equity (FCFE), which are considered all cash flows distributed to shareholders, as well as the potentials, i.e. those that the company generates, but for some reason chooses not to distribute.
Dividend Discount Model (DDM)
Dividend Discount Model (DDM) is a method for valuing the price of a stock for a company which pays out dividends, assuming that the price of a stock is equivalent to the sum of all of its future dividend payments discounted to the present value. In general, the value of each action is given by:
[1]𝑆𝑡𝑜𝑐𝑘 𝑉𝑎𝑙𝑢𝑒 = ∑ 𝐸(𝑑𝑖𝑣𝑖𝑑𝑒𝑛𝑑𝑠 𝑝𝑒𝑟 𝑠ℎ𝑎𝑟𝑒)𝑖 (1+𝑘𝑒)𝑖
𝑖=∞ 𝑖=1
Various theories and variants of this base model have been developed to include the fact that companies distribute an amount of dividends depending on the development stage they are in.
In 1962, Gordon developed a model (Gordon Growth Model or Constant Growth Model) which states that, for companies with a stable growth and no dividend retain, the value of their equity can be represented as a growing perpetuity based on the expected dividend of the next period (Foerster and Sapp, 2005), confirming the need to estimate the annual dividends in perpetuity.
[2] 𝑆𝑡𝑜𝑐𝑘 𝑉𝑎𝑙𝑢𝑒 = ∑ 𝐸(𝑑𝑖𝑣𝑖𝑑𝑒𝑛𝑑𝑠 𝑝𝑒𝑟 𝑠ℎ𝑎𝑟𝑒)𝑖 (1+𝑘𝑒)𝑖 𝑖=∞
𝑖=1
In this method still stands out the development of two models that circumvent the limitations imposed by the general DDM and Gordon Growth Model. The first model mentioned by Damodaran (2006) is a natural extension of Gordon model data which includes two stages of growth: i) an initial period where the growth rate is not stable dividend and then ii) stabilizes and is expected to remain in perpetuity.
5
The second model, made by Fuller and Hsia (1984), is also a two-stage model, but initially assumes that the growth rate of the dividend increases linearly until a sustainable growth.
Free cash flow to the equity – FCFE
FCFE values a company’s equity by computing future cash flows to equity and discounting them at the expected cost of equity. Traditional CFE represent what is available for distribution to shareholders after capital expenditures and net working capital needs have been met, as well as, financial obligations (Damodaran, 2002 and 2006).
[3] Free Cash Flow to Equity = Net Income – Capital Expenditures + Depreciations - ∆ Non-Cash
Working Capital + (New Debt Issued – Debt Payments)
Damodaran (2006) compares DDM with FCFE, renaming the latter “potential dividend model”4, it means that if a company was to pay out to its shareholders all its cash flows after
debt payment and reinvestment needs, both DDM (considering company doesn’t inflate dividends by borrowing) and FCFE methods would yield the same value for the company.
2.2.1.2. Firm Valuation Models
These models develops another approach to valuation where the entire firm is valued, by discounting the cumulated cash flows to all claim holders (shareholders or creditors) in the firm by the weighted average cost of capital (the cost of capital approach) (Damodaran, 2006) or by adding the marginal impact of debt on value to the unlevered firm value (adjusted present value approach) (Kaplan and Ruback, 1995). Within this category of evaluation, the main models are the Free Cash Flow to Firm – FCFF and the Economic Value Added – EVA. In this project is only referenced the first model that will be used to assess Sonangol.
Free Cash Flow to Firm – FCFF
The FCFF model correspond to the sum of the cash flows that all holders of the company (e.g. common and preferred shareholders and creditors) are entitled.
4 Damodaran, A. (2006), Valuation Approaches and Metrics: A Survey of the Theory and Evidence, Stern School of
6
Damodaran (2002) defends that the cash flow to the firm can be measured in two ways. One is to add up the cash flows to all the different claim holders in the firm. Thus, the cash flows to equity investors (which take the form of dividends or stock buybacks) are added to the cash flows to debt holders (interest and net debt payments) to arrive at the cash flow to the firm. The other approach to estimating cash flow to the firm, which should yield equivalent results, is to estimate the cash flow to the firm prior to debt payments but after reinvestment needs have been met.
[4] 𝐹𝑟𝑒𝑒 𝐶𝑎𝑠ℎ 𝐹𝑙𝑜𝑤 𝑡𝑜 𝑡ℎ𝑒 𝐹𝑖𝑟𝑚 (𝐹𝐶𝐹𝐹) = 𝐸𝐵𝐼𝑇 (1 − 𝑇𝑎𝑥 𝑅𝑎𝑡𝑒) − (𝐶𝑎𝑝𝑖𝑡𝑎𝑙 𝐸𝑥𝑝𝑒𝑛𝑑𝑖𝑡𝑢𝑟𝑒𝑠 − 𝐷𝑒𝑝𝑟𝑒𝑐𝑖𝑎𝑡𝑖𝑜𝑛) − 𝐶ℎ𝑎𝑛𝑔𝑒 𝑖𝑛 𝑁𝑜𝑛𝑐𝑎𝑠ℎ 𝑊𝑜𝑟𝑘𝑖𝑛𝑔 𝐶𝑎𝑝𝑖𝑡𝑎𝑙
The difference between capital expenditures and depreciation (net capital expenditures) and the increase in noncash working capital represent the reinvestments made by the firm to generate future or contemporaneous growth.
Another way of representing the same equation is to sum up the net capital expenditures and the change in working capital, and state that value as a percentage of the after-tax operating income. This ratio of reinvestment to after-tax operating income is called the reinvestment rate, and the free cash flow to the firm can be written as:
[5] 𝐹𝑟𝑒𝑒 𝐶𝑎𝑠ℎ 𝐹𝑙𝑜𝑤 𝑡𝑜 𝑡ℎ𝑒 𝐹𝑖𝑟𝑚 (𝐹𝐶𝐹𝐹) = 𝐸𝐵𝐼𝑇 (1 − 𝑇𝑎𝑥 𝑅𝑎𝑡𝑒)– 𝐶𝑎𝑝𝑖𝑡𝑎𝑙 𝐸𝑥𝑝𝑒𝑛𝑑𝑖𝑡𝑢𝑟𝑒𝑠 + 𝐴𝑚𝑜𝑟𝑡𝑖𝑧𝑎𝑡𝑖𝑜𝑛𝑠 + 𝐷𝑒𝑝𝑟𝑒𝑐𝑖𝑎𝑡𝑖𝑜𝑛 – 𝛥 𝑊𝑜𝑟𝑘𝑖𝑛𝑔 𝐶𝑎𝑝𝑖𝑡𝑎𝑙 ± 𝑜𝑡ℎ𝑒𝑟 𝑁𝑜𝑛 𝑐𝑎𝑠ℎ 𝑖𝑡𝑒𝑚𝑠
Many authors argue that this model can serve multiple purposes. According to Goedhart et al (2005a), this model should be used in the evaluation of investment projects and in the evaluation of companies with multiple businesses; contrary to Damodaran (2002 and 2006) and Fernández (2009) who argue that this model should only be used in the evaluation of companies that claim to have a fixed capital structure.
Terminal Value or Continuity/Perpetuity Value
According to Kaplan & Ruback (1996), the FCFF Model is the most commonly-used DCF approach, on which the value of a leveraged firm can be calculated by discounting the unleveraged cash flows to the firm at the firm weighted average cost of capital (WACC).
7 Thus: [6] 𝐹𝑖𝑟𝑚 𝑉𝑎𝑙𝑢𝑒 = ∑ 1𝑛 𝑖 (1+𝑊𝐴𝐶𝐶)𝐹𝐶𝐹𝐹𝑖 𝑖+ 𝐹𝐶𝐹𝐹𝑛+1/(𝑊𝐴𝐶𝐶−𝑇𝐺𝑅) (1+𝑊𝐴𝐶𝐶)1
Indeed, this formula is composed by two stages: the first is computed the present value of cash-flows up to some preselected horizon date (n), which according to Ohlson & Zhang (1999) is rarely superior to 15 years; and the second is calculated to the present value of cash-flowsbeyond the horizon date referred as the terminal value (TGR represents the terminal growth rate).
WACC Rate
As mentioned above, one of the commonly-used discount rate in cash flow calculation approaches is the tax-adjusted discount rate or weighted average cost of capital (Kaplan & Ruback, 1996)5. According to this “method”, WACC represents a weighted average of the after-tax costs of different sources of capital (equity and debt), in which each one is weighted by the fraction of the capital structure it represents (Luehrman, 1997).
The weighted average cost of capital – WACC combines the rates of return required by shareholders and creditors and is calculated as follows:
[7] 𝑊𝐴𝐶𝐶 =𝐸+𝐷𝐸 𝑟𝑒 +𝐸+𝐷𝐷 𝑟𝑑(1 − 𝑇𝑐); where Re is the cost of equity and Rd is the cost of debt,
E is the equity and D the debt, and Tc is the corporate tax rate.
Indeed, WACC’s main advantage is that it bundles the two sources of capital together in order to discount them only once.
WACC variables:
- Cost of Equity (Re)
The cost of equity is the rate of return investors require on an equity investment in a firm (Damodaran, 2002). The most common theories to measure the cost of equity is the Capital Asset Pricing Model (CAPM) (Sharpe 1964), Fama-French Three-Factor Model (Fama e
5 Kaplan, S. N., and R. S. Ruback. "The Market Pricing of Cash Flow Forecasts: Discounted Cash Flow vs. the Method
8
French, 1992) and the Arbitrage Price Theory (APT) (Ross 1976), being the most used the CAPM model which according to Damodaran (2002) is “the risk and return model that has been in use the longest and is still the standard in most real world analyses”6.
According to Kaplan and Peterson (1998), the CAPM defines linear relationship between the cost of equity and the slope coefficient (beta) in a regression of the company’s equity returns. In other words, the CAPM embodied by Sharpe (1964), Lintner (1965) and Black (1972) conclude that the return of an asset is the sum of the risk-free rate and the risk-premium, which depends on beta. In order to calculate the expected return one needs the following inputs; risk free rate, security’s beta, equity risk premium and country risk premium if applicable.
[8]𝐶𝑜𝑠𝑡 𝑜𝑓 𝐸𝑞𝑢𝑖𝑡𝑦 = 𝑅𝑓 + 𝛽𝑖 (𝑅𝑚 − 𝑅𝑓) + CRP
- Risk Free Interest Rate (Rf)
In theory, a riskless asset can be defined as one for which the investor knows the expected returns with certainty, meaning that there is no default risk or risks associated with reinvestment. Damodaran (2008) considers that the only assets that meet these criteria are zero-cupon government bonds, without risk of bankruptcy, whose maturity is equal to the cash flows being discounted. Another important aspect to note is the fact that the risk-free interest rate and the cash flows must be in the same currency, otherwise the assessment may be biased by the inflation value. This is particularly severe in economies with high inflation rate (Damodaran, 2008).
- Beta (β)
Beta is the risk parameter of an individual asset, according to (Fama & French, 2004) “the market beta of asset I is the covariance of its return with the market return divided by the variance of the market return”7
.
6 Damodaran, A. (2002), Investment Valuation: Tools and Techniques for Determining the Value of Any Asset, 2nd
Edition – University Edition, New York: John Wiley & Sons, Inc.
7 Fama, Eugene F., and Kenneth R. French. 2004. "The Capital Asset Pricing Model: Theory and Evidence." Journal of
9
As beta is not directly observed on the market, it has to be estimated, which means developing a set of assumptions and methodologies.
According to Damodaran (2002), the conventional approach to estimating the beta of an investment is a regression of returns on the investment against returns on a market index over a reasonable time period. In practice there is a tendency to use a stock index, such as for example S&P500, as a proxy for the market portfolio, and estimate betas for stocks against the index.
The standard procedure for estimating betas is to regress stock returns against market returns, where the slope of the regression corresponds to the beta of the stock and measures the riskiness of the stock.
As an alternative to linear regression, may be used the beta of the unlevered beta of industry as an operating company – β𝑢, since companies operating in the same industry are exposed to similar operational risks (Goedhart et al 2005a). In turn, the beta of a leveraged company – β𝑙 can be obtained from its operating beta, using one of the three theories presented in the following table:
Table II - Beta Approaches
- Risk Premium
The risk premium is a significant input in all the asset pricing models. According to Damodaran (2002) the risk premium measures the “extra return” that would be demanded by investors for shifting their money from a riskless investment to an average risk investment”. In the standard approach to estimating equity risk premiums three basic approaches are used – the survey approach, where investors or managers are asked to provide estimates of the equity risk premium for the future, the historical return approach, where the premium is based upon how well equities have done in the past and the implied approach, where we use future
Fernández (2003) Damodaran (2002) Goedhart et al (2005ª)
𝛽𝑙= 𝛽𝑢+(𝛽𝑢−𝛽𝑑) ×D/E× (1−𝑇) 𝛽𝑙= 𝛽𝑢+(𝛽𝑢) ×𝐷/𝐸×(1−𝑇) 𝛽𝑙= 𝛽𝑢×(1+𝐷/𝐸) Source: Fernández (2003)
10
cash flows or observed bond default spreads to estimate the current equity risk premium (Damodaran, 2012 and Fernández, 2004).
The most common approach to estimating the risk premium is to base it on historical data by looking to the difference between average returns on stocks and average returns on riskless securities over an extended period of history.
- Cost of Debt (Rd)
The cost of debt measures the current cost to the firm of borrowing funds to finance projects.
The simplest scenario for estimating the cost of debt occurs when a firm has long-term bonds. The market price of the bond, in conjunction with its cupon and maturity can serve to compute a yield which is used as the cost of debt.
When no rating is available to estimate the cost of debt, Damodaran (2002) suggests checking the recent bank borrowing history or estimating a synthetic rating using interest coverage ratio.
2.2.1.3. Adjusted Present Value Model – APV
The Adjusted Present Value (APV), as developed by Myers (1974), defines the value of a levered firm as the value of an otherwise identical but unlevered firm plus the value of any “side effects” due to leverage. These side effects often include the tax shield of debt, expected bankruptcy costs, and agency costs. The APV provides a powerful framework for analyzing a variety of issues in corporate finance, and is especially useful in applications of corporate valuation.
[9]𝐸𝑛𝑡𝑟𝑒𝑝𝑟𝑖𝑠𝑒 𝑉𝑎𝑙𝑢𝑒 = ∑𝑖=𝑛(1+𝑟𝑑)𝐹𝐶𝐹𝐹𝑡𝑡+ 𝐹𝐶𝐹𝐹𝑛+1 (𝑟𝑑−𝑔)(1+𝑟𝑑)𝑛
𝑡=1 + 𝑃𝑉( 𝑇𝑎𝑥 𝑆ℎ𝑖𝑒𝑙𝑑) − 𝑃𝑉 (𝐵𝑎𝑛𝑘𝑟𝑢𝑝𝑡𝑐𝑦 𝐶𝑜𝑠𝑡𝑠)
According to Luehrman (1997), APV is highly helpful in the valuation of cross-border takeovers, although the use of the correct valuation approach depends on the nature of a firm’s capital structure (Kaplan & Ruback, 1996). Indeed, the APV represents a model which can incorporate easily the impact of dividend policy, or even transaction costs in financing, and is extraordinarily transparent concerning in adjustments to the discount rate (Myers, 1974).
11
Notwithstanding, the APV concept presents certain handicaps: first of all, the income from stocks can be taxed in a different way, when the investor files a personal tax return; in addition, analysts usually ignore the use of other financing side effects in order to avoid complexity in getting the APV estimation (Luehrman, 1997).
According to Damodaran (2002) there are many authors who believe that adjusted present value is a more flexible way of approaching valuation than traditional discounted cash flow models. This may be true in a generic sense, but APV valuation in practice has significant flaws. The first and most important is that most practitioners who use the adjusted present value model ignore expected bankruptcy costs. Adding the tax benefits to unlevered firm value to get to the levered firm value makes debt seem like an unmixed blessing. Firm value will be overstated, especially at very high debt ratios, where the cost of bankruptcy is clearly not zero and, in some instances, the cost of bankruptcy is higher than the tax benefit of debt.
2.2.2. Relative Valuation
In discounted cash flow valuation, the objective is to find the value of assets, given their cash flow, growth, and risk characteristics. In relative valuation, the objective is to value assets, based on how similar assets are currently priced in the market.
To compare the values of “similar” assets in the market, it needs to standardize the values in some way. They can be standardized relative to the earnings they generate, to the book value or replacement value of the assets themselves, or to the revenues that they generate (Damodaran, 2002).
Damodaran (2002) argued that evaluations based on multiple i) require fewer assumptions, so they become more rapid than the DCF valuations; ii) are simpler to present to clients; iii) reflect the state of the market, given that assess the relative value of assets rather than its intrinsic value.
Kaplan and Ruback (1995) add that the relative valuation presents better performance than the DCF valuation, as it incorporates the market expectations of the future cash flows and
12
interest rates. However, these authors found that the absence of similar companies can be a counter of this method.
Damodaran (2002) also added that the facility associated with this method may result in an inconsistent estimate because critical variables such as the level of risk, growth and cash flow potential, can be ignored. In addition, this author also emphasizes the ease of manipulation of some multiple (via the lack of transparency relative to the underlying assumptions) and the fact that market context is directly reflected in the evaluation, which can cause the (sub) or overestimate.
Therefore, Fernández (2002) defended that multiples are useful in a second stage of the valuation: after performing the valuation using another method, a comparison with the multiples of comparable firms enables analysts to gage the valuation performed and identify differences between the firms valued and the firms it is compared with.
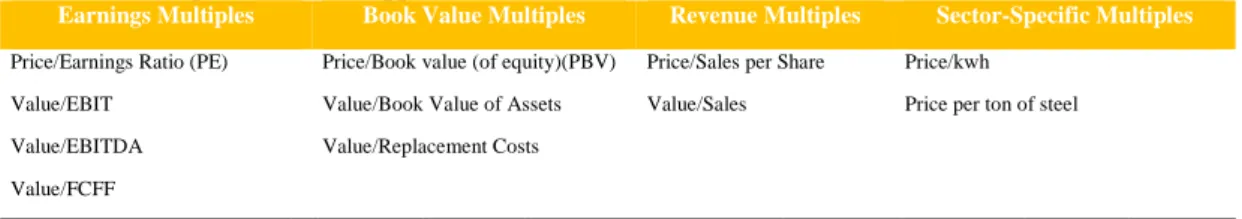
Table III - Multiples Valuation Approaches
Earnings Multiples Book Value Multiples Revenue Multiples Sector-Specific Multiples Price/Earnings Ratio (PE) Price/Book value (of equity)(PBV) Price/Sales per Share Price/kwh
Value/EBIT Value/Book Value of Assets Value/Sales Price per ton of steel
Value/EBITDA Value/Replacement Costs
Value/FCFF
Source: Damodaran, A., 2002, Investment Valuation: Tools and Techniques for Determining the Value of Any Asset, Second Edit ion, New York: John Wiley & Son
2.2.3. Contingent Claim Valuation
Contingent claim valuation, most commonly known as option theory, “uses option pricing models to measure the value of assets that share option characteristics” (Damoradan, 2006). For Luehrman (1997) “Option Pricing methods are most adequate to be used when valuing opportunities”8
. For some companies (e.g. new technologies or fast-growing markets) opportunities are their most valuable “asset”. Option valuation is used to decide whether or not to make a decision, having in mind the specific circumstances involved. This flexibility that options give are of great value and its impact on a company’s valuation is not considered in the methodologies explained before. The most widely used option pricing models are the
8 Luehrman, T. A., 1997, What's it Worth? A General Manager's Guide to Valuation, Harvard Business Review,
13
binomial and the Black-Scholes model. However, due to the complexity of these models and given the fact that they will not be applied on Sonangol’s valuation due to the lack of information, no further analysis will be presented.
2.2.4. Asset Based Valuation
In the asset-based approach, primary emphasis is placed on the fair market value of the assets and liabilities of a business (Damodaran, 2006). As a result, this approach uses three methods that consider the value of individual assets and liabilities. The first is the Liquidation Value, where the company's value is determined by the sum of recipes developed with the liquidation of its assets. The second one is the Replacement Cost in the company's value and represents the full costs that the company would have to replace all of its assets. The latest model is the book value, where it is considered that the company's value corresponds to the book value of its assets.
Considering that there are several accounting standards (e.g. GAAP and IFRS), comparability between companies from different sectors and countries may be called into question as well as the ease with which some companies accounting purposes manipulate cash flows and thus the value of the company.
14
3. COMPANY PRESENTATION
Established in 1976 Sonangol – (“Sociedade Nacional de Combustíveis de Angola, E.P.”) is an integrated oil and gas Angolan state-owned company whose mission is the management of hydrocarbon resource exploration in the country while maintaining its ongoing commitment to the development and growth of Angola. Despite having the government as the sole shareholder, Sonangol has always been governed as a private company and is under strict performance standards to ensure efficiency and productivity.
Sonangol's activities include exploration, development, marketing, production, transportation and refining of hydrocarbons and its derivatives. Those activities can be performed independently or in association with other companies - national or foreign. As the concessionaire, in 2014 Sonangol held stakes in 17 of the 26 blocks explored in Angola, reaching an average daily production of 1.6mn barrels of oil and 1.2mn bcm’s per year of dry natural gas. The Group holds 18 subsidiaries and exports oil and its derivatives mainly to 16 countries, namely: Brazil, Canada, Chile, China, France, Japan, India, Italy, Netherland, Portugal, South Africa, Spain, Sweden, USA, Uruguay and Taiwan.
As the country's main investment vehicle, Sonangol owns a diversified portfolio of investments both in domestic and international market, operating at this point in several other industries beyond the Energy Industry, namely: air services, telecommunications services, financial services, real estate, medical and medicines services, education and training services.
Sonangol E.P. is based in Luanda, Angola with additional offices in Brazzaville, Congo; Hong Kong; Houston, Texas; London, United Kingdom; and Singapore.
15
3.1 Business Portfolio
Sonangol’s business model consists of five primary business segments: Table IV - Sonangol Business Portfolio
3.2 Strategy and Future Goals
The Angolan government is targeting a daily average production of 1.8mn barrels (bbl) of oil in 2015. This is an increase of 10% relative to the growth rate foreseen in the General State Budget (OGE). Meanwhile, Sonangol E.P. plans to spend USD 8.8bn on exploration in the next decade, targeting an output of 2mn barrels per day (b/d) by 2017. China will lend USD 2bn to Sonangol to aid in the expansion of oil and gas projects. The financing agreement will last for 10 years, and the first project that will benefit from the fund will be the 200,000 b/d SonaRef oil refinery in Lobito.
Sonangol is planning to launch a bidding round for exploration of 12 new offshore oil blocks in 2015. Sonangol can sit back confidently and watch its international oil company operated projects begin to haul in impressive returns. Through careful placing of JV contracts, the firm benefits from the most up-to-date exploration and production (E&P) techniques, and the group’s reserves and profits look set to grow organically, without the need for any policy change or acquisition moves. The announcement that Angola is now China’s largest supplier of oil is encouraging news for Sonangol. Meanwhile, JVs will lead to the transfer of know-how, technical equipment and financial backing, benefiting production levels. Amid strong
Corporate & Finance Upstream Midstream Downstream Non-Core
This Segment includes the funding’s and investments of the Sonangol's Group. It has a total assets worth of
USD 14bn and it has a revenue value of approx. EUR1.2bn.
In this segment, Sonangol owns two subsidiaries namely, Sonangol E.P. and Sonangol Finance.
This Segment develops research activities and production of Oil&Gas in onshore and offshore, either as operator or as not operator in a joint venture. This is the most important
segment of the group, responsible for presenting about EUR 18bn of Revenues and a Total Assets value of EUR 17bn.
The Sonangol’s subsidiaries on this segments are: Sonangol Drilling, Sonangol Exploration and Production; Sonangol International Hydrocarbons and Sonangol Natural Gas.
This segment includes activities of transport and delivery of derivatives and refining of crude oil and natural gas.
Despite recorded revenues of EUR 1.7bn, this segment presented in FY2014 a negative net income due to the negative amount verified in the financial results and high operational costs. The company owns 35
subsidiaries on this segment being the most important the Sonangol Shipping and Sonangol Refining.
This Segment includes the storage activities, marketing and distribution of products to the final costumer. The company recorded on this segment Revenues of approx.EUR 7.6bn and has a total assets value of EUR 4bn. The subsidiaries on
this segment are: Sonangol Logistics, Sonangol Distributor and Sonangol International Marketing. Sonangol is the leading company operating on this segment.
This segment includes all "non-core" segments of the Group namely air services, healthcare, telecommunication and real estate investments. This segment contributed with revenues of approx. EUR 9.5mn.
Sonangol E.P. owns 10 different subsidiaries, being the most important the following: - Sonair, MsTelecom, Sonangol Holding, Sonangol Industrial Investments, Sonangol Real Estate Investments..
16
exploration activity, output will continue to rise with the government increasingly building relations with China, Beijing stands to benefit, while Angola’s membership of OPEC should bring significant technological and financial benefits, as well as increasing the government and Sonangol’s influence in international energy markets.
- Angola LNG
Regarding the natural gas sector, Angola LNG project is a JV of the major producers in the country including Sonangol, Chevron, BP, Eni and Total. Angola LNG plant has a processing capacity of 7.2n cubic meters (bcm) per annum and it is now under a massive reconstruction to fix design defects and corrosion of almost-new equipment. Officially, the plant will remain closed until mid-2015. However, extension of the closure could reportedly extend into 2016, depending on the scale of the renovation work.
- Discoveries and Surveys
Italian oil and gas company Eni has encountered a new deep-water oil discovery offshore in Angola with an estimated capacity to produce 300mn bbl of oil.
The Spain's Repsol will provide Sonangol with the tools for a seismic survey of the oil reserves in the so-called pre-salt layer. Under the terms of an agreement signed between the two companies, Sonangol's engineers will have the right to use the advanced technology designed by Repsol, to use it to survey oil reserves in the pre-salt layer.
3.3. Operational Performance
Analyzing the historical financial statements of Sonangol, it was possible to draw briefly the company's performance in terms of operational profit, debt capacity and realized investment as referenced below.
- Turnover
Until an alternative fuel source becomes readily available, oil will be in high demand allowing vertically integrated oil companies to generate astronomical revenues. In addition, the oil and gas production is capital intensive, especially when fuel costs are high. Given that, on the last
17
three years of analysis, Sonangol E.P. presented a compounded annual growth rate (CAGR) of 3.6% in the Total Turnover. The fiscal year (“FY”) of 2014 Sonangol recorded a total Turnover of approx. EUR 28.6bn, a decrease of 4.4% compared to the FY2013 due to the declining of oil prices registered on last quarter of the year as well as the decrease of 2.56% in the total production.
Sonangol’s Net Income in 2014 was approx. EUR 1.1bn, a decrease of 49% comparing to the previous year.
- EBITDA
Regarding EBITDA, in FY2014 the company totaled EUR 4.9bn compared to EUR 5.2bn in FY2013, a decrease of 5.6%. This decrease influenced by the serious “crise” recorder in oil prices, resulted in an EBITDA margin of 17.1% in FY2014, strengthening the company’s EBITDA with a CAGR of 2.3%.
Analyzing EBITDA margins by business segment it is possible to highlight that upstream segment was the largest contributor to the positive EBITDA margin with approx. 16%, followed by the Downstream and Midstream segment with EBITDA margin of 3.7% and 0.4% respectively.
It should be noted that Sonangol is the market leader in the downstream segment in Angola, because it is the only company responsible for the distribution of O&G products to the final customer. In what concerns to the upstream segment, Sonangol holds approx. 44% market share being the market leader in Angola.
- Investments
In terms of investment, in FY2014 the company comprised 88% of its investments in mining activity (research, development and exploration) and 12% in other financial investments (real estate projects and financial markets, more specifically energy funds) accounting for a total amount of EUR 14bn. This value had presented an increase of approx. 16% compared to FY2013 where the company recorded an investment amount of EUR 12bn.
18
It is notable that until the year 2014 Sonangol E.P. had about 80 participations in other companies. Highlighting the most important, it is to point out the majority stake in 8 banks (4 in Angola and 2 in Portugal) making it quite accessible the company’s recourse to bank credit. The net value of the investment in subsidiaries in 2014 was approx. of EUR 4.4bn.
- Leverage
Following the investments growth recorded in 2014 the company increased its debt to approx. EUR 12bn, an increase of 30% regarding FY2013 with approx. EUR 9.9bn. Nearly 82% of the Sonangol’s debt was from long-term debt and the remaining 18% short-term debt. The Sonangol’s current debt ratio for FY2014 was 29.5%. The net debt value presented in FY2014 was c. EUR 7.2bn and the Leverage ratio was 1.47x (Net Debt to EBITDA).
- Financial Structure
Analyzing Sonangol’s Financial Structure it is possible to highlight that the company has been aggressive in financing its growth with debt. Most of this funding was resorted to long term debt (Debt Structure of 30%), reducing the treasury cash pressure. The financial strength seems ensured, because it has 36% more Equity than the Total Debt subscribed. Sonangol presented in FY2014 a positive Working Capital value, showing that the company is in equilibrium in the short term, once the current assets are sufficient to pay current liabilities. The company has a financial solvency ratio of 1.36x a high value that proves the financial soundness of Sonangol.
- Treasury
In 2014 Sonangol E.P., permanent capital only covered 87% of the value of fixed assets, with the remaining 13% being financed by short-term debt. It is aware that this situation only occurred in the FY2014, and despite this, the company achieved a positive net treasury value of EUR 3.4bn. It is noteworthy that despite this problem of financial structure, Sonangol has access to short-term credit and generate sufficient cash to support the interests.
19
4. INDUSTRY AND MACROECONOMIC OVERVIEW
On this chapter it will be analysed the macroeconomic scenario in countries9 where Sonangol EP concentrates its activities mainly through exports, using as main sources statistical data of the International Monetary Fund (IMF), World Bank and Business Monitor International (BMI).
4.1 Macroeconomic Outlook
Angola
Angola’s economy is strongly dependent on hydrocarbons, with oil comprising 38% of GDP, more than 70% of fiscal revenues and more than 90% of merchandise export earnings. This has served the nation well during periods of rising commodity prices but could again become a handicap, especially after oil output begins to decline from 2014 onwards.
Economic diversification is proceeding but at a slow pace. Angola thus experienced a sharp slowdown in 2009, followed by a strong rebound in 2010 and 2011. The currency is heavily managed against the US dollar, which creates a structural rigidity that reduces the ability of the economy to respond to macroeconomic shocks and makes it difficult for local producers to compete with cheap imports.
Despite falling oil prices, headline economic growth in Angola will continue to be supported by the non-oil economy and it is predictable that real GDP growth will expand by 4.50% in 2015 and 3.90% in 2016, driven by capital-intensive industries such as energy, construction and transport.
Table V - Angola's GDP ∆%
Description Units 2013 2014 2015F 2016F 2017F 2018F 2019F 2020F
GDP, constant prices ∆ % 6,80 4,22 4,50 3,94 5,13 5,28 5,61 5,84
Source: International Monetary Fund, World Economic Outlook Database, April 2015
China
As the largest economic partner of Angola and the largest customer of Sonangol representing approx. 47% of the Group exports, has recently present alarming indications. Analysts predict
9 Countries that represent more than 5% of Sonangol total sales. The macroeconomic data from other countries will be
20
that economic growth in China will continue to fall in 2015, with GDP growth estimated to be between 6.0%-7.0%. Rather than experiencing an abrupt crash, the economy is slowly downshifting from high to medium growth. By category, manufacturing activities seemed to lose steam whereas the service sector held up well.
A confluence of growth headwinds led to the slowdown: first, persistent external uncertainty, arising from the imbalanced recovery in advanced countries, continued to weighed on China’s exports; second, the enforcement of the new budget law has led to fiscal consolidation at the local government level and thereby depressed aggregate demand; third, the recently implemented easing measures, including two interest rate cuts and two RRR cuts. Deflation risk is on the rise. Moreover, a number of factors could exacerbate the price stability, including the potential burst of property bubble, the over-capacity in certain industries, the high debt level of the corporate sector and the ageing of population. Given the size of the Chinese economy in absolute terms, this slowdown is natural, and unlike after previous slowdowns, a significant rebound in growth should not be expected.
Table VI - China's GDP ∆%
Description Units 2013 2014 2015F 2016F 2017F 2018F 2019F 2020F
GDP, constant prices ∆ % 7,75 7,36 6,76 6,30 6,00 6,10 6,33 6,33
Source: International Monetary Fund, World Economic Outlook Database, April 2015
India
India the second largest Sonangol’s client, comprises 13% of its exports. The outlook for India is for economic strengthening through higher infrastructure spending, increased fiscal devolution to states, and continued reform to financial and monetary policy. The government underscored its intention to move steadily to tackle politically difficult structural issues that have stalled investment and limited economic performance in recent years. Growth in the gross domestic product is expected to accelerate to 7.4% in FY2015 on improved performance in both industry and services as policy addresses structural bottlenecks and external demand improves. In 2014 India recorded a GDP growth of 7.1%, with industry growing 5.8%. In macroeconomic terms India has excellent indicators, with this beneficial way for business Sonangol.
21 Table VII - India's GDP ∆%
Description Units 2013 2014 2015F 2016F 2017F 2018F 2019F 2020F
GDP, constant prices ∆ % 6,90 7,17 7,46 7,47 7,55 7,65 7,70 7,75
Source: International Monetary Fund, World Economic Outlook Database, April 2015
Canada
Canada is the third largest customer of the Group comprising c. 6.0% of its exports of crude. Despite the financial and economic strength of the country the macroeconomic forecast for this country is not the most favourable. The negative effects of the oil shock on Canada’s economy are expected to have a more immediate effect than previously estimated. The impact on household spending, terms of trade and investment, particularly in the oil and gas sector are already becoming apparent. As for the external sector the bank of Canada has estimated that Canada’s term of trade will fall 9.0% by the end of 2015 as a result of suppressed oil export values. Meanwhile, figures for GDP 2015 showed that it is expected an increase of 2.16%.
Table VIII - Canada GDP ∆%
Source: International Monetary Fund, World Economic Outlook Database, April 2015
Spain
Comprising c. 6.0% of Sonangol’s exports, a robust growth is projected in Spain over the next two years, driven by very supportive financial conditions, as well as the depreciation of the euro, lower oil prices and strengthening trading partner growth. Renewed consumer confidence and increasing fixed investment drove the economy to record its largest expansion since 2007, consolidating the country’s place as one of the fastest growing economies in the Eurozone. Meanwhile, figures for GDP 2015 showed that it is expected an increase of 2.5%.
South Africa and Taiwan
Both countries share approximately 5% of Sonangol’s exports. Regarding South Africa GDP growth is expected to pick up marginally in 2015. The continued recovery in the mining and manufacturing sectors after the strike-affected first half of 2014 should support growth to some extent. However, infrastructure bottlenecks (mainly electricity), subdued private sector fixed investment and muted growth in consumer and government consumption spending
Subject Descriptor Units 2013 2014 2015F 2016F 2017F 2018F 2019F 2020F
22
means that a meaningful acceleration is not on the cards. Therefore it is expected a growth of 2.00% in GDP in FY2015.
In the other hand, Taiwan’s economy slowed slightly in the first quarter of 2015, growing 3.4% over the same period of the previous year. However the slowdown came largely on the back of falling government spending’s. Moreover, recent data paint a hazy picture of the economy with exports recorded the largest drop in over a year and the manufacturing fell into contractionary territory for the first time since 2013. The GDP expected for 2015 is presents an increase of 3.81%.
Table IX - South Africa GDP ∆%
Source: International Monetary Fund, World Economic Outlook Database, April 2015
Table X - Taiwan GDP ∆%
Source: International Monetary Fund, World Economic Outlook Database, April 2015
Other Countries
Sonangol holds commercial and economic links with many other countries in Europe and Americas whose exports to these countries does not weigh more than 3%. (Appendix 2). Economic growth in the EU remains sluggish, however the fall in crude oil prices are should provide a welcome boost to growth. Regarding Americas, with especial attention to the Latin America the grow will be low in 2015 and 2016, mainly influenced by the financial volatility in China, the impact of lower commodity prices and internal economic and political problems in prioritizing and speeding up fixed capital investments and productivity.
4.2 Industry Overview
Energy Market Overview
After colossal growth in 2011, the global market fell in to marginal decline in 2012 followed by weak growth in 2013. Due to a huge fall in oil prices beginning in late 2014, 2015 has seen a dramatic decline within the market followed by very weak growth for the remainder of the forecast period (Appendix.9)
Subject Descriptor Units 2013 2014 2015F 2016F 2017F 2018F 2019F 2020F
GDP, constant prices ∆% 2,21 1,53 2,00 2,10 2,40 2,70 2,80 2,80
Subject Descriptor Units 2013 2014 2015F 2016F 2017F 2018F 2019F 2020F
23
On November 27th 2014, OPEC (Organization of the Petroleum Exporting Countries) failed to reach an agreement over the curbing of production of oil which in turn sent prices tumbling. This has had such an effect due to the fact that OPEC controls approximately 40% of the global market. The market is dictated partly by supply and demand and energy is very closely related to economic activity. There are a number of factors that have played a part in the oil price slump. The poor global economic performance as well increased efficiency and alternative energy sources has led to reduced demand plus with OPEC deciding not to curb production, there is almost a surplus of oil. To add to this, the US has become the world's largest producer of oil and has no need for the level of imports as it previously had in the past. Finally, Gulf oil producers have decided not to reduce production to restore price to what is classed as normal today.
The global oil and gas market generated in 2014 a total revenue of USD 3,073.4bn, representing a CAGR of 6.7% between 2010 and 2014. In comparison, the European and Asia-Pacific markets grown with CAGRs of 3.8% and 8% respectively, over the same period, to reach respective values of USD 689.5bn and
USD 1,065.8bn in 2014. Market consumption volume is forecast to increase with a CAGR of 1.2% between 2010-2014, to reach a total of 46,792.5 million barrels equivalent (BOE) in
2014. The market's volume is expected to rise to 49,097.2 million barrels equivalent (BOE) by the end of 2019, representing a CAGR of 1% for the 2014-2019 period.
Crude oil sales had the highest volume in the global oil and gas market in 2014, with total sales of 29,632.9 million barrels, equivalent to 63.3% of the market's overall volume. In comparison,sales of natural gas reached a volume of 17,159.7 million barrels equivalent (BOE) in 2014, equating to 36.7% of the market total.
Year Production (mn BOE) ∆% $ Billion ∆%
2010 44 581 n.a. 2.376 USD n.a.
2011 45 197 1,4% 3.089 USD 30,0%
2012 45 630 1,0% 3.061 USD -0,9%
2013 46 296 1,5% 3.123 USD 2,0%
2014 46 793 1,1% 3.073 USD -1,6%
Source: MarketLine - Industry Profile Global Oil&Gas (Dec. 2014)
24
The performance of the market is forecast to decline, CAGR of -6.5% for the five-year period 2014 - 2019, which is expected to drive the market to a value of USD 2,196.7bn by the end of 2019. Comparatively, the European and Asia-Pacific markets will decline with CARCs of 7% and -7.2% respectively, over the same period, to reach respective values of USD479bn and USD734.7bn.
Angola
The outlook for Angola's oil sector remains broadly positive, with highly prospective offshore acreage and a number of major projects under development. However, sustained lower oil prices pose downside risk to production growth post-2020, as rapid natural decline rates and a slowdown in investment combine to undercut output levels. Gas production will remain limited throughout 10-year forecast period due to low domestic consumption, unfavorable pricing dynamics and demand constraints in key export markets.
Central and Eastern Europe
Russia will remain the dominant force in all areas of oil and gas in the Central and Eastern European region over the next 10 years despite sanctions and weak oil prices. The bulk of both oil and gas production growth will come from Caspian countries and head to China. It is expected that the refining sector would struggle, with only Turkey and Turkmenistan expected to build new facilities, though significant investments will go into modernization across the region.
-50,0% 0,0% 50,0% 0 5000 2014 2015F 2016F 2017F 2018F 2019F
Chart 2 - Global Oil and Gas Market Value Forecast
$ Billion % of Growth Americas 36% Asia-Pacific 35% Europe 22% Middle East 6% Rest of the World 1%
Chart 1 - Global Oil &Gas Market Geography Segmentation: % Share 2014
25
5. STRATEGIC ANALYSIS 5.1 SWOT
5.2. PORTER’S FIVE FORCES
The analysis of Porter’s five forces is discussed in detail in Appendix 8.
Strengths Weakness
Control of all key hydrocarbons interests; Unrivalled access to exploration acreage; Substantial production upside potential; International oil companies provide much project
funding;
National market leader in the upstream and downstream segments;
Sonangol has a number of subsidiaries and retail brands which provide the company with diversified revenue portfolio rather than simply relying on its energy business;
Positive and consolidate working capital, where current assets cover short-term obligations; Integrated business operations enable the
company to respond more effectively to changes in the business environment;
Strong capacity to invest in training, equipment and new technologies;
Strong operational and profit margins;
Limited financial or operational freedom; Cost and efficiency disadvantages; Lack of geographic diversification; High costs in the refining of crude oil, and
importing the same refined oil due to low refining capacity in Angola;
No developed alternative energy products to the extent that it could and continue to rely on oil as its main business segment, which is not a sustainable strategy;
Little diversified funding sources;
The permanent capital only cover 87% of the value of fixed assets, putting pressure on the treasury, requiring short-term debt to compensate it.
Opportunities Threats
Substantial output growth as a result of international firms’ investment;
Considerable untapped gas export potential; Large areas of unexplored territory;
Easy access to credit, as holds majority stakes in 8 Banks;
Expansion through several acquisitions will improve its asset position and strengthen its top-line growth;
Potential of becoming a market leader in many alternative fuel and energy markets if it can invest in research and reposition is strategy. These markets opportunities include wind, solar and hydrogen;
Significant opportunity to meet increasing demands for energy in many development
Delays to LNG exports; Substantial additional costs; Local political unrest;
Changes in national and international energy policy;
Strong dependence on China, since China purchase 43% of Sonangol’s oil;
Currency fluctuations with AOA/USD, USD/EUR and USD/YUAN;
Economic pressure, especially in terms of volatile oil prices around the world, furthering the need to focus on the migration to alternative fuel for its energy solutions;
Exploratory drilling risks and environmental issues may be a threat if the company does not formalize its corporate social responsibility and put it at the forefront of its strategy, including revising workplace safety issues in order to reduce refinery explosions, oil leaks and spills, pipeline corrosions and other environmental
S
W
26
6. EVALUATION 6.1 Methodology
To assess the value of Sonangol EP two different valuation methods were used: Free Cash
Flow to the Firm (FCFF) and Multiples valuation. The first, as explained in the Literature
Review, is a Discounted Cash-Flow (DCF) based method, while the latter involves relative valuation.
This methodology besides being the most widely used by investors and managers in the evaluation of companies is also the most appropriate to evaluate the Sonangol EP, given the firm’s current capital structure of approximately 40% debt. At the beginning the idea was to evaluate Sonangol in separate by the SOTP (Sum of the Parts) methodology, considering the company’s different business units. However, due to lack of available information about the different companies that comprise the Sonangol’s business lines, the option was considered to evaluate the company as a whole.
Relative to the time horizon of the projections was set an explicit period of five years. For the projection of the value in perpetuity was assumed a growth rate (g) of 0.7%. All cash-flows will be determined in Euros.
6.2 Assumptions
To determine the value of Sonangol E.P. was defined a set of assumptions about the projection of FCFF and the discount rate, which will be presented below.
6.2.1 Operational Assumptions
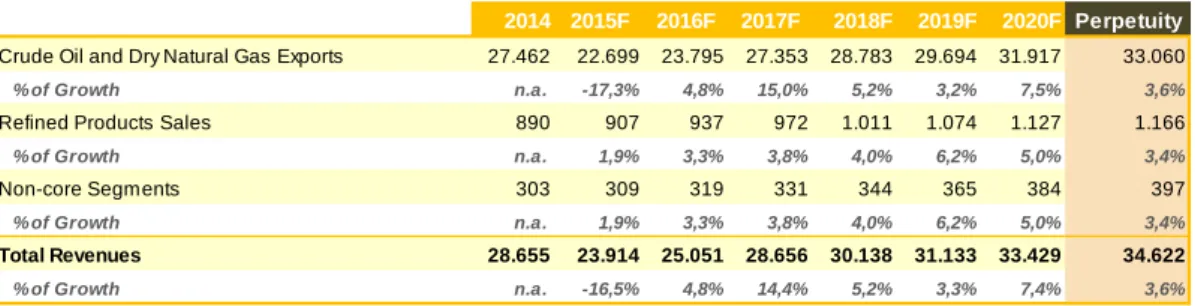
Revenues
The initial approaches in the estimation of Sonangol’s revenues was based on two reports from BMI “Angola Oil and Gas report Q2 2015”, EIA “Annual Energy Outlook 2015 with
projections to 2040” as well as the macroeconomic data designed to Angola by the
International Monetary Fund. The BMI report discloses a wide range of data concerning the current Energy Sector in Angola, highlighting in particular the evolution of production, competitiveness and exports of oil and natural gas derivatives. On the other hand the report