1
M
ASTER OF
S
CIENCE IN
FINANCE
M
ASTERS
F
INAL
W
ORK
PROJECT
EQUITY RESEARCH
:
P
EUGEOT
SA
V
ITOR
M
IGUEL DOS
S
ANTOS
G
ERALDES
M
ASTER OF
S
CIENCE IN
FINANCE
M
ASTERS
F
INAL
W
ORK
PROJECT
EQUITY RESEARCH
:
P
EUGEOT
SA
V
ITOR
M
IGUEL DOS
S
ANTOS
G
ERALDES
S
UPERVISOR
:
VICTOR MAURÍLIO SILVA BARROS
i
Abstract
This project represents
an extensive evaluation of Peugeot SA, according to ISEG’s
Master in Finance final work project. This equity report was written in accordance with
recommendations of the CFA Institute. The reason for choosing the company was the
interest in automotive industry and the curiosity to evaluate how the company react to
daily threats. This report was written in accordance with the public information available
on July 20
th, 2017, any information or event subsequent to this date has not been
considered. The target price was obtained using an average of valuation methods,
more specifically the method of Discounted Cash Flow and Relative valuation method,
more known as method of Comparable Multiples. The target price was € 20.67 at 20
thJuly of 2017, representing an upside potential of 3.75%. My recommendation is to
Reduce, given the high risk of the company capacity to enter e-cars market and the
high dependence of European market. Our risk assessment estimates a high risk for
the company.
JEL classification: G10; G32; G34;
Keywords: Equity Research; Valuation; Mergers & Acquisitions; Peugeot SA;
Automotive Industry
ii
Resumo
Este projeto representa uma análise extensiva da Peugeot SA, consistindo no projeto
de trabalho final do programa de Master in Finance do ISEG. Este relatório foi
elaborado de acordo com as recomendações do CFA Institute. O motivo pela escolha
da empresa deveu-se ao interesse na industria automóvel e a curiosidade pessoal de
entender como a empresa reage as ameaças diárias. Este relatório foi elaborado de
acordo com a informação publica a 20 de Julho de 2017, qualquer informação ou
evento posterior a esta data não foi considerado. O preço-alvo foi obtido utilizando
uma ponderação aritmética de dois métodos de avaliação, mais especificamente o
método de Fluxos de Caixa Descontados e o método de avaliação relativo, mais
conhecido como método dos múltiplos comparáveis. Com um preço-alvo de € 20.67 a
20 Julho de 2017, representa um potencial de valorização de 3.75%. A recomendação
deste trabalho académico é de reduzir, dado o alto risco da empresa na sua
capacidade de entrar no mercado de carros elétricos e a sua elevada dependência do
Mercado europeu. A nossa avaliação de risco estima um risco alto para a empresa.
Classificação JEL: G10; G32; G34;
Palavras-Chave: Equity Research; Avaliação de Empresas; Fusões e Aquisições ;
Peugeot SA; Indústria Automóvel
iii
Acknowledgements
This project represents the end of my academic life, filled with hard work and dedication
especially these last two years.
I would like to thank all my professor, especially to Professor Clara Raposo by allowing
me to join the master, to Professor Victor Barros that was a great support during the
master thesis.
Also, I would like to thank my girlfriend Beatriz Carneiro and my parents, for always
believing in me, especially when no one else did.
To my colleagues and friends, for the support and friendship.
iv
Index
Abstract
i
Resumo
ii
Acknowledgements
iii
Index
iv
List of Figures
v
List of Tables
vii
1.
Research Snapshot
1
2.
Business Description
2
3.
Management and Corporate Governance
6
4.
PSA Group acquires GM European operations
7
5.
Industry Overview and Competitive Positioning
8
6.
From Fossil to Electric
14
7.
Valuation
15
8.
Financial Analysis
18
9.
Investment Risks
19
Appendices
21
Appendices 1: Balance Sheet Statement
21
Appendix 2: Income Statement
23
Appendix 3: Cash Flow Statement
24
Appendix 4: Key Financial Ratios
25
Appendix 5: Forecasting Assumptions
26
Appendix 6: Business and Corporate Structure
30
Appendix 7: PSA Group and Opel/Vauxhall Synergies
32
Appendix 8: Porter’s Five Forces
33
Appendix 9: Peers Selection
35
Appendix 10: Risk Matrix
38
v
List of Figures
Figure 1 - Share Price
1
Figure 2- New Registration in EU Dec.2016
2
Figure 3 – End-user costumer financing sales
2
Figure 4- Number of vehicles sold
2
Figure 5 - PSA and Competitors Capacity Utilization
3
Figure 6 – Total Number of Employees
4
Figure 7 - PSA’s”Back in the Race”
4
Figure 8 - ‘Push to Pass’ Strategic pillars
4
Figure 9 - Financial objectives of ‘Push to Pass’
4
Figure 10 - Shareholders structure at 31 Dec. 2016
5
Figure 11 – Voting Rights at 31 Dec. 2016
5
Figure 12 - Performance Pre/Prior Carlos Tavares signature
6
Figure 13 - PSA’s social and environmental policies
6
Figure 14- Share of each group’s 2016 sales in key European markets
7
Figure 15 - Share of 2016 Sales in Europe by vehicle size segment
7
Figure 16 - Penetration Rate in Europe
7
Figure 17 - Light Passenger Car Registration Market Share by Region 2016
8
Figure 18 - EU Passenger Car Trade in Value
8
Figure 19 - Asian Countries Global Vehicles Registration weight
8
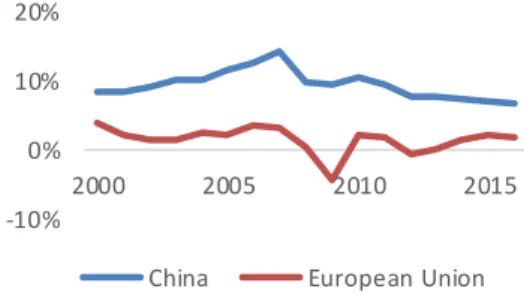
Figure 20 - EU and China GDP Growth
9
Figure 21 - Interest rates on New and Used cars
9
Figure 22 - EUR/CNY Exchange Rate
9
Figure 23 - EU and China GDP per capita (U.S Dollars)
10
Figure 24 - Penetration Rate of China Auto Retail Finance Products
10
Figure 25 - Total Expressway and Highway length in China
10
Figure 26 – Cost Drivers in Auto Industry
11
Figure 27 - Fuel price and Passenger Car Registration MoM
12
Figure 28 – Light Vehicle Production forecast
12
Figure 29 - Top-selling EU passenger cars manufacturers groups for 2016
12
Figure 30 - Porter’s Five Forces
13
Figure 31 – Competitors Key Figures
14
vi
Figure 33 - Range of BEV
14
Figure 34 - Evolution of the global electric car stock
15
Figure 35 - Revenue Forecast
16
Figure 36 – Net Debt
16
Figure 37 - Segments growth projections
18
Figure 38- Cash flow Operations
18
Figure 39 - Risk Matrix
19
vii
List of Tables
Table 1 - Analyst’s Risk Assessment
1
Table 2 – PSA Market Data 20/07/2017
1
Table 3 - Valuation Output
1
Table 4 - Sales by Regions at 2016
2
Table 5 – Principal Markets of PSA Population projections
3
Table 6 – OEM’s electric vehicles strategy
15
Table 7 – WACC Assumptions
16
Table 8 – Peer Analysis
17
1
Peugeot SA:
(2017YE Price Target of € 20.67 (+3.75%), with high risk; recommendation
is to reduce)
REDUC E is our recommendation at the 20th July of 2017 for Peugeot SA (PSA) w ith a price target of € 20.67 for 2017YE, using the discounted cash flow method. Relativ e valuation through multiples supports our view that PSA is currently fairly valued. This offers a potential 3.75% upside gain from its latest closing price of € 19.05, although w ith high risk. The evolution of automotive industry, technologic changes and uncertainty of PSA management decisions regarding operations are key factors to understand this research.
Peugeot SA - Strong group revenue’s drivers: Group PSA has a w ell-diversified
revenue’s sources, from automotive division – Peugeot, Citröen, DS, Opel and Vauxhall w hich correspond to more than 65% revenue’s. Automotive equipment w hich comprises Faurecia participation represents more than 32% and Finance division w hich serves as intermediary of sales for all brands. Revenue’s grow th in 2016, -1.18% how ever, car sales increase by 4.82% YoY. With the incorporation of Opel and Vauxhall sales this numbers should increase significantly.
Chinese and European market dependence: In 2016, 62% of group sales w as in Europe and 20% in China and South-East Asia. This high dependence of these particular markets creates a high level risk for the group. With European economy stagnation and China’s customer non-loyalty for brands, it is urgent that the management create alternative solutions to maintain revenues. PSA not operating in US also contributes for these uncertainty and makes even harder to become an automotive leader.
Opel and Vauxhall acquisition: The merge of the year, Peugeot SA acquired for €2.2Bn, Opel and Vauxhall. General Motor’s decided to sell their operations in Europe in this segment and consolidate their operations in other regions. PSA took the change to increase their portfolio in Europe. It is expected that the acquisition creates € 1.7Bn synergies annually by 2026. How ever, it might occur the cannibalization effect because most of vehicles segments are similar’s.
Electric Vehicles paradigm: Peugeot SA is European leader for low carbon emissions CO2/KM, w hich is a strength regarding the demanding regulatory required by European Authorities. How ever, Peugeot SA continuous to not have their e-car despite the increase of global market for these vehicle. All competitors already offers a w ide range of electric cars for all type of budgets. It is essential to present a model that can compete w ith other brands. It w as announced by Carlos Tavares, one model in 2019, w ith a 450 Km battery range w hich is higher than market average (250 km).
1.
Research Snapshot
Peugeot SA
Reduce
Recommendation
Table 1 - Analyst’s Risk Assessment
Low
Medium
High
PSA risk assessment reflects a high risk investment.
It is measured by high level of competition
domestically and internationally. Also, the growth of
electric cars market and Opel acquisition can be
crucial to PSA futures.
€19,05 €20,67 7,0 € 10,0 € 13,0 € 16,0 € 19,0 € 22,0 € 21-07-2014 21-01-2015 21-07-2015 21-01-2016 21-07-2016 21-01-2017
Closing Price Current Price Target Price
Figure 1 - Share Price Source: Bloom berg
Closing Price 19.05 € 52-week price range 12.05-19.71
Volume 1319585
1 year Return 54.95%
Shares outstanding 904828
Market Cap. 18.689
Reuters/ Bloomberg PEUP.PA / UG:FP Key Information
Table 2 – PSA Market Data 20/07/2017
Source: Bloom berg
Valuation 2016YH Target Price
DCF 19.76 €
Multiples (average) 21.57 € EV/SALES 22.06 € EV/EBITDA 21.08 € Table 3 - Valuation Output
2
Peugeot SA, is a French automobile manufacturer of passenger and light commercial
vehicles (Figure 2), founded in 1896. PSA is Europe’s second-largest automobile
manufacturer, coming behind VAG, selling 3.1 million vehicles in 2016 across 160 countries. It is one of the largest automobile manufacturer in China, selling 620,000 vehicles in 2016. The company is the European automobile leader for low Carbon Dioxide (CO2) emissions per KM, w ith 102.4g very below the average market 118g. Currently, PSA has 21 production plants, half of them subsidiaries jointly ow ned w ith other car manufacturers, 172,000 employees w orldw ide. How ever, w ith Opel/Vauxhall acquisition, new more 40,000 employees and new 5 production plants.
Peugeot SA is the holding company responsible for the production and sales of Peugeot, Citroën and DS brands vehicles. Through Faurecia capital participation , global leader in automotive equipment, the company also supply other brands and manufacturers w ith automotive seating, interior systems and emissions control technologies.
To diversify their manufacturing business, Peugeot S.A. also provides retail financing to costumers of the three brands and w holesale financing to Peugeot and Citroën, through Banque PSA Finance (BPF), covering 89% of sales in more than 23 countries - Figure 3.
The Peugeot SA operates in three main business lines: (i) Automobile Division; (ii) Automobile Equipment Division and (iii) Finance Division. (Appendix 6.1)
The Autom obile Division is the responsible for covering the design, manufacture and sale of passenger cars and light commercial vehicles under Peugeot, Citroën and DS brands. PSA sold 3,146,000 vehicles w orldw ide in 2016, more 5.8% compared to
previous year, w ith Peugeot being the brand that contributed the most – Figure 4. It is
presented in 5 different regions w ith the European region being the market w ith highest
units sold, 62% of sales w ith 36% in France. EU accounts for 71% of the Group’s
production plants, 46% in France. Middle East & Africa Region the market w ith the highest significant grow th – Table 4. This division represents 64.8% and 65.2% of revenues and expenses of the group in 2016.
Another business segment of PSA group is the Autom obile Equipm ent Division, representing 32.7% and 33.2% of revenues and expenses of the group, respectively. Through Faurecia group w hich PSA holds 46.6% of capital and 63.2% voting rights, consists in the largest global automaker equipment comprising, Interior Systems, Automobile Seating and Emissions Control Technologies. In the end of 2015, Faurecia follow ing a disinvest strategy, sold the Automotive Exteriors division by €665 million in order to eliminate debt and focus in the remaining divisions.
Complementing the manufacturing business, the PSA Group also provides financing, insurance, leasing and banking activities from their Finance Division, w ho represents 2.46% of revenues, through the Banque PSA Finance (BPF). BPF operates in more than 23 countries w ith several partnership agreements and annually covers more than 700 thousand units. Financial services to end customers represents 70.9% of BFP’s total loans outstanding and corporate dealers financing represents 29.1%. In 2016, BFP sold 1,500,000 insurance policies and services w ith an average of 2 contracts per customer financed, making the sixth year running sales grow th.
2.
Business Description
Source: ACEA Market Report Q4-2016
Figure 2- New Registration in EU Dec.2016
Source: Banque PSA data
Figure 3 – End-user costum er financing sales
2600000 2700000 2800000 2900000 3000000 3100000 3200000 2011 2012 2013 2014 2015 2016
Source: Com pany data
Figure 4- Num ber of vehicles sold
Source: Com pany data
Regions Sales
Europe 1930 China and South-East Asia 620 Middle-East and Africa 383 Latin America 184 India-Pacific 20
Eurasia 10
Table 4 - Sales by Regions at 2016 Units thousands
3
Key Drivers of Profitability
Excess production, price of raw materials, road infrastructure, macroeconomic conditions and population grow th are the most important variables to automotiv e brands profits. PSA Group, in the last years, w ere know n for low levels of capacity utilization conditioning future profits (Figure 5). In 2016, 30% of purchasing budget of PSA w as allocated to raw materials. Those input prices have increase in 2016 but below the hype of 2014. How ever, PSA exposure to fluctuations in commodity prices is hedge using derivative instruments and optimizing global sourcing w ith substitute materials,etc.
The grow th of population in principal markets of PSA Group influence future profitability and projections of demand and supply – Table 5.
Joint Venture
PSA has 50%-ow ned joint ventures in China-Dongfeng Peugeot Citroën Automobile (DCPA) and Changan PSA Automobile (CAPSA). It co-operates on engines w ith Renault, Ford and BMW.
Since 2014, PSA Group strengthen the partnership w ith Dongfeng Motor covering: 1) joint commitment to propel DPCA grow th and aims to triple its volumes to 1.5 million vehicles per year by the early 2020s, 2) create joint R&D center, dedicated to the development of products and technologies for fast grow ing countries, including China. 3) Create new joint venture to drive the sales of PSA and Dongfeng vehicles in the rest of Asia and possibly in other emerging markets. From this joint venture is possible to create synergies of 400M€ per year for PSA by 2020 and it w ill be possible to extent for other areas of collaboration.
From 2017 the PSA group and the CK Birla Group sign joint-venture agreements to produce and sell vehicles and components in India by 2020. This long-term partnership w ill allow both companies to participate in the grow th of the Indian automotive market, expecting to reach 8 to 10 million vehicles by 2025 from the current 3 million cars produced in India in 2016.
Table 5 – Principal Markets of PSA Population proj ections. (Unit: Millions)
Year 2015 2030 2050 2100
World 7349 8501 9725 11213
Asia 4393 4923 5267 4889
Europe 738 734 707 646
Latin America and
the Caribbean 634 721 784 721 Northern America 358 396 433 500 Source: United Nations, 2015
Source: IHS Estim ates
4
Group PSA strategy
Back in the Race
In 2014, Carlos Tavares presented the “Back in the Race” plan (2014-2018), designed to ensure the Group’s reconstruction w ith four operational objectives: 1) Strengthen the DNA of the three brands and increase their value; 2) Execute a core model strategy w orldw ide based on a highly technology w hich allow s the group to do more w ith each euro invested, needing less employees (Figure 6); 3) Ensure profitable grow th w orldw ide, even the Latin America that turned to be profitable; 4) Improve the Group’s competitiveness, the threshold for profitability w as reduced by 1 million vehicles . PSA completed its reconstruction plan and it exceeds all objectives, at the end of 2015. With a €6 billion of operating free cash flow , a net cash of nearly €5 billion and the automotive operating margin of 5%, PSA completed this strategy very quickly through cost savings allow ing fulfilling most of the objectives – Figure 7.
Refinancing Strategy
The financing strategy of Banque PSA Finance resulted in the implementation of the partnership betw een BPF and Santander Consumer Finance in 11 countries. This partnership conducted several active debt management transactions in 2015: 1)
signing of a new syndicated loan for €700 million maturing in five years; 2) repayment
and cancellation of the previous syndicated loans for a total amount of €7,245 millio n and 3) redemption of several of its existing bonds for a total amount of €1,893 million. This is partnership stands for the creation of dedicated local partnerships and commercial agreements, reinforcing the competitiveness of the three brands in Europe and Brazil.
Push to Pass
PSA’s strategy ‘Push to Pass’ for the 2016-2021 period aims to meet costumers’ mobility needs by anticipating changes in car usage patterns. Driven by evolving customer expectations, the plan w ill transform the company in order to unleash its full potential, capitalizing also on the efficiency, operational excellence and agility show ed during ‘Back in the Race’ plan. This strategy has three goals: 1) The digital transformation of the Group; 2) The internal performance culture; 3) Corporate social responsibility
To complete ‘Push to Pass’ plan, the PSA group consider that there are five pillars to
be consider in the change of customer expectations from: 1) Product to customer; 2) Ow nership to experience; 3) Car to mobility; 4) One business to a portfolio of activities; 5) Local to global.
The vision underlying this strategy described by the Chairman, Carlos Tavares, ‘Our digital transformation w ill make the PSA Group a company connected to its customers’. In order to execute the ‘Push to Pass’ plan, there are five strategic pillars: Quality first, the PSA Group targets to be in the Top 3 performances in 2018. Core m odel and techno strategy, one new car, per region, per brand and per year from 2018 to maintain a young vehicle range of 3.5 years. This pillar also considers maintaining our low emission leadership w ith performing engines. Brand Pow er, by capitalizing the three pow erful w idely recognized and differentiated Peugeot, Citroën and DS brands to develop the groups business in the operating regions. Core efficiency, as engaged in Back in the Race plan it w ill continue to improve the R&D and Capex efficiency of the Group to reduce overall costs, fixed or variable. 6 strategic regions , a robust techno and product plan of 120 new products w orldw ide – Figure 8.
Source: Com pany data
150.000 175.000 200.000 225.000
Figure 6 – Total Num ber of Em ployees
Source: Company data
Figure 7 - PSA’s”Back in the Race”
Source: Company data
Figure 8 - ‘Push to Pass’ Strategic pillars
Source: Company data
*Group revenue vs 2015 revenue
5
The financial objectives of the ‘Push to Pass’ plan are operating margins and revenues. For the Operating margins, the PSA expects a 4.5% of automotive recurring operating
margin1 from 2016 to 2018 and a 6% of automotive recurring operating margin, in 2021.
Regarding the revenue’s goals, the PSA expects a 10% and 15% revenues grow th
compared to 2015’s2, in 2018 and 2021, respectively – Figure 9.
PSA acquire Opel and Vauxhall
After all restructuring plans, being w ell executed by PSA managing board, Carlos Tavares and the remaining staff found the opportunity to acquire General Motors European operations, Opel and Vauxhall for €2.2B including operating and financing activities. These transaction backed by a long-term strategic partnership w ith BNP Paribas around the joint acquisition of Opel/Vauxhall financing activities, w ill lead to PSA Group be second largest manufacturer in Europe. Despite PSA’s CEO and the prime ministers of France, Germany and Britain affirm that no saving jobs occurs, in order to costs savings. How ever, many automotive industry analysist affirms that the so needed cost savings of Opel can be executed in short term be fire employees.
Ow nership Structure
According to Peugeot SA information regarding the ow nership structure, at 31 Dec. 2016, the company has a total number of shares outstanding of 859,924,895, w ith a total share capital of €15,053 million. Several other foreign institutions slice 39.57% shares of the company. The Peugeot family group, Dongfeng Motor and French state holds 12.68%. Private shareholders, other French institution, employees and treasury
shares – Figure 10, divide the remaining capital. How ever, 58.1% of the shares
outstanding are floating shares, w hich belongs to passive investors and remaining capital belongs to strategic entities. Regarding the voting rights is held majority by other foreign institution and Peugeot family group – Figure 11.
1 Recurring operating income related to revenue
2 At constant (2015) exchange rates
Source: Com pany data
39,57% 12,86% 12,86% 12,86% 10,92% 7,70% 2,15% 1,06% Other Foreign shareholders Peugeot family group Dongfeng Motor French State Other French institutions Other Individual Shareholders Employees Treasury shares
Figure 10 - Shareholders structure at 31 Dec. 2016
Source: Company data
6
PSA Group follow s a tw o-tier management structure comprising a Managing Board, responsible for strategic and operational management, and a Supervisory Board, responsible for oversight and control. This separation is vital to a positive balance betw een the pow er of the executive and oversight functions. It also protects minority shareholders w ith Supervisory Board oversighting all executive decisions to have the best match possible. Also given the w ell disperse voting rights of PSA Group, w ith Peugeot family group w ith the second higher position, benefit the payoff interests of
minority shareholders.
Four members compose the Managing Board: Carlos Tavares serves as Chair man of the Managing Board of PSA Group. Graduated in Engineering on Ecole Centrale de Paris, former group Chief Operating Officer (COO) of Renault-Nissan in 2011. After denied Renault CEO position, the opportunity to lead PSA Group happen. Named Chairman of the Managing Board in March of 2014 and has change PSA Group paradigm (Figure 12). Jean-Baptiste De Chatillon, role as Executive Vice President and CFO, has been a member of managing board since 2012. Jean-Christophe Quém ard, serves as Executive Vice President, Africa-Middle East, he joined PSA in 1986 and has held various positions, in particular , Director of Automobile Platforms and Technologies Department. Maxim e Picat, is the Executiv e Vice President, Operational Director Europe, since September 2016 has a seat in the Managing Board. An Executive Committee, organized in a matrix structure by brands, regions and business lines, backs the managing board. (Appendix 6.2)
From the Annual General Shareholders’ meeting, it has appointed the members of the Supervisory Board. Louis Gallois is the Chairman, held several positions in French Government and served as CEO of Airbus betw een 2006 and 2007. There are other 13 members in the Supervisory board, w ith six members appointed by the three main shareholders, Peugeot family group, the French State and the DongFeng Motor Group Company. Six independent members, an employee representative, Jean-François Kondratiuk , and an employee shareholder representative.
Opel/Vauxhall integration creates a challenge that once again, PSA Managing Board
must be succeed. After “Back in the Race” completed quickly and “Push to Pass”
operational targets expand. The opportunity to become European manufacturer leader appear w ith Opel but comes w ith high costs. Transform a chronic money loser, as Opel/Vauxhall to become operational efficient manufacturer w ill put Carlos Tavares and remaining staff in the biggest challenge of this century.
Sustainability and Corporate Social Responsibility
The PSA Group’s social and environmental policy is based on continuous dialogue w ith its stakeholders and the conviction that automobile sustainability can contribute to the creation of value of everyone. (Appendix 6.3)
The CRS of PSA is based on three main pillars, commitment to sustainable mobility , to reduce the environment impacts of vehicle production and use; societal commitment to the regions, in w hich it operates, to create an ecosystem that promote the grow th of employment and the integration of local economic players. The last pillar is a social commitment, w ith the implementation of innovative and needs -adapted practices enabling employees to enhance and make f ull use of all their talents – Figure 13.
3.
Management and Corporate Governance
Figure 12 – Financial evolution since Carlos Tavares signed
Source: Company data
7
4.
PSA Group acquires GM European operations
Background
PSA Group acquired the chronic money loser, Opel and Vauxhall by €2.2bn to General Motors’ being the second-largest carmaker in Europe. The new Group European market share increase close to 17% behind Volksw agen Group (22%).
Both companies principal market is Europe w ith Opel relying more on UK, through
Vauxhall, and Germany, w hile Peugeot SA has a strong presence in France – Figur e
14.
This transaction includes all the car-manufacturing activities of Opel/Vauxhall, w hich comprise the Opel and Vauxhall brands, six assembly plants and five-part production plants, an engineering center and about 40,000 employees. It includes also, Opel/Vauxhall’s finance businesses that satisfy nearly 1,800 concessionaries.
Strengths each Company for the Long-Term
Despite Opel/Vauxhall not having profits since 1999 motivate General Motors searching for buyers. How ever, an integration betw een both manufacturers w ill allow substantial economies of scale and synergies in purchasing, manufacturing and R&D.
It is expected by Carlos Tavares €1.7Bn of synergies annually by 2026, but most of
them in 2020 – Appendix 7. Also regarding, recurring operating margin by 2% in 2020
and 6% in 2026 and a positive operational free cash flow by 2020.
After Brexit, PSA transform one problem into an opportunity. With Vauxhall plants located in UK, PSA could face euro-pound fluctuations issues and UK-EU trade, after all UK is the second largest market in Europe.
Cannibalization effect
This transaction is not just happy new s, PSA might face the w orst of the problems , cannibalization effect. Opel/Vauxhall and Peugeot/Citroen operate in similar ranges of products – Figure 15. Both companies are positioned in mainstream market w ith strong
presence in small and compact segments. Both lack the presence of SUV’s and none
of them succeeds in the midsize sedan segment. In addition, Opel/Vauxhall w ould not give PSA Group access to premium market.
New dimension for PSA’s financial operations
PSA and BNP Paribas have agreed to jointly acquire Opel/Vauxhall’s captive financing activities and have entered a long-term strategic partnership around the Opel and Vauxhall brands. Both each acquire 50/50 of the share capital and Opel/Vauxhall
covers 11 European countries, providing services to 1,800 dealers.
These transaction allow s significant room for value creation through the partnership and alignment of Opel Financing activities given the low penetration rate of main
European competitors – Figure 16.
Financial Position after the transaction
In 2016, the company had net cash position of €6,813 million up €2,253 million compared to 2015. The Group continued actively managing its debt w hich allow s the possibility to make this transaction and remain the solid financial position. The first phase €1,13 billion w ill be financed by PSA’s available cash, and the remaining €650 million paid w ith Company equity w arrants to General Motors group over the next 5 years. Despite the considerable price of the ac quisition, Mr. Tavares leave ample headroom for further profitable grow th opportunities internationally.
28% 25% 25% 13% 8% 10% 9% 9% 23% 7% 7% 36% 0% 20% 40% 60% 80% 100% Opel PSA France Germany Italy Spain UK Other
Figure 14- Share of each group’s 2016 sales in key European m arkets
Figure 15 - Share of 2016 Sales in Europe by vehicle size segm ent
0,0% 10,0% 20,0% 30,0% 40,0% 50,0% 60,0%
Source: Student’s Analysis
8
INDUSTRY OVERVIEW
In 2016, the global grow th fallen to 2.3 percent, the w eakest year performance since the global financial crisis. The global economy managed to navigate its w ay through troubled w ater, geopolitical risks remained high in 2016, as result of the Brexit vote. The still-inflamed Middle East and the political election of Donald Trump as a President of U.S. VW’s and other brands emission scandals contributed to significant changes in automotive industry, w ith more restricted legislations to reduce the CO2 emissions over time, changing company’s strategies increasing their costs in R&D for clean vehicles.
The impact of the 2008 crisis on the automotive industry has been more severe than for other industry except housing, finance and prompted large-scale government intervention around the w orld. The automotive industry is one of main drivers of global macroeconomic grow th, stability and technological advancement. In 2016, 77 million passenger cars w ere sold w orldw ide, 5.5% more than in the same period of last year, for the new commercial vehicles increased 11.7% in EU (2,326,552 units). Total w orld new passenger car registration, the leader of registration is Asia, particularly China w ith 29.8%. European and North America follow the leader w ith 22.5% and 22.4%, respectively. (Figure 17). In terms of major companies, PSA Group are far from the
brands, w hich sells the most w ith 4.8%1, such as Toyota (10.9%), VW Group (11.1%),
etc.
The European Union: Automotive Industry
Within the European perimeter, the passenger car and commercial v ehicles production increased by 2.7% and 11.7%, respectively, being the w orld’s second largest producer after China. Regarding the PC registrations in EU increased by 6.8%. The main player of passenger car in EU is Germany producing, 5.5 million units and France being the player w ith significant grow th, 4.4% contributed mainly by Peugeot SA and Renault SA.
Regarding the average CO2 emissions in EU per unit, 119.6 CO2/Km, the European Automobile Manufacturers Association (ACEA) affirms that is needed proper implementation for emissions-testing legislation. Grow th of production in EU, driven by an increase in domestic demand and expects to improve economic conditions and consumer confidence in Eurozone. Employing over 12.2 million people (5.6% of EU employed population), the automobile industry generates a trade surplus over €100 billion (Figure 18) and this sector is a key driver of know ledge and innovation, being the EU’s largest private contributor to R&D, w ith an annual investment of around €44.7 billion.
Asian Countries: Automotive Industry
Last year, Asian countries accounted 35 million registrations of passenger vehicles w ith an increase of 11%, being the region, w hich counts 46% of global vehicle registration. China contributed 30% of w orld new passenger car registration, through
imported and local produced cars, very above other Asian countries – Figure 19.
Passenger cars represents 80% of the total automotive industry and this grow ing trend started in the end of 80’s. In contrast w ith European regulation of CO2 emissions , China regulations are in term of fuel consumption w ith 6.9 L/100km in 2015 and a target of 5 L/100km in 2020. Production in China has developed in tw o w ays, through joint ventures w ith foreign brands and w ith local automakers. The automotive industry generates a trade deficit over 33€ billion.
5.
Industry Overview and Competitive Positioning
Source: IHS, ACEA-ACEA Econom ic and Market Report Q4 2016
Figure 17 - Light Passenger Car Registration Market Share by Region 2016 0% 10% 20% 30% 40%
China Japan India South Korea
South Asia
Source: ACEA Econom ic and Market Report Q4 2016
Figure 19 - Asian Countries Global Vehicles Registration weight
Source: ACEA
Figure 18 - EU Passenger Car Trade in Value (€ Million) - € 50.000 € 100.000 € 150.000 € 2014 2015 2016 Export Import
9
1 – Already includes Opel/Vauxhall car sales of 2016
Dem and Outlook
European Dem and
Macroeconomics condition
The automotive industry, w hich is highly sensitive to general economic grow th and consumer confidence, given it high, operating leverage and low average margins . Automaker margins are highly influenced by the economic cycles, making the GDP, employment, population prospectus, government policies, road infrastructures and financing conditions some of the indicators closer to future projections of grow th. After an increase of 1.5% in Europe (Figure 20) it is expected by IMF a stabilization over the next few years, how ever is expected much uncertainty in Europe by geopolitic al concerns.
Financing conditions
Alternative financing services have a positive impact for vehicles sales and its sales even more important after 2008 crisis, given the decrease of generalized costumers’ income of principal markets. Now adays, the financial condition for costumers become even more attractive due the low credit conceded by banks after 2008 crisis, the car manufacturing financing gain market share w ith w ider offer of services, insurance and leasing, and low er interest rates for new cars, 16% less than for used. With a historical increasing global demand for auto financial services, automakers competed w ith
traditional financing services being even cheaper for the costumer – (Figure 21).
Governments Policies
With automakers, selling vehicles w orldw ide it becomes more challenging to respect each country government regulations. Environment and protectionism policies have a negative impact of global demand, for instance, Russia increasing import tariff, U.S renegotiate the North American Free Trade Agreement and Europe CO2 emissions reduction to 95g/km per vehicle by 2020.
Foreign Exchange
Car manufacturers have their production plants spread w orldw ide and sell in every part of the globe and it must consider the different currencies of each market. It is essential to Auto Companies hedge their currency risk in the financial markets, how ever now adays, the European companies have a strong position in terms of the value of EUR/CNY being low er w hen compared to 5 years ago. Figure 22. Even though European auto manufacturers increased their exportations, most of big players, locate their production plants in strategic emerging countries to reduce transportation costs.
Chinese Dem and
Source: IMF
Figure 20 - EU and China GDP Growth
Note: CSM = Community small banks; CMF = Car manufacturing financing; CML = Car manufacturing leasing.
Source: Q1 2017Auto financing report, Evolution Finance
Figure 21 - Interest rates on New and Used cars
6,00 CNY 7,00 CNY 8,00 CNY 9,00 CNY 10,00 CNY 11,00 CNY 12,00 CNY A pr 0 3, 2 0 0 7 M ar 2 5 , 2 0 08 M ar 1 7 , 2 0 09 M ar 0 9 , 2 0 10 M ar 0 1 , 2 0 11 Fe b 2 1 , 2 01 2 Fe b 1 2 , 2 01 3 Fe b 0 4 , 2 01 4 Ja n 2 7 , 2 0 15 Ja n 1 9 , 2 0 16 Ja n 1 0 , 2 0 17
Figure 22 - EUR/CNY Exchange Rate
-10% 0% 10% 20%
2000 2005 2010 2015
10
Macroeconomic Conditions
China’s economic grow th contribute w ith 25% to the World economy being the most
important player in automotive industry. In the last 16th years the average GDP grow th
w as 9.42% (Figure 20), also the GDP per capita increased exponentially after 2nd
millennium. (Figure 23).
These values show the importance for auto manufacturers their localization in China, making now adays joint ventures w ith local manufacturers to enter the Chinese market. According to Ministry of Public Security for every 100 households, there are 31 private cars, being a market w ith a huge potential.
Financing Conditions
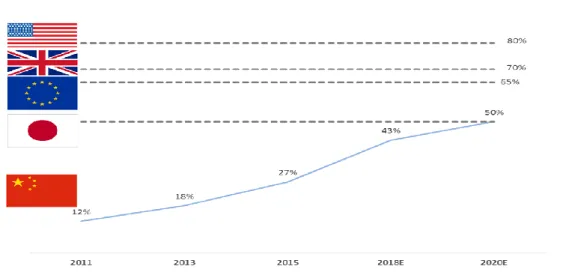
Auto-finance rate of penetration in China in 2016 w as around 35%, very below matur e markets such Europe, U.S and Japan w ith penetration rates above 50% - Figure 24. This lack of development in automotive finance industry allow s a large room for grow th. Chinese automotive finance market is still dominated by commercial banks and auto finance companies, w hich together represent more than 80% of market share.
Road Infrastructure
According to Pw C research, the urbanized population rate grew from 27% (1991) to 58% (2016), also the public expenditure on infrastructure projects remained strong, how ever tends to be counter-cyclical, correlating negatively w ith economic grow th. After the 90’s, China highly invested in highw ays and expressw ays which is essential
for automotive industry development – Figure 25. According to most recent new s from
Chinese government, China is prepared to invest $720 billion on 303 transport infrastructure.
Consumer Behavior
Chinese automotive consumers choose their vehicles based on price, performance, quality and fuel consumption. When compared w ith w estern consumers, Chines e consumers have less brand loyalty and are less concerned w ith new alternative green engines. Boston Consulting Group analysis revealed that, over 75% of consumers w ould change brand w hen they purchase the new vehicle.
Government Support 0,00 USD 3 000,00 USD 6 000,00 USD 9 000,00 USD 0,00 USD 15 000,00 USD 30 000,00 USD 45 000,00 USD 1960 1968 1976 1984 1992 2000 2008 2016
European Union China
Source: World Bank Data
Figure 23 - EU and China GDP per capita (U.S Dollars)
Figure 24 - Penetration Rate of China Auto Retail Finance Products Source: Deloitte China Autom otive Service
0 5 10 15 0 100 200 300 400 500 1 98 0 1 98 5 1 99 0 1 99 5 2 00 0 2 00 5 2 01 0 2 01 5
To
ta
l e
xp
re
ss
w
ay
le
n
gt
h
To
ta
l h
ig
hw
ay
s
le
ng
th
Highways ExpresswaySource: Ministry of Transportation; China Statistical Yearbook 2016
Figure 25 - Total Expressway and Highway length in China
11
Chinese government policies are very behind of Western countries to reduce CO2 emissions, since the main environment policy applied is petrol consumption reduction providing consumers w ith a subsidy of 430€, for cars purchased w ith an engine w hich consumes less than 5.9L/100 km. In addition, there are a small move to reduce C02 emissions, the government w aived the vehicle purchased tax for new -energy vehicles by the end of 2014.
Supply Outlook
Production factors
To produce vehicles, automakers need raw materials that are divided into raw materials that are negotiated w ith vendor (steel and plastic) and raw materials that are quoted as market prices for commodities traded in organised markets (aluminium, copper, lead or precious metals). Manufacturers are highly dependent on raw materials, since on average almost half of CoS are raw materials, becoming this factor
essential to be managed to reduce production costs – Figure 26. Machinery and labour
costs also affect the production costs being one of the reasons w hy brands locate their production plants in Asian’s countries w ere labour costs are significant low er.
Changes of Prices
Automotive manufacturers set prices based on their production costs but also the how
fuel price affect consumers behaviour – Figure 27. Given the low operating margins an
increase of vehicle prices increases the supply of units.
Government policies such as, import tariffs and taxes cause a major impact on cars supply, w ith electric vehicles having tax benefits in most of EU countries. Oil prices and car manufacturers have a negative relationship not affecting only demand but also the supply, being now adays less importance w ith new alternative engines.
47% 21% 6% 3% 10% 6% 7%
Materials Direct Labour R&D Logistics Administration Depreciation Others Source: Autom otive Engineering Partners
12
Netw ork and Dealer Global Production
A spread w orldw ide netw ork of dealer is essential for companies to reach new markets and segments. Companies through joint ventures gain access the emerging countries w here they can increase sales and reduce production costs w ith low er labours costs,
in exchange, they provide the expertise to local manufacturers.
Global light vehicle production in 2016 grow th by 3% to 91 million units compared to last year. It is expected that grow s by 17.6% from 91 million units in 2016 to 107.4
million units in 2023 – Figure 28. This high-expected grow th of light vehicles occurs
given new emerging countries development in the automobile market and the w ell spread netw ork of dealer in those countries. In addition, the new alternative engine w ill contribute.
COMPETITIVE POSITIONING
European regulations lead to digitalization
European automobile industry invests annually €44.7 billion into R&D, much of that in
fuel-efficiency technologies. Regulations influence highly in automobile manufacturer’s
future grow th since they must change their production structure w ith high capital requirements to compete in a new automobile market. European Commission reached an agreement of carbon dioxide (CO2) emissions reduction to 95 g/km on average per new car by 2020 – Figure 29. This regulation w ill benefit the implementation of hybrid and electric engines and the automobile manufacturers that have a low CO2 emission, such as PSA brands that leads cleanest brands w orldw ide.
600.000 850.000 1.100.000 1.350.000 1.600.000 - € 1,00 € 2,00 € 3,00 € 0 1-0 3-… 0 1-1 0-… 0 1-0 5-… 0 1-1 2-… 0 1-0 7-… 0 1-0 2-… 0 1-0 9-… 0 1-0 4-… 0 1-1 1-… 0 1-0 6-… 0 1-0 1-… 0 1-0 8-… 0 1-0 3-… 0 1-1 0-… 0 1-0 5-… 0 1-1 2-… 0 1-0 7-… 0 1-0 2-…
Fuel Price PC Registration Units
Figure 27 - Fuel price and Passenger Car Registration MoM Source: OECD data
0 45 90 135 2 01 5 2 01 6 2 01 7 F 2 01 8 F 2 01 9 F 2 02 0 F 2 02 1 F 2 02 2 F 2 02 3 F 2 02 4 F
Source: IHS Autom otive Global Sum m ary Figure 28 – Light Vehicle Production forecast (Units: Millions) PSA Toyota Renault Daimler BMW Volkswagen Average 0 40 80 120 160 1100 1300 1500 1700 A ve ra ge C O 2 e m is si o n s (g /k m )
Average mass vehicle (kg)
Target line 2020 Target line 2015 Source: European Environm ent Agency
Figure 29 - Top-selling EU passenger cars m anufacturers groups for 2016
13
European and Chinese Rivalry
Manufacturer’s competition for sales and margins are the hugest challenge now adays given the entire changing scheme in production chain. New engines, environment regulation and matured markets makes one the key challenges of PSA Group. European market for PSA w ill be the key opportunity to become the largest manufacturers, after the Opel acquisition, having the needed to become even more efficient to achieve higher operating margins. Regarding the environment regulations , PSA is the brand manufacturer better positioned to achieve 2020 target.
How ever, in the Chinese market the situation is different, w ith more than 500 brands
operating, the PSA Group have a poor position on the top selling brands (20th selling
2016), having the necessity to supply vehicles w ith more quality components to achieve higher market share in premium market, maintaining the small and low er medium size vehicle supply. Moreover, the company must be committed to develop
electric cars to compensate the generalized decline of combustion engines – Figur e
30. (Appendix 8)
Global Product Launches
Automotive Industry forecasts indicates a clear grow th over the follow ing years, w hich indicates higher operating margins for auto companies. Emerging countries w ill take a major place on that grow th, making essential to big manufacturers sw ift their products
launch adjusted to buyers’ preferences. PSA strategy to achieve brands’ global
ambitions plans to launch 121 new products for the next 4 years. VW Group sustainable strategy promise 30 new electric models by 2025 and Renault Group considered India as a priority market, planning to launch at least one new model for the next five years, becoming the number one European brand.
Table 2 – SWOT Analysis
0 1 2 3 4 5 Competitive Rivalry Bargaining Power of Suppliers Bargaining Power of Buyers Threat of Substitute Threat of New Entrants Europe China
Source: Student’s analysis Figure 30 - Porter’s Five Forces
14
Competitors Strategies
Volksw agen AG
European leader and World second largest car manufacturer represents 22.5% of European market share and 13.5% w orldw ide. VW Group is one of the key pillar of w orld automobile industry w ith a strong presence in every markets w hich affects other manufacturer’s strategies. VW main Strategy 2025, consists in four target dimension, excited customers, excellent employer, role model for environment and competitiv e profitability. Also it is projected to increase distribution ratio for 30% and a ROI over 15%.
Renault & Nissan
Before PSA and Opel transaction, Renault w as the second largest car manufacturer in Europe. Renault-Nissan partnership are one of the largest w orldw ide manufacturer representing 9% of w orldw ide market share. Currently Renault SA, have 5 brands in their portfolio, Renault, Dacia, Lada, Alpine and Renault Samsung Motors. The partnership, over the last years had highly invested in electric vehicles, being
now adays the undisputed leader in zero-emissions mobility – Figure 31. It is assumed
by leadership of the company that the main strategy remain constant, boosting innovation for the vehicle future, launch at least 10 models w ith autonomous drive by 2020.
Fiat Chrysler Automobiles (FCA)
The company comprises 12 brands w ith a w ide range of vehicle segments and it represents 6.9% of European market share. The main strategy divides by their segments, mass-market vehicles, Maserati and global luxury brands. Actual strategy of FCA, 2014-2018 f ocus on the globalization of Jeep and Alfa Romeo, volume grow th, continued platform convergence and cost efficiencies. Also the leadership is focused in improving their capital structure after the separation of Ferrari.
Cars pow ered by gasoline and diesel are major polluters . The Volksw agen emissions scandal show n w orldw ide, that faith in diesel as a more environmentally friendly fuel w as a flop. UK joined France in pledging to end the sale of new gas and diesel cars by 2035. All new cars sold in Europe w ill be battery-electric after 2035, driven by government support, falling battery costs and economies of scale – Figure 32.
Now adays, the cost of ow nership for an electric car are more expensive than diesel/petrol cars, due the high cost of battery costs and low distance concern. Drivers’ most concern is maximum length distance batteries allow , being 100-200 km today, but expected to reach 600 km over the next decade. Majority of consumers requires 400 km range from Battery-Electric vehicles to shift from diesel/petrol cars – Figure 33.
How ever, the potential shift to electric cars underpinned by falling battery costs are being study by carmakers as Volvo, after 2019 w ill only launch electric and hybrid. VW, Daimler and BMW despite their intentions to challenge the EV leader, Tesla, they are years above, since only BMW, i3, isn’t based on a combustion-engine car. Currently Tesla, is selling vehicles w ith a range of more than 400km for 91k € and in w ill began to delivery in EU, Model 3 for 35k €.
6.
From Fossil to Electric
Competitors Market Share Zero-Emission vehicles Sales (thousands) Average emissions CO2/km PSA 17,1% 4,2 102,4 VW 22,5% 9,2 118,26 Renault-Nissan 14,4% 49,8 105,3 FCA 6,9% 1,3 116,3
Figure 31 – Com petitors Key Figures
Source: ING Bank – Breakthrough of electric v ehicle threatens European car industry
Figure 32 - Share of BEV new registration in Europe
Source: ING Survey with over 52,000 Dutch Figure 33 - Range of BEV (Units: Kilom eters)
15
European car manufacturers face the challenge of the century, lose their competitiv e advantage of the internal combustion engine development to have low er opportunities in electric pow ertrains. Pressure on electric motors and batteries innovations w ill make their margins squeeze, making already this segment dominated by North-America and Asia, in w hich Europe represent a minor role – Figure 34.
Despite the minor role of Europe market, most of European carmakers have their
strategies defined to gain their share market on these new market – Table 6. The
most ambitious European carmaker is Volksw agen w ith forecasts of 2-3 million
annual electric car sales by 2025 w hich corresponds to 30 % of today’s sales
challenging the sector leader Tesla.
Peugeot SA Valuation Price is €20.67, at 20 July of 2017YE, using tw o methods . Discounted Cash Flow (DCF) approach give a target price of €19.76 w ith an upside potential of 3.75%, w ith a REDUC E recommendation. With another valuation method, Relative Valuation through multiples supports our first approach w ith a target price of €21.57 w hich is consistent w ith a recommendation of REDUCE. Both valuation
methods allow us to consider PSA share w ell valued given the price of €19.05 at 20th
July of 2017 – Figure 34.
Discounted Cash Flow Valuation Method: Free Cash Flow to the Firm
Using a DCF valuation it w as achieved a target price of € 19.76, w ith this valuation method determines the value of a share and cash flow available for distribution for shareholders. Using the WACC rate as a discounted rate to discount future FCFF, allow s to determine the Enterprise Value of the company minus the market value of Debt reaching the market value of Equity.
7.
Valuation
OEM Announcement
Tesla 0.5 million annual electric car sales by 2018 1 million annual electric car sales by 2020 Volkswagen 1 million annual electric car sales by 2020
2-3 million annual electric car sales by 2025 Renault-Nissan 1.5 million cumulative sales of electric cars by 2020 Volvo Launch only cars with electric/hybrid after 2019 1
million cumulative electric car sales by 2025 BMW 0.1 million electric car sales in 2017 and 15-25% of
the BMW Group's sales by 2025
Daimler 0.1 million annual electric car sales by 2020 PSA Group 4 electric vehicles launched by 2019
Table 6 – OEM’s electric v ehicles strategy Source: Student Analysis
Figure 34 - Evolution of the global electric car stock Source: IEA – Global Electric Vehicle Outlook
16
Forecasting company’s financial statements for the next 5 years combined w ith forecasted discounted rate permitted to compute FCFF. How ever, there are several items essential w ith influenced the FCFF.
Revenue
PSA Group has three automotive brands w ith different car-segment and customer type. Also w ithin the five brands, each of them has a different market share betw een countries. Despite automotive manufacturer, there other forms of revenue as, components parts and financial services. These diversified forms of revenue make
essential to forecast revenue by segments – Figure 35. Sales is expected to increase
in the first three years and decrease afterw ard, mainly given automotive business line, due the lack of efficient transition to electric cars manufacturer .
Cost of goods sold (COGS)
In the last 4 years, COGS account for an average of 80% of revenues, how ever Opel/Vauxhall historical average is 86% forcing the COGS margin of 83% of revenues. This is the key cost of automobile manufacturers, containing costs for developed vehicles and vehicles in progress. The forecast for this item it to decrease over years w ith Mr. Tavares efficiency plan for the new acquired.
Net Debt
It a debt outstanding of €3.3Bn maturing at 2033 and w ithout any information of intent to issue more debt, Peugeot SA has a negative net debt due the high value of cash accounts and it is expected to grow over the previous years - Figure 36. This unusual net position allow s the company to restart to pay dividends and realize investment activities to create additional value.
Capital Expenditures, Depreciation and Amortization (CAPEX, D&A)
Due Opel/Vauxhall integration on PSA Group, both tangible and intangible assets w ill increase their accounting value but not due capital expenditures. In 2016, PSA Group expend over €3,5 billion and is expected to grow linked to revenues by 7% annually . Regarding the depreciation rate, it is projected to be 5.1% also connected to revenues.
WACC Assumptions
Weighted average cost of capital method w as used to compute the cost of equity and it represents the rate of return required for debt and equity using the w eights of equity and debt of PSA’s capital structure. A risk-free rate of 2% in the terminal years based on a historical years AAA Eurozone bonds and a market risk premium of 6.4% - Table 7. Also, w as assumed a leverage beta of 1.2 based on daily data and a linear regression betw een CAC Index and Peugeot SA’s share. The cost of debt is assumed to be 5.1% based on PSA debt level and an effective tax rate of 34% in 2017 decaying to 28% afterw ards. PSA Group has an unusual capital structure w ith debt ratio of 31.70% decaying to 30% in 2021, but for the terminal year is assumed that it w ill convey to competitors (VW, Renault, Ford, Toyota, etc.) capital structure.
The WACC rate increases over the forecasted period due the deleveraging procedure,
making the WACC assumed in perpetuity being 5.41%
After Opel/Vauxhall being fully integrated and not being expected another expansion in large scale, PSA Group perpetuity grow th rate of 1.25% is assumed for the terminal period. -10.000 20.000 30.000 40.000 50.000 60.000 70.000 80.000 90.000
Figure 35 - Revenue Forecast (units: Million Euros)
Figure 36 – Net Debt (Units Million Euros)
Source: Student’s analysis and estimates Table 7 – WACC Assum ptions
COST OF EQUITY
Ris k Free Rate 2,00%
Market Ris k Premium 6,23%
Beta Leverage 1,2
Cos t of equity [Rf+beta(Rm-Rf)] 9,48%
COST OF DEBT
Cos t of debt 5,10%
Marginal tax rate 28%
After-tax cos t of debt 3,67%
CAPITAL STRUCTURE
Weight of Equity 30%
Weight of Debt 70%
17
Dividend Policy
The company does not have a dividend distribution policy in past. Facing financial issues over the last years, made captive dividend distributions to ensure a solid financial position evolution. How ever, Mr Tavares announced the introduction of a dividend policy based on a payout ratio of 25% w ith effect from the 2016 financial year,
representing almost €500 Millions paid in 2017.
Selection of Peers
A four-step method w as applied to determine the most adequate peers of PSA Group - Appendix 10. Starting w ith companies w ith a business structure similar, Automotiv e and Finance Division. Also revenue range betw een €50M to €100M and profitability indicators comparison w hich lead to final peer selection w ho are VW, Nissan, Renault and BMW - Table 8.
Relative Valuation Approach
Based on a multiple valuation techniques allow s to achieve a most accurate result of DCF model. The forw ard multiples EV/EBITDA and EV/SALES permited to achive a target price of €21.67, corresponding a upside potential of 13.75% from the closing price €19.05. This multiple recommend Reduce – Table 9.
The P/E multiples w ere not used due the misstament of stock value of comparables and it w ould affect Group PSA valuation.
Company
Peer?
PSA
Fiat
NO
VW
YES
Renault
YES
BMW
YES
Daimler
NO
Hyundai Motor
NO
Nissan Motor
YES
Table 8 – Peer Analysis
Source: Student’s analysis
EV/EBITDA
PSA
3.5
VW
2.9
Nissan
4.2
Renault
6.3
BMW
3.2
Average
4.15
Table 9 – Forward Multiple
18
OverviewThe projected financial condition of the group faces hard challenges, it is projected a jump in their P&L volumes, due Opel acquistion. How ever, due their lack of
production efficiency w hen compared to Group PSA and main competitores w ill delay them. Also, electric cars market w ill affect negatively mainly because Group PSA not shift their production and development to electric-engines and battery.
Segments impact
Automotive division, w hich comprises production and sales of passenger and light commercial vehicles continnuos to be the main revenue’s source w as it common in all car manufacturers. It is projected a increase only in 2017YE but decaying afterw ards due electric cars booming market.
Faurecia w hich represents Automotive equipment division, had main over the years their revenue volume, supplying other brands. Financial division serve as an
intermediarie to finance sales of vehicles, w hich follow s automotive division grow th – figure 37.
Financial Position
Since 2013, cash flow from operations had been rising from € 757 millions to € 6,470 millions in 2016. These success w as possible by a more accurate management of operations is mainly given cultural changes imposed by CEO, Carlos Tavares. It is projected to decay in 2017YE to € 4,680 millions because integration Opel operation’s w ill need time to create synergies – Figure 38.
Gross Profit and EBITDA margin
To evaluate the efficiency of a car manufacturer is common to analyse gross profit margin and EBITDA margin, it allow to understand the efficiency of production and also a clear view of company’s operating profitability. Regarding gross profit margin, it allow s to understand how much money is left from revenues. It permitt to assess the group’s financial health – Figure 39.
Distribution of dividends
Poor financial results made the company not distribute dividends since 2010, how ever financial results start getting better in 2014. But Carlos Tavares and their management team decided to cut off dividends until long-term strategies been
correctly applied. “Push to Pass” strategy came back the dividend payout policy
w ith a 25% payout ratio.
8.
Financial Analysis
Ratios Unit 2015 2016 2017F 2018F 2019F 2020F 2021F
PROFITABILITY RATIOS
Gross Profit Margin % 18.6% 19.1% 16.5% 17.0% 17.5% 17.8% 18.0% EBITDA Margin % 5.00% 5.99% 6.13% 4.88% 4.82% 3.55% 3.50% EBIT Margin % 3.61% 4.83% 5.10% 4.15% 4.10% 2.83% 2.79% Net Profit Margin % 2.20% 3.98% 3.87% 3.41% 3.34% 2.39% 2.33% ROA % 2.4% 4.8% 4.8% 4.6% 4.4% 3.2% 3.1% ROE % 9.8% 14.7% 14.1% 14.6% 13.0% 9.0% 8.6%
LIQUIDITY RATIOS
Current Ratio times 0.85 1.04 1.12 1.13 1.17 1.15 1.13 Quick Ratio times 0.67 0.83 0.87 0.88 0.92 0.90 0.89 Cash Ratio times 0.47 0.59 0.62 0.60 0.63 0.64 0.63
Figure 37 - Segments growth projections
Figure 38- Cash flow Operations
19
Market Risk | Macroeconomics (MR1)
Group’s earnings are largely dependent on the European market and to a lesser extent the Chinese market. Furthermore, the company’s activities in the British, Russian, Brazilian and Argentinian markets exposed it to exogenous risk as currency risk, adverse change in tax/customs regulations and geopolitical events. Despites these threats, global economy is expected to remain stable and non-financial crisis is forecasted w hich contributed to PSA grow th.
Market Risk | Sector (MR2)
Each region has a different grow th path and w ith PSA’s highly dependence on European market creates a liability. In 2016, the European economy grow 1.5% and is expected to remain stable next year, w hile Chinese economy grow th 7% and is expected to grow 5% next year. The remaining market w here PSA operates are expected to constant. As a counter measure of these risks, internationalization through strategic joint ventures to produce in emerging countries.
Market Risk | Emergence of new demand (MR3)
New forms of mobility such as car-sharing, car-pooling and connected services demanded by customers creates an opportunity to enter a new market, Internet industry. The insufficient control of the advances of the new players creates an exposure of these new business models. This new paradigm affects company’s production plans, fluctuating vehicle models’ production. How ever, the company created a program that anticipates changes in market structure w hich allow s to hedge the risk of shortage of engines.
Operational Risk | Customer and Dealer risk (OR1)
The PSA Group is exposed to the risk of customers and dealer default. Sales w ith a buyback commitment, the risk concerns the difference betw een the vehicle’s estimated resale price and the actual resale price. The company developed a secure payment policy to avoid credit risks for the sales not financed by Banque PSA Finance, w hich consists on protection mechanisms to fully guarantee the payment of amounts ow ed by foreign importers.
Operational Risk | Raw Materials and Supplier Risk (OR2)
Given that more than 50% of a vehicle’s production costs are parts and components purchased from suppliers, it is required technical, quality, logistical and financial
performance from suppliers to the PSA Group’s overall performance. Suppliers are
evaluated, selected and monitored according to a large range criteria. Also, the Purchasing Department assesses the impact of supplier’s base on “make-or-buy policy” in order improve profitability. In 2016, around 30% of the purchasing budget w as used in raw materials. To counter the supply and economic risk embedded, the company optimize global source, using bulk purchases, searching for alternativ e materials and implementing financial hedges.
Operational Risk | Information systems risks (OR3)
Company’s information systems, including those embedded in vehicles, stem from targeted attacks or malicious activities, anomalies in the behavior of participants, failures or disasters. To counter this risk, PSA uses preventing systems w hich require several authentication procedures.
9.
Investment Risks
Source: Student’s analysis Figure 39 - Risk Matrix