Environmental Effects on
Eucalyptus saligna Sm. Wood Density
RAl/L MANUEL DE ALBUQUERQUE SARDINHA Eng. Silv. (Lisl.), D. Ph. (Oxon)
Agriculture and Forestry Faculty, Lisbon University
INTRODUCTION
Although the view is generally accepted that the vegetation of an area, through its physionognomy and productivity, provides a tangible initegration of the total site complex and that in its interac- tion with the genetic make-up of the species will make a plant to yield not only the largest possible quantity of product but also the best possible quality, there frequently exists a distrust of efforts to express quantitatively the relationship between site productivity or site environmental characterstics and wood quality. The growth of a tree and, consequently, its wood quality is an integral process but it has innumerable aspects all of which must be explored if a compre- ensive view of growth or its wood quality is ever to be achieved. However, such effects are not widely or adequately understood. Too few have had the necessary help to study the subject in a compre- ensive way. Most would be confused by the apparently conflicting data and conclusions of various yet too few investigations of the numerous factores of significance. Actually, the conclusions of these studies are undoutbtedly correct if interpreted strictly within the conditions and species studied. However, interacting factors that coudl
82 ANAIS DO INSTITUTO SUPERIOR DE AGRONOMIA
change the results radically, are usually not considered at the some time.
The cost of development of man-made forests is high and there is a possibility that through inadequate planning in which concerns forest implantation, much less than its potential value to a country can ever be realised.
No doubt deciphering the structure of an equantion expressing wood quality in terms of environmental variables appears to be a for- midable task. The determination of the coefficients and exponents of the variables is difficult but its necessity is brought about by the complexity of the relationships and the number of factors that par- ticipate in the phenomenon. The basic difficulty in making investi- gations of these kind lies in the lack of sufficient number of empirical data, collected by standardised data gathering. The International Biological Programme (IBP) has iniciated standardised data gathe ring action vvithin its framework, to test more rigorously the applica- tion of mathematieal empirical methods to ecological studies of the kind being made by Czamowski (1964) and by Czarnowski et al.
(1968).
In which concerns wood quality and si te characteristics, another source of difficulty arises because of the variability among and between trees. Much of this variability within a species is not imme- diately evident and the difference from tree to tree and within a species may occur as a consequence of the position may occur as a consequence of the position in the tree of the piece considered or as a result of a fast or slow growth. As pointed out by Larson (1969) «we are sampling a continuum and all statistical evaluations must take this source of variation into consideration. All wood quality evaluations are statistical, and failure to consider the biological sources of varia- tions is one of the greatest causes of confusion in the wood quality literature».
Variation in the wood structure and quality of a species arises from a complex system of interacting factors, which determine and rnodify the physiological processes involved in the production of xylem. Among these factors the influence of the environment and of heredity has been a subject of controversy and interest for many years. The issues of practical importance are the effects on rate of growth and on the intrinsic wood consitution as a result of all develop- mental phases characterising wood formation in a particular site, on the values of wood properties and use characteristics.
In a conceptual form if we represent wood quality by Q and if we do not consider end uses properties demands, Q is function of the conditions Ca in whitch its wood is formed.
As Ca may be considered an open physical system characterized by a certain number of quantifiable faetors we may express by sym- bols, the quality of a wood equals the resultant of the action of all faetors in the (t-to) interval.
Then, quality may, be represented by a functional of the following form:
Where:
k= constant term specific of each species
g= genetic make — up and heredity
e= environmental characteristics a= anatomical characteristics c= cultural technique
The determination of use characteristics by direct testing is a laborious and often expensive process that usually involves destructive sampling. Wood technologists have therefore endeavoured to relate wood properties and use characteristics to structural features and simple properties so that the latter can be used as convenient indices of wood quality. Density bas been used for a long period as an index oí this sort, and even when we recognise its limitations for a predic- tion of value for the numerous purposes for which hardwoods are used, we have still to regard it as the main single criterion to judge wood quality.
This study on Eucalyptus saligna Sm. wood density variation was part of a continuing study of this species in Angola being carried out by the Agriculture and Forestry Research Institute. Objectives of the study were to increase existing knowledge of the variation encountered, the main site faetors which may alter the quality and to accumulate data that might be used both for estimating timber quality and for tree improvement, cultural technique programmes and best implementation sites for new extensive plantations.
t to
Cadt = | * f [ k, g (t), e (t), a (t), c (t),... dt
84 ANAIS DO INSTITUTO SUPERIOR DE AGRONOMIA
PROCEDURE
Six plots from three regional sampling areas were selected as representative of the high peneplain of Angola where E. soiigna Sm. has been extensively planted. At each regional location (Scaala, Cuiva and Malange, identified as Si, So an S3, (maps 1, 2 and 3) two plots were selected. In each plot demarcated to contain 100 trees, 5 trees were randomly choosen according to the Commonwealth Forestry Institute’s «Sampling Procedure for Investigation of the Structural Features of Wood».
A soil pit was dug in each plot and soil samples collected from each horizon or characteristic profile change down to a maximum depth of 1.65 m for Sacaala, 2.00 for Malange and 0.60 m for Cuiva where Consolidated rock or a generally heavy stony layer occurred. Soil characteristics are set forth in tables 1 and 2. All climatic data
TABLE 1
Mechanical analytical soil data
Site and plot Identification Depht
cm Coarse sand % Fine Sand % Silt % •Cl ay % Sacaala si/i 10-20 31.9 28.2 5.5 33.8 25-41 29.1 17.6 4.7 43.4 60-80 24.4 18.7 4.4 52.5 V 10-19 45.3 20.3 5.9 29.5 19-39 35.4 18.1 3.2 42.8 50-70 28.0 16.9 7.2 47.7 Cuiva S2/l 5-15 32.9 38.3 5.5 23.6 25-35 18.4 30.4 6.5 45.7 45-55 11.3 30.2 6.8 51.3 90-100 12.2 27.0 6.4 53.7 S2/2 5-15 40.5 44.3 3.9 10.3 25-35 41.1 38.1 4.4 17.1 Malange S3/l 15-25 42.8 40.3 2.6 13.7 45-55 36.7 40.0 4.3 16.9 110-120 34.2 43.1 3.8 20.5
C h em ic a l a n a ly ti cá l so il d a ta § CO lO r-03 o 8 oCd o © 8 CD 8 8 © 3 Tf 8 CO 8 O O o © c- IO -si d d © © © Pt t- © © CD rH PI © rH »0 lO c- 8 03 Pt 00CD orH o © 8 rHrH IOrH Cd05 © 8 * 10 oO Cd CO è lO Tf rH o 00 CD Tf d © © © O Tf co r-í © 00 rH IO ò lO o o Cd IO
s
§ 00 £ rH cd rH I .o s lÀ rH «ti d 3 CO IO d d d d rH ui r— Cd Pt d pi pt k d IO CO © o00 Cd 03 O 8 or- o> 05 cd co rH 8 05 cos
co PtIO 1 00 © D 05 rH Pt IOCd d d oó CD IO Tf d © © © rH co 8 d © cd rH IO © w IO rH CO §8 C3 CO pt OTf O00 8 o© COrH 3 rH © CD rH c0 05 lO iO O ío 8 lO r-í o t- -P d Tf rH d d © Cl ■f © © rH cd © I g 3 O 00CD IOCO Tf CO O rH COco 8 8 Cd 05 8 Cd o IO n e 05 CO á d rH Cd cd I>rH id TJÍ d © © © © Tf CD rH O o rH d s 03 8 rHt'- CO IOCO oco o S 8 o O ■f CdIO 1 00 X3IO k pí 03 IO Tf ° rH 8 rHCD lO Tf d © © © © Tf © © rH* r-í © 8 Cd COrH Tf CD 8 8 5 IOCd 2 8 8 TfCO 05 05CD s rH 3 1 IO rH Pt d -3* IO d © © O 05 rH rH rH IO IO 00 o 00 co CD © 8 IO s 35 £3 è io PÍ cí rH 00 -r Tf d O © © o Tf CD rH r-í © CD rH OÓ o g t> 00CO TfCO oTf IOIO o 3B8 8 Tf 3 1 rH Cd CdTf o O cd rH CD id d © © © Cd tH rH rH Cd \ 05 CO o s 03 IO OCD 03IO o 00 Pt S 8 8 Tf rH IO © 8 c- Cd è 03 05 rH r-l rH t>rH Tf rH IO Tf d © © © © CO d O © Tf rH d 05 rH CO 8 § 00 orH 3 « o CD CO OrH © rHIO Cd Cd rH Tf co CD S <oIO rH o d rH « 2 d 't' d o © © © ■«f Cd rH r-í © p-rH IO d 8 CO rHCO & Cd 8 O o 8 2 8 Cd cd 05 CD © C-co CD 8 co D CD Cd O CO d e<i Cd Cd 2 CD Tf d © © © © CO CD © O Tf rH rH © rH \ rH Tf Cd 8 8 00 oIO OIO © CdrH OrH 8 8 3 Cd rHt> rH 8 © CD & rH 03 cd rH cd CDrH IO Tf d © d © o Tf 00 © O Tf rH pt © 8 rH oCOs
00 00 IOco cotH IOCO í»cd cdrH ss 3 W rH00 rH O rH © h CDCd CO cd tH rHrH id Tf d © o © d Tf 8 © í> rH IO rH d2«S,d'|daMS
i i i i ft k M tC II O 4? s a 03 H 0 $ « g 01 O h x: c -5 TS 3 S s O Cô 03 H O < Pota ss iu m a v a il a b il it y in te rp re ta ti o n : a -su it a b le ; b -m a rg in a l; c -d ef ic ie n t. P h o sp h o ru s a v a il a b il it y in te rp re ta ti o n : a -d ef ic ie n t-m a rg in a l ; b -d ef ic ie n t; c -v er y d ef ic ie n t.86 ANAIS DO INSTITUTO SUPERIOR DE AGRONOMIA
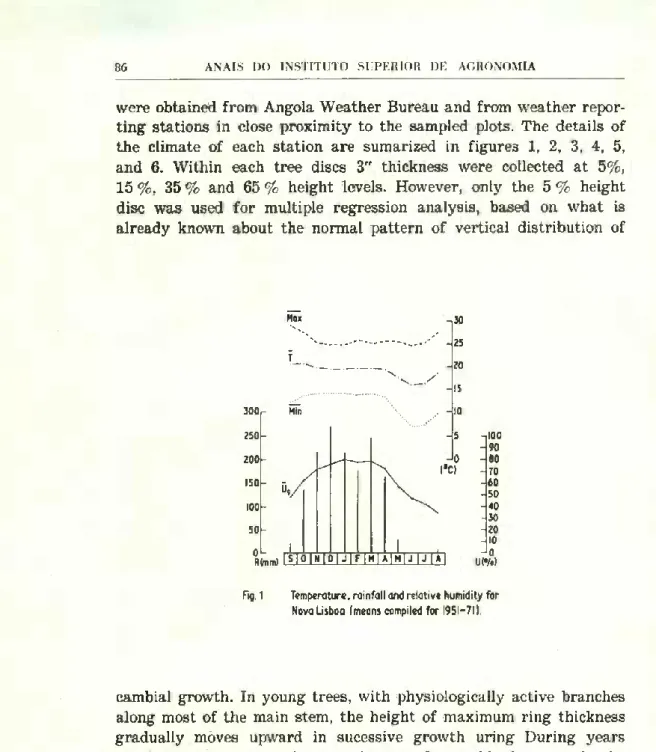
were obtained from Angola Weather Bureau and from weather repor- ting stations in dose proximity to the sampled plots. The details of the dimate of each station are sumarized in figures 1, 2, 3, 4, 5, and 6. Within each tree discs 3" thickness were collected at 5%, 15 %, 35 % and 65 % height leveis. However, only the 5 % height disc was used for multiple regression analysis, based on what is already known about the normal pattern of vertical distribution of
100 90 80 70 60 50 40 -|30 20 10 0 U (•/<■)
Fig. 1 Temperature, rainfall and relative humidity for Nova Lisboa (means compiled for I95I-7I).
cambial growth. In young trees, with physiologically active branches along most of the main stem, the height of maximum ring thickness gradually moves upward in sucessive growth uring During years of high rainfall or conditions otherwise favourable for growth, the point of maximum xylem increment occurs at a relatively lower levei in the stem than under conditions unfavourable for vigorous crown activity (Smith and Wilsie, 1964; Kozlowski, 1971). Also during years which are favourable to rapid growth, the products of increased metabolism are translocated to the lower stem and markedly affect growth there. Hence, xylem incrementhelizar of the lower stem
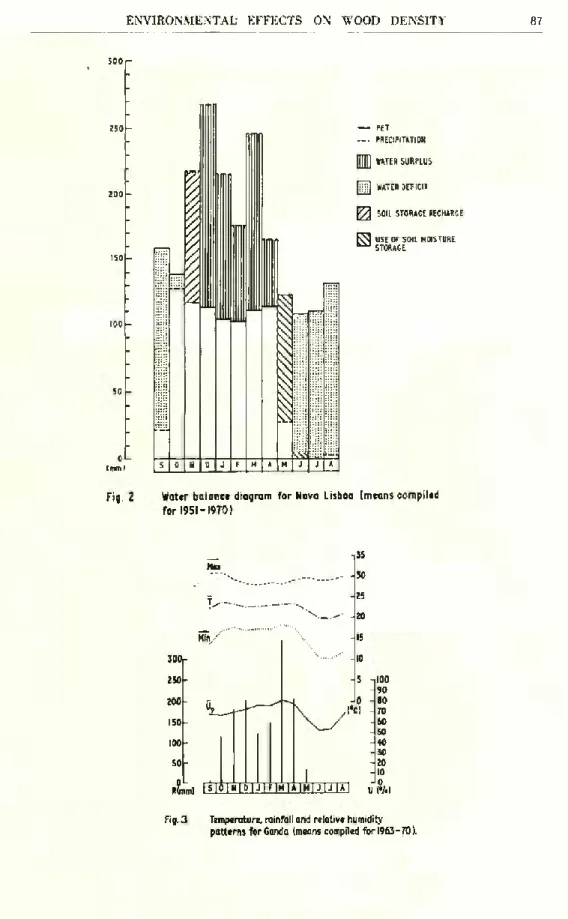
300r 250 100 -50 0L imm) — PET — PRECIPITATION JJJ] WATER SURPLUS [jj]j] WATER DÉFICIT
VA SOIL STORAGE RECHARGE
USE OF SOIL MOISTURE STORAGE
Fig 2 Water balance diagram for Nova Lisboa (means compiled for 1951-1970) -,100 - 90 - 80 - 70 -60 - 50 -40 -30 -20 - 10 -lo U (•/•)
Fig. 3 Temperature, rainfall and relative humidity patterns for Ganda (means compiled for 1963 -70).
88 ANAIS DO INSTITUTO SUPERIOR. DE AGRONOMIA
— PET --- PRECIPITATION [f[[í1 WATERSURPLUS ÍH WATER DÉFICIT
Y/\ SOIL STORAGE RECHARGE USE OF SOIL MOISTURE STORAGE
Fig.4 Wat«r balance diagram for Ganda (means compiled for 1960-1970)
exhibits a greater sensitivity, than does xylem produced within or near the crown, to environmental fluctuations from year to year.
Prior to the measurement of density the correct number of annual iings were determined, and the assignement of a correct year of origin were done. The technique, of cross-checking involved to avoid false rings induced by environmental fluctuations is described by Sardinha (1974). The accurate density of each ring were done by x-ray densitometry as also described by Sardinha (1974).
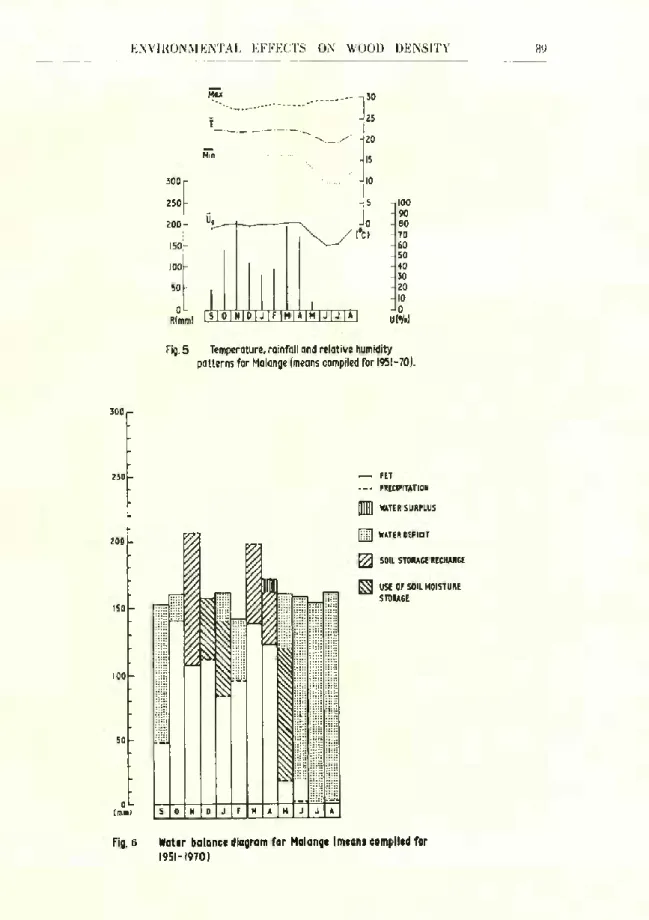
I30 - 25 -20 - 15 -10 250 - 200 - 150 - 100 - 50 -oL R(mm) -ilOO - 90 - 80 - 70 -60 - 50 - 40 -30 - 20 - 10 -lo U (<*/.) Fig. 5 Temperature, rainfall and relative humidity
patterns for Malange (means compiled for 1951-70).
---- PRECIPITATION d) WTERSURPLUS ISO 100 50 -OL (mm)
[íiiil WATER DÉFICIT
V/\ 50IL ST0RA6E RECHARGE ^ USE OF SOIL HOISTURE
STORAGE
Fig. 6 Watcr balance diagram for Malange (means compiled for
90 ANAIS DO INSTITUTO SUPERIOR DE AGRONOMIA
RESULTS
The analysis of variance of density using 5 % height disc data and also with weighted tree values (tables 3 and 4) showed that differences existed between the three areas that were sampled. Since differences between plots within geographic areas were in all cases much smaller than differences between geographic areas there is some ground to think that differences in density between sites are
TABLE 3
Summary of the analisys of variance for mean density (g/cc) (5 % height disc)
Source of variation V/ratio
Variance components % Sites (S) ... 4.42 x 11.35 Plots in sites (P) ... 0.66 0.00 Trees in P and S (T) ... 28.24 xxx 33.29
Radii in Trees, P and S (Q) ... 3.90 xxx 1.82
Rings (Ri) ... 61.91 xxx 31.11 Ri * S ... 2.56 xxx 2.38 Ri * P ... 0.80 0.00 Ri * T ... 3.57 xxx 11.27 Residual ... 8.78
x — signifioant at the 0.05 probability levei; x x — significant aí the 0.01 probability levei; xxx significant at 0.001 probability levei.
TABLE 4
Summary of the analysis of variance and variance components for weighted tree density (i)
Source of variation V/ratio
Variance components % Sites (S) ... 5.02 x 28.27 Plots in sites (P) ... 0.84 0.00 Trees in P and S ... 71.73
(i) based on data colected at 5%, 15%, 35% and 65% leveis of total height.
not entirely attributable, to genetic control. In fact, differences bet- ween plots within geographic areas are in all cases much smaller than differences between geopraphic areas.
The overall effect of environonmental factors in each of the sites sampled in Angola has been to produced wood with ajpreciably diffe- rent properties.
The best fit of a number of multiple regression analyses, which considered various expressions of the distribution of precipitation and of atmospheric humidity as well as those soil factors that seemed likley to have an effect on physiological development (table 5) was as follows:
Y = b0 + biXu — boX2!! — b3X12 — b,X13 + br,X3o — boX43 — b7X411 + b8X413 + b9X52 — bxoXss
With r2 = 0.2955 and F = 20.13 x x x
TABLE 5
List of variables of site used in the multiple regression analysis Precipitation and temperature variables
X X1= mean annual rain fali (mm)
X 10= (Sept. + Octo. + Nov. + Dec. + Jan. + Feb. + Mar.)/7 X 13= (April + May)/2
X 14= (May + Jun. + Jul. + Aug. + Setp.)/5
X 01 = Mean relative humidity of May, June, July, August & September X 3Q= Mean annual temperature (°c)
Soil variables
Soil depth (m)
Silt in the first horizon (%)
Silt in the second horizon (%) Clay in the first horizon (%) Clay in the second horizon (%)
Moisture equivalent in the first horizon (%)
Moisture equivalent in the second horizon (%) Tenor of nitrogen in the first horizon (%) Tenor of nitrogen in the second horizon (%) Tenor of phosphorus in the first horizon (p.p.pm.) Tenor of phosphorus in the second horizon (p. p. m.) Tenor of potassium in the first horizon (me./lOO g) Tenor of potassium in the second horizon (me/100 g) x« = X,3 = X« = X40 = X<7 = X<8 = X 40 = Xm = X„2 = Xm = Xm =
92 ANAIS DO INSTITUTO SUPERIOR DE AGRONOMIA
The analysis showed that after elimination of non-significant variables, those retained were significantly or highly significantly different from zero. However, in terms of the coefficient of multiple determination, the model only explained 29.55% of the total variation in the density of the trees with a residual Standard deviation of 0.0822 g/cc. The amount of variation explained by this regression in which expressions of environmental factors are used as independent variables is about the same as the between site ccmponent of variance in the analysis of variance shown in table (4). Partial regression coefficients, their Standard errors and significance are set forth in table 6.
Of the variables concerned with rainfall, it was shown that den sity is positively correlated with average monthly precipitation, nega- tively associated with the square of mean monthtly precipitation,
TABLE 6
Multiple regression of density on variables of the site
Variables Partial regression
coefficients Standarderror Significance of the coeff.
Constante term ... 3.3312 E-03 1.2586 E-03
X
Precipitation variables
X31 4.4201 E-02 1.4409 E-02
X
X2ix 1.5707 E-05 4.0176 E-06
XXX X 12 2.4119 E-02 3.4031 E-03 X X X13 6.5917 E-03 2.3712 E-03 X X Temperature variables X 30 4.4223 E-02 7.2203 E-03 XXX Soil variables X 43 7.7645 E-02 7.1104 E-03 XXX Xm 5.4394 E-02 8.5494 E-03 XXX
X-I13 6.1626 E-01 2.8131 E-01
X Other variables x02 1.1875 E-04 1.4971 E-05 XXX X53 3.8773 E-03 1.9732 E-03 X
with the mean of precipitation of the seven wet months and with the mean precipitation of April and May.
It was reasoned that those expressions of combinations of measu- rements of precipitation that were significant represented periods of effective rainfall. From this it was further reasoned that the pre cipitation that may occur during the period of slow radial growth or when growth ceased (tested in the analysis by including the value of mean precipitation of May, June, July, August and September) dit not have any effect on development of denser wood which would have increased the mean ring density because this variable was non significant.
The variables expressing soil conditions that were retained by the stepwise elimination procedure in the multiple regression analysis were the percentage of silt and phosphorus content (a negative asso- ciation) and the interactions of mean monthly rainfall with the content of prosphorus and of potassium of the first levei, which in a way express the leaching effect of the rainfall in the upper soil horizons.
DISCUSSION
A rather small part of the variation in density between sites (28 %) was ascribable to the effect of certain environmental factors ccnsidered likely to have an effect on the physiology of wood deve lopment.
Of those factors considered, all that showed sificanoe were in some way related to soil moisture availability; although the soil mois- ture equivalent of the first and second horizons was not among them. Since this variable expresses the capacity of the soil for water reten- tion its exclusion from the regressions suggests that the differences in this feature of the order recorded between the three sites (range of moisture, equivalent, of 8.92-21.03%) was not a criticai factor in the development of the densiy of the trees. Since the percentage values for soil moisture conent at pF 4.2 (wilting point) were also different (range: 4.2 to 16.8%) it seems that the water availability from storage thoughout the year was not a restritive factor in any site in the growth and wood development of E. saligna. Although the soils are different in their storage capacity it seems that the low soil moisture equivalent of plot 2 in Cuiva site is compensated for by a smaller soil depth which reduces severe losses by internai drainage.
94 ANAIS DO INSTITUTO SUPERIOR DE AGRONOMIA
In this plot the high percentage of coarse and fine sand in the upper soil layers will aiso provide a strong mulching effect that may minimises evaporation tosses and, consequently, prevents the deve- lopment of acute water stress in the trees.
The non significance of the air relative humidity of the dry season was surprising, in view of the importance of water stress in the deve- lopment of latewood, or latewood-like cels and that such cells were found almost invariably in all rings of these samples of E. saligna. The lack of a significant relationship may have been due to the fact that values for mean monthly relative humidity were used. It would probably have been better to use mean values from observations at C9.00 and 15.00 hours which would have differentiated more clearly between the three regions in this aspect of climate (map 2). The higher night values increases the mean value for relative humidity, and the inclusion of measurements of humidity during the period when no photosynthetic activity takes place would, probably redueed the usefulness of this independent variable in the regression. The effect of including in the regression only the values for 09.00 hours or 15.00 hours could not be tested, because for one of the sites a mean value only was available.
The positive correlation of density with mean monthly precipi- tation and its negative association with the means of the seven months with the highest mean rainfall, and with the mean of seven precipitation of April and May, suggests that the seven wetter monhs and April and May are the effective periods for the formation oí earlywood and that the thin layer of denser wood with slit-like lumens develops after May. This is in accordance with the pattern of breast height radius growth in E. saligna recorded by dendrometers as shown by Sardinha (1974) (fig 7). However, since some precipita tion did occur in May, June, July August and September and was non significant it seems that cessation of growth is probably due to the severe low daily relative humidity during these drier months which causes stomata to close and inhibits photosynthesis.
These data do not imply that the rainfall at other periods of the year was ineffective, but they do seem to indica te the predominant influence of certain periods with efectiveness that may be slightly different between sites as indicated by comparison of available water in fig. 2, 4 and 6 and the mean values of density in each site. The increased number of months with water déficits at the Malange site perhaps explains to some extent the denser wood at this site but
vvould not explain the occurrence of lighter wood in Cuiva when compared with Sacaala. Regional differences in soil qualities can be expected to modify the effect or effectiveness of the rainfall. For exemple, soils with high moisture-holding capacity in the B-horizons are likely to promote the formation of springwood-like cells. However, if the differences in moisture equivalent were largely responsible for the differences in density between Sacaala and Cuiva we should also
MONTHS
Fiq. 7 Patttrn of breast height radius growth of E. SALIGNA {SACAAUK1970-71)
expect a significant difference between plots in Cuiva because of the differences in soil moisture equivalent between the two plots of this particular site (range: 7.39-19.74%). The mean values for density of the two plots at the Cuiva site are in fact not significantly diffe- rent O).
The differences between sites in potassium and phosphorus con- tent of the soil although not very large seem to have some influence in wood density, mainly the content in the second horizon (between 0.19-0.55 m depth) which is also the layer with the highest propor- tion of roots and where greater biological activity is to be expected.
(i) Variance components of plot efects expressed as percentage of total
96 ANAIS DO INSTITUTO SUPERIOR DE AGRONOMIA
In the regression model the comparative values of the partial regres- sion coefficients for potassium and phosphorus showed that the posi tive association with ptassium is much more important than the nega- tive association with the phosphorus content. The potassium content of the soil however, does not provide an explanation for the low values for wood density in Cuiva. In fact, potassium content in the Cuiva site is similar to that of plot 2 of Sacaala but if there is no significant difference in density between plots 1 and 2 of Sacaala, it occurs between plot 2 of Sacaala and Cuiva. It seems therefore, likely that the Cuiva material is as a whole genetically different from the
E. saligna of the other two sites.
CONCLUSIONS
The results of this investigation do not justify an attempt at present to predict density for any specified set of site conditions. The biogical complex, of factors controlling density are as yet too little understood to be reduced to a prediction model, and further work is required with an increased geographic range of samples of E. saligna, in which other soil variables than those considered here, and their interactions, together, with more detailed climatic data, are considered. Nevertheless, the generalization can be made for E. saligna that within its range, sites with low rainfall, higher temperatures and higher atmospheric relative humidites and soils with higher potassium and iower phosphorus contents may tend to produce denser wood.
No conclusions could be drawn with respect to the effects of genetic variation on density and the relative importance of heritable factors and of environment, although at various points in the discus- sion the possibility of inherent differences between sites has been suggested. Heritable differences in density can be determined only by studies with clonal material from trees produced by controlled cross pollination. Even with information on heritability, interpreta- tion of observed differences between trees would still have to be made with caution, since very little is known about the physiological pro cesses of wood development.
As there was still a considerable amount of variation not explai- ned by the model, and since there is some reason to think that this is largely due to genetic differences, it seems advisable to avoid seed collectd from Cuiva site for new plantations.
ABSTRACT
Variation and the effects of site conditions on the density of
E. saligna wood were investigated. A range of climatic and soil data
within that part of Angola where E. saligna is planted was tested by selecting 2 sample plots from each of 3 different sites. Climatic data from Angola Weather Bureau stations in the vicinity of each plot were summarized for each of the years corresponding to those rings represented in basal dise. On each plot soil samples from soil pits were obtained and analised.
Differenoes in density were found to exist between sites. On a site basis, density increasd from Sacaala site to Malange and from west (Cuiva) to east (Sacaala). The independent variables that were found by multiple regression analysis to account for part of this between-site variation (28 %) were those related to rainfall and mean annual temperature; the soil variables were the content of phosphorus and potassium of the second soil horizon and the interactions of mean annual rainfall with the content of phosphorus and potassium of the first soil layer. Factors of the site related to moisture — holding capacity and depth of the soil unexpectedly fail to reach significance.
RESUMO
EFEITOS DA ESTAÇÃO NA MASSA VOIXMICA DA EUCALYPTUS
SALIGNA SM. EM ANGOLA
Analisam-se neste estudo os efeitos de vários parâmeetros carac- terizadores da estação na variação da massa volúmica da E. saligna de Angola. Em cada uma das três estações características da área de expansão da E. saligna (Sacaala, Malange e Cuiva) foram colhidas 5 árvores de cada duas parcelas casualmente implantadas bem como amostras de solos e dos diferentes factores climáticos respeitantes a essas parcelas.
Foram encontradas diferenças significativas no valor da massa volúmica entre as três estações. Nesta base, a massa volúmica aumenta do Sacaala para Malange e decresce na direcção do Cuiva. As variá veis independentes que através da análise de regressões múltiplas mostraram ser responsáveis por cerca de 28 % da variação da massa volúmica entre estações ecológicas foram as relacionadas com a queda
98 ANAIS DO INSTITUTO SUPERIOR DE AGRONOMIA
pluviométrica e temperatura média anual, o conteúdo do fósforo e potássio do segundo horizonte do perfil do solo e a inter-acção entre a queda pluviométrica média anual com o conteúdo de fósforo e potás sio do primeiro horizonte. Os factores do solo relacionados com a capacidade de retenção da água no solo e a profundidade do mesmo não se revelaram significativos.
REFERENCES
CZARNOWSKI, M. S. (1964) —Productive capacity of locality as a function of soil
and climate with particular reference to forest land. Louisiana State University Press. Baton Range. La.
CZARNOWSKI, M. S. F. R. Humphreys and S. W. Gentle (1967)— Site-index as
a function of soil and climatic characteristics. A preliminary note based on man-made stands of Pinus radiata in New South Wales. Doc. Fo/ /MMF:67-4a/2. FAO.
Kolzlowski, T. T. (1971)—Growth and development of trees. Academic Press.
London (2 vol.).
Larson, P. R. (1969 — Wood formation and the concept of wood quality. Buli.
Yale Univ. School of For. No. 7//.
Sardinha, Raúl M. de A. (1974) —* Variation in density and some structural
features of wood of Eucalyptus saligna Sm. from Angola. University of Oxford, 357 pp. (l.° vol.) (Unpublished D. Ph. thesis).
SMITH, D. M. and M. C. Wilsie (1964) —• Some anatomical responses of loblolly
■