A Client Focused Business Intelligence &
Analytics Solution for the Hospitality Sector
Ana Rita Albuquerque Santos
Project Work presented as the partial requirement for
obtaining a Master's degree in Information Management
NOVA Information Management School
Instituto Superior de Estatística e Gestão de Informação
Universidade Nova de LisboaA CLIENT FOCUSED BUSINESS INTELLIGENCE & ANALYTICS
SOLUTION FOR THE HOSPITALITY SECTOR
Ana Rita Albuquerque Santos
Project Work presented as the partial requirement for obtaining a Master's degree in Information Management, Specialization in Knowledge Management and Business Intelligence
Co Advisor: Miguel de Castro Simões Ferreira Neto Co Advisor: Manuel Inácio Veladas Dias
iii
ACKNOWLEDGEMENTS
First of all, I would like to thank Pestana Hotel Group and my NOVA IMS advisors for their collaboration in this project and for allowing me to learn even more that what I have learned during this master.
A special appreciation to my colleagues and friends of the Business Intelligence team, Edgar and André that helped me throughout all my difficulties and that have proven to be the best coworkers that I could possibly get. A special thanks to them is not enough. As well, I would like to thank the Business Intelligence team director, João, for his help and time spent on this project.
To my family, especially to my father, mother and brother that were and always will be my greatest strength. For never allowing me to give up and always showing me the path even through the darkest times, I don’t know what I would do without you.
To my boyfriend, David, for his love and patience with me, for the encouragement to always be better and for the unconditional support, thank you. As well, to my best friends Catarina, Inês, Miguel and Miguel for their availability to listen to my doubts and for all the times they distracted me with their good mood, joy and their capability to show me the best side of life but especially to Catarina for helping me being on track even when everything was blurred, she was always one of my biggest supporters not only in this thesis but in everything in life.
Also, I would like to thank everyone not mentioned above that allowed the conclusion of this project, whether friends, master classmates, my teachers or my coworkers.
This is truly an accomplishment in my life. I would like to finish these acknowledgments with a phrase by Misty Copeland that perfectly describes this life phase: “Anything is possible when you have the right people there to support you”.
iv
ABSTRACT
One of the greatest needs of today's business is to know the customer or the type of customer it wants to reach, which makes a customer database a strategic weapon and one of the most important investments a company can make. The business world is becoming more competitive every day, we are constantly overwhelmed with advertisements of products we may like, product promotions we usually buy or discounts on the next purchase if we subscribe to the company’s newsletter. All of this creates a client customization, and any company that is not able to do this cannot keep up with its competition. This report details the project developed at Pestana Hotel Group, which consisted of a Business Intelligence solution, more specifically the development of a customer database with the creation of two tabular models using SQL Server tools, one specific for loyal customers and another, more general, with information about all Pestana customers, and two Power BI reports that allow the visualization of the information obtained in an effective and simplified way. This report contains a literature review that situates the reader on the subject addressed in this project, a chapter dedicated to the data modeling used to create the tabular models, and another on the creation of the reports.
KEYWORDS
v
RESUMO
Uma das maiores necessidades dos negócios atuais é conhecer o seu cliente ou o tipo de cliente que quer atingir, o que torna uma base de dados de cliente uma arma estratégica e um dos mais importantes investimentos. O mundo empresarial está cada dia mais competitivo, somos constantemente assoberbados com anúncios de produtos que podemos gostar, promoções de produtos que costumamos comprar ou descontos na próxima compra caso subscrevamos a newsletter. Tudo isto cria uma personalização para o cliente, e qualquer empresa que não o consiga fazer não conseguirá acompanhar a concorrência. Este relatório detalha o projeto feito no Pestana
Hotel Group, que consistiu numa solução de Business Intelligence, mais especificamente na
construção de uma base de dados do cliente com a criação de dois modelos tabulares através de ferramentas do SQL Server, um específico para clientes fidelizados e outro mais geral com informação sobre todos os clientes Pestana, e dois relatórios em Power BI que permitem a visualização da informação obtida de uma forma eficaz e simplificada. O relatório contém uma revisão de literatura que situa o leitor sobre os assuntos abordados neste projeto, um capítulo dedicado à modelação dos dados de forma a criar os modelos tabulares e outro sobre a criação dos relatórios.
PALAVRAS-CHAVE
vi
INDEX
1.
Introduction ... 1
1.1. Problem Definition and Objectives ... 3
1.2. Methodology ... 4
2.
Literature review ... 5
2.1. Business Intelligence ... 5
2.2. Business Intelligence Architecture ... 5
2.3. Self-Service Business Intelligence ... 6
2.4. Data Warehouse ... 6
2.5. Data Warehouse Architecture ... 7
2.5.1.
Types of Data Tables ... 7
2.5.2.
Schemas ... 8
2.6. Extract, Transform, Load ... 9
2.7. Cubes ... 10
2.7.1.
Multidimensional Structure ... 11
2.7.2.
Tabular Structure ... 12
2.7.3.
Views and Materialized Views ... 13
2.8. Dashboards ... 14
2.9. Technologies and Tools ... 14
2.9.1.
Technologies ... 14
2.9.2.
Tools ... 15
2.10.
Relevance of Cubes and Power BI ... 16
3.
Tabular Modeling ... 17
3.1. Models ... 17
3.2. Source Tables and Tables Description ... 18
3.3. Views ... 21
3.4. Data Import... 24
3.5. Tables Relationship ... 24
3.6. Data Models Diagrams ... 27
3.7. Tables Personalization... 29
3.8. Partitions ... 29
3.9. Measures And Calculated Columns ... 30
3.10.
DAX Calculated Tables... 44
vii
3.12.
Roles ... 45
3.13.
Deploy ... 45
3.14.
SSIS Processing Package ... 46
3.15.
Publishing In Production ... 47
4.
Report designing ... 48
4.1. Data Loading Strategy ... 48
4.2. Model Import to Power BI ... 48
4.3. Requirements of the reports ... 49
4.4. Report Design and Wireframing ... 50
4.5. Metadata ... 51
4.6. Client Report ... 53
4.6.1.
Report Explanation ... 53
4.6.2.
Bookmarks and Buttons ... 54
4.6.3.
Tooltips ... 54
4.6.4.
Mobile View ... 56
4.7. PPG Report... 57
4.7.1.
Report Explanation ... 57
4.7.2.
Dynamically Display of Images ... 57
4.7.3.
Bookmarks and Buttons ... 58
4.7.4.
Mobile View ... 58
4.8. Final Considerations ... 59
5.
Conclusions ... 60
6.
Limitations and recommendations for future work ... 62
7.
Bibliography ... 63
8.
Annexes ... 66
8.1. Annex A - Client Report ... 66
viii
LIST OF FIGURES
Figure 1 - Star Schema Template. (Adapted from: (MicrosoftDocs, 2019)) ...8
Figure 2 - Snowflake Schema Template. (Adapted from: (Urbanek, 2013)). ...9
Figure 3 – 2020 Gartner Magic Quadrant for Analytics and Business Intelligence Platforms
(Adapted from: (Microsoft, Info Microsoft, 2020)) ...16
Figure 4 – Client model; ...18
Figure 5 – PPG model; ...18
Figure 6 – Client View representation; ...23
Figure 7 – Fact Reservation View representation; ...23
Figure 8 – Card View representation;...23
Figure 9 – Client PPG View representation;...23
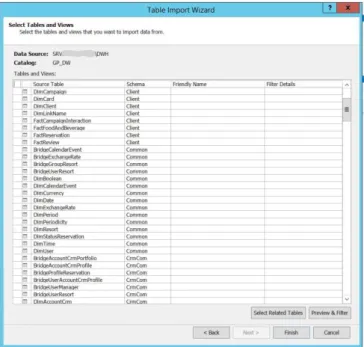
Figure 10 – Table Import Wizard from SSAS; ...24
Figure 11 – Client Data Model Diagram; ...28
Figure 12 – PPG Data Model Diagram; ...29
Figure 13 – Analysis Services Deployment Wizard details; ...45
Figure 14 – Connections of the SSIS package; ...46
Figure 15 – Package to process the model; ...46
Figure 16 – Data Import in Power BI; ...48
Figure 17 - Wireframe of reports; ...51
Figure 18 – Client Report Metadata; ...52
Figure 19 – PPG Report Metadata;...52
Figure 20 – Trip Type Tooltip; ...55
Figure 21 – Repeaters Tooltip; ...55
Figure 22 – Phone Layout example of each page of Client Report; ...56
Figure 23 – Example of each PPG report page in mobile view; ...59
Figure 24 - General page of the Client Report; ...66
Figure 25 – Non PPG vs PPG page of the Client Report; ...67
Figure 26 – Email Marketing page of the Client Report; ...68
Figure 27 - Resorts List page of the Client Report;...69
Figure 28 – Clients List page of the Client Report; ...70
Figure 29 - General page of the PPG Report; ...71
ix
LIST OF TABLES
Table 1 – Existing Views in the Data Warehouse; ...22
Table 2 – Views created AS-IS; ...22
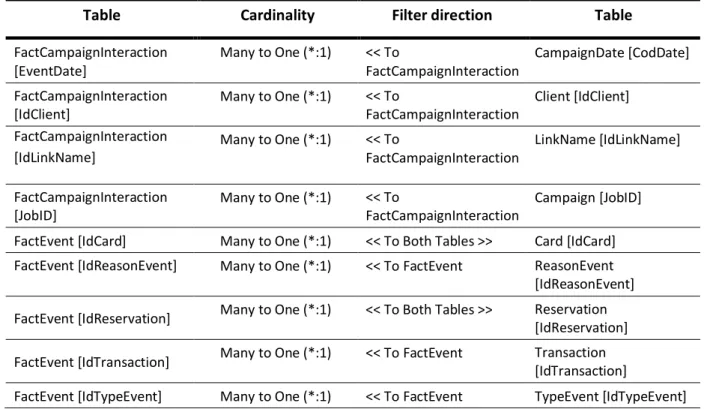
Table 3 – Relationships of the Client Model; ...25
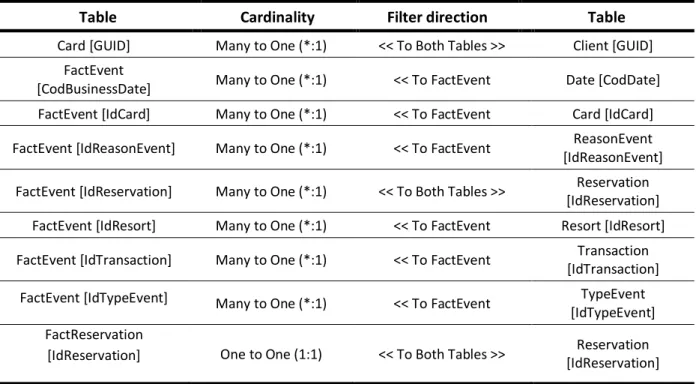
Table 4 – Relationships of PPG Model; ...27
Table 5 – Shared calculated column between Client and PPG models of Card table; ...30
Table 6 - Shared calculated columns between Client and PPG models of Client table; ...31
Table 7 - Shared calculated column between Client and PPG models of Date table; ...31
Table 8 - Shared calculated columns between Client and PPG models of Fact Event table; ...31
Table 9 - Shared calculated columns between Client and PPG models of Fact Reservation
table; ...32
Table 10 - Shared measures between Client and PPG models of Card table; ...35
Table 11 – Shared measures between Client and PPG models of Client table; ...35
Table 12 - Shared measures between Client and PPG models of Fact Event table; ...35
Table 13 - Shared measures between Client and PPG models of Fact Reservation table; ...36
Table 14 - Unique calculated column of Client table – Client model; ...38
Table 15 - Unique calculated column of Fact Campaign Interaction table – Client model; ...39
Table 16 - Unique calculated column of Fact Reservation table – Client model; ...39
Table 17 - Unique calculated column of Market table – Client model; ...39
Table 18 - Unique calculated column of Meal Type table – Client model; ...40
Table 19 - Unique measure of Client table – Client model;...40
Table 20 - Unique measure of Fact Campaign Interaction table – Client model;...40
Table 21 - Unique measure of Fact Food & Beverage table – Client model; ...41
Table 22 - Unique measure of Fact Reservation table – Client model; ...41
Table 23 - Unique measure of Fact Review table – Client model; ...41
Table 24 – Unique calculated column of Card table – PPG model; ...42
Table 25 - Unique calculated column of Client table – PPG model; ...43
Table 26 - Unique measure of Card table – PPG model; ...43
x
LIST OF ABBREVIATIONS AND ACRONYMS
BI Business Intelligence;
SSIS SQL Server Integration Services;
SSAS SQL Server Analysis Services;
SSRS SQL Server Reporting Services;
ETL Extract, Transform and Load;
DAX Data Analysis Expressions;
GUID Globally Unique Identifier;
PHG Pestana Hotel Group;
PPG Pestana Priority Guest – Loyalty program;
RN Room Nights – Amount of nights a client stays in a hotel;
LOS Length of Stay – Number of nights of a stay;
1
1. INTRODUCTION
With the evolution of the technological world, there is data everywhere. Some of the main challenges’ companies have to face is taking advantages of data, turning it into information and insights with the main goal of being better than the competition, and that is why Business Intelligence is becoming each time more necessary.
This project will be conducted in the scope of hospitality, in particular in Pestana Hotel Group (PHG) and will have as main objective the construction of a customer database and reports using the information. The database and the reports will be constructed using Business Intelligence tools that will allow to analyze Pestana Hotel Group clients and members of the loyalty program.
Pestana Hotel Group is the biggest hotel chain in Portugal, and one of the 31 biggest hotel groups in Europe. It was established in 1972 and has been growing throughout the years. Nowadays, it has 100 hotels and pousadas located in 16 countries.
Pestana Hotel Group has a loyalty program named Pestana Priority Guest (PPG) which is divided into 6 categories: diamond, platinum, platinum corporate, gold, gold corporate and silver. This program allows the guest to earn points according to the amount of money spent at the hotels. Then, when the card reaches a certain quantity of points, the client receives advantages.
Specially in the case of PHG, due to having an extensive amount of hotels and with all the data stemming from the loyalty program there’s a bigger necessity to keep track of it, in order to improve the experience of the customers and to keep being competitive, sustainable and to grow.
As such, BI tools will be used because BI turns data into functional information, permitting extended analysis of data and therefore the identification of tendencies, market behavior and organizational patterns. These analyses can be used to modify strategic plans, best assign resources and comply with budget.(Analytiks, 2019) & (Colavito, 2017) & (Lath, 2018)
Another great advantage of using business intelligence is to gain competitive advantages since it helps gain insights about the competition and market trends present in the industry. (Lath, 2018) Also, the BI systems allow to share important information across departments, as for example the use of cubes with Excel and the sharing of the Power BI reports that already happens in Pestana. (Analytiks, 2019)
Nevertheless, since the information available flows from many different sources (CRM, the reservation system, the platform used to track and view the answers given to the surveys, among others), it must be standardized with the aim of being effectively used. This standardization is done through an extraction, transformation and loading (ETL) process and it allows the creation of analysis and reports. (Desk, 2016)
Currently, Pestana Hotel Group already has consolidated data structures and several Power BI reports that help to better know the business and take insights from the data. There are 4 most-used cubes: Reservation, Reputation, Reservation Snapshots and F&B (food and beverages).
The Reservation cube contains all the data regarding the reservation (for example booked hotel, price, room type, quantity of nights, among others). The Reputation cube has the information of the opinion of the customers related to the hotels, it contains data from online reviews and the internal
2 surveys sent to each client post stay. The Reservation Snapshots cube contains the snapshot of each day of every hotel and 365 days ahead, which means that this cube contains both past information as well as reservations on the books (reservations to future dates). Besides, there’s a food and beverages cube that contains all the information related to the consumption of food and beverages in Pestana Hotel Group outlets (restaurants and bars). Reservation, Reputation and Reservation Snapshot cubes are built with a multidimensional structure while F&B cube has a tabular structure. However, PHG has not yet a structure dedicated fully to the customer – a customer database. A customer database can be recognized as one of the most important tools in an organization. (UK Essays, 2016) Its importance has been long discussed and several advantages are known.
Amongst them are the ability to communicate in a more efficient way by trying to reach the right audience and therefore building a brand affinity. (Stirista, 2020) Also, it can help in the mission of keeping the customers satisfied which can result in both an increase of the income and can help broaden the value of current customers. (Stirista, 2020) & (The Art of Service, 2020)
Likewise, it is much needed when analyzing different patterns of purchases of a client and to find out key tendencies. (The Art of Service, 2020) Another great advantage stemming from a client database is the capacity to enhance the marketing efficiency (in terms of campaigns) (The Art of Service, 2020)
since it will allow to not waste money in sending campaigns to clients that will probably not respond.
(Bonnie, 2019) Besides, a customer database can be linked with better customer service once that information like buying behavior, post-stay feedback and the answers to internal surveys allow to better know the client and attempt to meet its expectations. (Strategic Marketing, 2019) Specially in hospitality, this knowledge of the client can create a direct channel to them because knowing the customers preferences enables to characterize them. (Strategic Marketing, 2019) All this information will help to build an even more effective loyalty program which can result in repeated purchases, more memberships and therefore boost the revenue. (Bonnie, 2019)
When relating to customers, BI helps understanding the client buying tendency and having visibility of sales information allowing, thus, to tune and target the marketing campaigns but also to track these campaigns in order to assure they are profitable and efficient. (Richardson, 2018) & (Analytiks, 2019) Furthermore, and since the market is becoming fiercely, it’s never been more important to understand how the customers are interacting with Pestana Hotel Group and the best way to achieve them (Richardson, 2018).
Thus, there was a necessity to create a data structure especially dedicated to the customer in PHG. This database will be done by building two tabular models: one to know all the customers and the other to analyze the loyalty program members in particular.
The client model will have into account the customer behavior into 5 main perspectives: the reservations, the interaction with the campaigns, the satisfaction (measured by the responses given to internal surveys), the consumptions of food & beverages and, at last, the events associated with the loyalty card. The PPG (loyalty program – Pestana Priority Guest) model will have a more focused vision in the loyalty program, specifically the events associated with the card.
3 Then, these models will serve as base to construct two Power BI reports that will help to characterize Pestana clients, help the marketing and CRM teams to perform its analysis, and then to customize the campaigns sent to them by email.
This report is organized in seven chapters. The first chapter is the introduction where the objectives of this project are described, as well as a framework about Pestana Hotel Group and the intent of what the final products will be. The second chapter contains a literature review where all the main themes of this project are discussed, giving the reader a theoretical context. The third section holds all the details and steps done when building the tabular models (Client and PPG) and then, in the fourth chapter, the explanation of the Power BI built reports is done aside from other details about the construction of these reports. The fifth part contains the conclusion, furthermore, the sixth section comprises the limitations of this project along with future work that will be the next step. Lastly, in the seventh chapter a list of the books, articles and websites which served as base for the report, is presented.
1.1.
P
ROBLEMD
EFINITION ANDO
BJECTIVESWith market and competition evolution, it is crucial that the companies know their customers. As acknowledged, there are several problems that can come from not having a customer database, as the inability to personalize and fit marketing campaigns or emails, lack of context about clients to the sales representatives which can lead to direct sales to the wrong type of clients or being ineffective in engaging customers.
Currently, PHG already has client information however it is scattered across different systems and information sources which makes it difficult to access and often causes mismatches in information of the same customer. Furthermore, there are information collected by teams, for example the customer relationship management team, that may not be accessible to other teams, either because there is no knowledge of the platform used or even because there is no access to it by those teams. There are different issues associated with not having a centralized view of the Pestana client: it is sometimes impossible to work on projects in collaboration with other teams because the results will depend on the customer data that the teams have access to, lower levels of security once that instead of having the information stored in a single source there are diverse sources, and the speed at which the projects are done considering that it is much slower to access several different sources that access a centralized view of the information.
Therefore, by developing this project, it will be possible to create a client database for Pestana Hotel Group that will be the centralized view, at which all the teams customer-related have access and where all the customer information is gathered and organized. Furthermore, the building of two Power BI reports will allow the teams to make analysis with the information from the database.
4
1.2.
M
ETHODOLOGYThis project will have as methodology a new approach to research designated Design Science Research.
The methodology of design science research consists in answering questions relevant to business problems by creating new artifacts which lead to new knowledge. The artifacts built are valuable and essential to understand the problem (Hevner & Chatterjee, 2010)
Likewise, according to (Iivary & Venable, 2009), Design Science Research creates resources to solve problems or accomplish enhancements which generates a new reality, instead of clarifying and expounding an already existing reality. This methodology can be understood as a mixture between sciences as mathematics or statistics and the industry development. Hence, knowledge of sciences is abstract while knowledge in development of solutions to industries is specific and theoretically coherent. (Horvath, 2007). Thus, Design Science Reseach has two principal objectives: applying the already acquired knowledge of sciences to solve problems and produce new knowledge by creating solutions that solve those problems. (Horvath, 2007)
As stated by (Pello, 2018), there are seven steps to create design solutions:
1.
Perform end-user investigation: this investigation will allow to attain knowledge and find out the necessities of the users and what are the future needs.2.
Outline goals and limitations to the problem: after the end-user investigation, it will be possible to delineate the objectives of the design solution as well as the limitations that this solutions will have.3.
Collect ideas for the solution: By having brainstorms or meetings with users, it possible to collect ideas that can help in the creation of a better solution design.4.
Evaluate the ideas gathered: Sometimes the end-user has a vision that is not possible to perform due to restrictions associated with the platforms used to design the solutions, therefore, a process of evaluation needs to be done in order to select the best ideas.5.
Test: After the selection of the ideas and the building of the solution, it needs to be tested to see if it is comprehensible and easy to use.6.
After getting the first tests done, refine the solution and retest.7.
When reaching the final solution, share it with the suitable audience.These steps illustrate that in Design Science Research, it needs to have an initial contextualization of the problem, afterwards building the solution to the problem and then test it until the end result is suited to the problem.
This project will follow this methodology considering the new reality (i.e. problem solving) that will be created is the customer database. Applying the methodology into this project, the existing problem was the lack of a customer database. Therefore, after the requirements gathered, solution building, tests made and the fine tuning of the data, the customer database is going to be shared across teams.
5
2. LITERATURE REVIEW
2.1.
B
USINESSI
NTELLIGENCEBusiness Intelligence does not have a single definition, the general definition was given by Van-Hau Trieu in 2016.She defined itas an umbrella term to describe processes, or concepts and methods, that improve decision making by using fact-based support systems. (Trieu, 2016)
Some years before, in 2009, BI was definedas a collection of mathematical models and methods to perform analysis which give the ability to retrieve information and knowledge from data in order to be helpful in complex decision-making processes. (Vercellis, 2009)
Furthermore, in 2004, Negash described business intelligence as a natural outgrowth of prior systems that helped decision making. There were several factors that helped build a finer environment for business intelligence, among them are the following: the development of the data warehouse as a repository, the progresses in data cleansing that lead to a single truth, the improved capacities of hardware and software and the technologies that enhanced the user interface. (Negash, 2004)
This means that business intelligence is each day more important to the enterprises since it provides the capacity to analyze past behaviors and actions, with the purpose of understanding where the company was, its present condition and predict or modify what will happen in the future. (Imhoff, Galemmo, & Geiger, Mastering Data Warehouse Design. Relational and Dimensional Tecnhiques, 2003)
As stated by Howson, BI is “a window to the dynamics of a business”. It was characterized like that since it grant people in all corporate levels the ability to accede data, interact and study it to manage, enhance performance, find opportunities and work in a more efficient way. (Howson, 2008)
BI systems offer “actionable information delivered at the right time, at the right location, and in the right form to assist decision makers.” The goal is to boost the timeliness and excellence of inputs to the decision-making process, facilitating executives and analysts work. (Negash, 2004)
The main benefit of business intelligence is that it allows to transform data into information. It gives organizations the ability to visualize the bigger picture by incorporate data from different sources and lodge it in an way that enables employees to make better decisions. (Burrows, 2015)
2.2. B
USINESSI
NTELLIGENCEA
RCHITECTUREA Business Intelligence system is divided in three main components: Data Sources, Data Warehouses & Data Marts and Business Intelligence Methodologies.
▪ Data Sources: Data sources are essential to collect and consolidate the data stored in the different sources (this data is heterogeneous in origin and type). The data could be stemming from operational systems, but can also come from unstructured documents, for instance emails or data from external providers. (Vercellis, 2009)
▪ Data Warehouses & Data Marts: applying ETL, “the data originating from the different sources are stored in databases intended to support business intelligence analyses.” (Vercellis, 2009)
6 ▪ Business Intelligence Methodologies: Consists in mathematical models and analysis
methodologies applied to support decisions. (Vercellis, 2009)
2.3.
S
ELF-S
ERVICEB
USINESSI
NTELLIGENCEThe four main goals of self-service business intelligence are to make it easier to access source data for reporting and analysis, make BI tools easy to use and results easy to consume, make data warehouse solutions fast to deploy, easy to manage, customizable and simpler along with collaborative end-user interfaces. (Imhoff & White, Self-Service Business Intelligence. Empowering Users to Generate Insights, 2011)
When using SSBI tools, the users have access to diverse decision support features and functions to create their own ad-hoc BI solutions. Among these features are the creation, search, exploration, modelling, analysis and visualization of this solutions. With the lower complexity of this type of BI features it is more powerful and reachable to users since they can use SSBI technologies within their desktops or spreadsheet applications. (Poonnawat & Lehmann, 2014)
2.4. D
ATAW
AREHOUSEThe overall accepted definition of a data warehouse was declared by Inmon: “a data warehouse is a subject-oriented, integrated, nonvolatile, and time-variant collection of data in support of management’s decisions” (Inmon, 2002).Even though this definition is the most accepted, there are several others which define a DW, among them is the one given by Howson. “A data warehouse is the collection of data extracted from various operational systems, transformed to make the data consistent, and loaded for analysis.” (Howson, 2008)
A data warehouse is a repository of the data utilized for “developing business intelligence architectures and decision support systems. The term data warehousing indicates the whole set of interrelated activities involved in designing, implementing and using a data warehouse”. (Vercellis, 2009)
Also, it is a database which stocks integrated, historical and aggregated information that is extracted from different information sources. A data warehouse is utilized in strategic decision making.
(Husemann, Lechtenborger, & Vossen, 2000).
This type of data structure offers a unified vision of the company’s data, no matter how it is meant to be used afterwards by the users. It sustains the flexibility of data interpretation and delivers a stable basis of historical information which is constant, consistent and reliable.(Inmon, 2002)
Another great advantage of a DW is related to its size, that is to say that, as the information related to an enterprise is growing each day, a DW is able to grow at the same proportion. Since the beginning of the design, this structure is planned to adjust to the growth of the information in the most efficient way applying the rules defined by the enterprise. Furthermore, the data warehouse is used as support for any type of technology related to analysis within the enterprise. (Inmon, 2002)
7 The main goal of a DW is to give access to information which allows to manage the business. This management is possible by providing insights that could help improve revenues, reduce costs, enhance the customer service quality and align the strategic goals. (Howson, 2008)
2.5. D
ATAW
AREHOUSEA
RCHITECTURE2.5.1. Types of Data Tables
2.5.1.1. Fact Tables
Fact tables typically refer to transactions and have links to dimension tables (these links are essential to guarantee the proper reference of the information), as well as several rows that correspond to observed facts, which means, values of the attributes that describe the corresponding transactions and represent the actual target of the subsequent OLAP analysis. This type of tables contains the descriptive attributes needed to perform decision analysis and query reporting.(Vercellis, 2009)
There are several attributes related to decision analysis, such as performance measures, operational metrics, aggregated metrics and all the others related to performance conduct.“In other words, the fact table primarily addresses what the data warehouse supports for decision analysis. Surrounding the central fact tables (and linked via foreign keys) are dimension tables.”. (Sharda, Delen, & Turban, 2015)
2.5.1.2. Dimension Tables
Dimension tables usually correspond to the entities related to the processes of the organization. This means that this type of tables is associated with primary entities contained in the data warehouse. Regularly, the dimension tables are structured according to hierarchical relationships. (Vercellis, 2009)
These tables comprehend classification and aggregated information about the fact rows, besides, they contain attributes describing the data and address how data will be analyzed and summarized. In querying, and when performing an ad hoc analysis, the dimensions will be used to slice and dice the numerical values contained in the fact table to meet the requirements. (Sharda, Delen, & Turban, 2015)
Conformed Dimensions
According to Kimball, conformed dimensions exist when characteristics of different dimensions have equal column names and domain contents. (Kimball & Ross, 2013) For example, a single date dimension is needed even though it can be used with different filters (check-in, check-out, booking date, among others).
8
2.5.2. Schemas
2.5.2.1. Star Schema
The star schema consists on a central fact table which contains the facts of interest to an OLAP application surrounded by, and connected to, several dimension tables through referential integrity constraints based on the various dimension keys.
This schema is the current practice in data warehousing, most commonly used and the simplest style of dimensional modeling. Furthermore, the star schema is designed to allow fast query-response time, simplicity and easier maintenance.
In this non-normalized schema, the dimension tables have a one-to-many relationship with rows in the central fact table. The star schema is considered a special case of the snowflake schema. (Sharda, Delen, & Turban, 2015)
2.5.2.2. Snowflake Schema
The snowflake schema is similar to the star schema, however, it consists on centralized fact tables that are connected to multiple dimensions. This signifies that dimensions are normalized into multiple related tables in contrast to the denormalized dimensions in the star schema, where each dimension is represented by a single table.
The snowflake schema was named like this since the arrangement of tables in the multidimensional database, specifically the entity-relationship diagram appear the shape of a snowflake. This is due to the fact that dimensions can be composed of attribute hierarchies, that are unnormalized, their normalization results in this specific shape. (Howson, 2008)
9
2.6. E
XTRACT,
T
RANSFORM,
L
OADIn an enterprise, there is a huge volume of data stemming from different applications and data sources, yet all this data has to be integrated in the same repository. While OLTP (Online Transaction Processing) is efficient for short update transactions covering a small part of the database, data warehousing requires long queries that cover a large part of the database.
The ETL process extracts the data from source systems, transforms the data according to business rules, and loads the results into the target data warehouse. However, the quality of data in the DW is directly related to the efficiency of the process, which signifies that it greatly affects the capacity of enterprises to make decisions.
The extract, transformation, and load system of the DW/BI environment consists of a work area, data structures, and a set of processes. (Kimball & Ross, 2013) & (Kakish & Kraft, 2012)
The ETL process is divided in three steps, as the name suggests. The three steps are the following: ▪ Extract: The extraction of data is done through internal and external sources, also, each
system can use a different data format. The usual data source formats are flat files and relational databases, however, may also be non-relational database structures like Information Management System or alternative data structures. The extraction from these different types of sources create an additional difficulty to the process.
The determination of which data is relevant is a challenging task since the data contained in the source system is often very complex. This choice is based on the design of the data warehouse that, in turn, relies on the information necessary to the business intelligence analysis and the decision support systems.
The conversion of data into a single format appropriate for the next step of the ETL process is the main goal of the extraction phase, nonetheless, the design and creation of the extraction processes is a time-consuming effort. In order to keep the data updated in the data warehouse, it has to be extracted several times in a routine manner.
(Kakish & Kraft, 2012) & (Vercellis, 2009)
▪ Transform: The next step in the ETL process is the transformation stage. In this stage, a set of rules and/or functions are implemented to the data extracted from the source in order to prepare the data to be loaded in the end target. The manipulation of data
10 depends on its source, this means that some sources will require few transformations whereas others require plenty.
The improvement of the quality of data extracted from the different sources is the main objective of the cleaning and transformation phase, this is done as a consequence of the correction of discrepancies, missing values and inaccuracies.
(Kakish & Kraft, 2012) & (Vercellis, 2009)
▪ Load: Finally, the last step in the process is the Loading phase. At this stage, already transformed is loaded into the tables of the data warehouse. The loading process depends widely on the requirements of the organization, meaning that the process may differ depending on it.
“There are some data warehouses that overwrite the existing information with cumulative information; frequently updates with extracted data are performed on hourly, daily, weekly, or monthly basis.” (Kakish & Kraft, 2012)
The restrictions delineated in the database schema and the triggers initiated when loading the data, like for example uniqueness, will contribute to the global data quality performance of the whole process. After the three steps, the main goal is to make data available to analysts and decision support applications.
(Kakish & Kraft, 2012) & (Vercellis, 2009)
The ETL process typically uses three layers to the information flow: staging, integration and access. ▪ Staging Area: This area stores raw data from each one of the sources.
▪ Integration Layer: This layer integrates the data sets transforming the data that flows from the staging area and, often, stores the data in an operational data store (ODS) database.
Then, the integrated data is moved to the data warehouse and the arrangement of the data into hierarchies (dimensions) and facts is completed.
This whole process has a great significance in data warehousing architecture because ETL processes transport the data from the source systems to the staging areas and from staging areas to data warehouses. (Kakish & Kraft, 2012)
2.7. C
UBESA cube in OLAP (Online Analytical Processing) is a multidimensional data structure which allows efficient manipulation and fast analysis of data from multiple perspectives.
By having a fact table connected to n dimension tables, it is possible to obtain a grid of cuboids, where each of them corresponds to a different level of detail on one or more dimensions. This kind of aggregation is comparable with a sum resultant from a “group by” in a SQL query.
The design of a data structure like a cube pretends to surpass the biggest limitation of relational databases, this type of database is not adapted to agile analysis of large amounts of data since it is better fit for adding, deleting and updating data.
11 The two main advantages the layout of data marts and data warehouses - the structures behind the cubes - offer are the fast response time when performing complex queries and the match of the dimensions with the criteria that the users apply when performing analysis.
By using OLAP, one can operate the database and choose a specific set of data by modifying the orientation of data and determine the calculations. This type of navigation through data is called slicing (via rotation) and drilling up/ down (via aggregation and disaggregation).
In essence, a cube is a portion of linked data organized in a way which allows to create two dimensional views, or slices by crossing attributes with metrics. (Sharda, Delen, & Turban, 2015) & (Vercellis, 2009)
A cube can have a multidimensional or tabular structure, these structures will be discussed in the section below.
2.7.1. Multidimensional Structure
The multidimensional structure of a cube is constituted with measures and dimensions originated from a relational database. The multidimensional model is used by the online analytical processing tool to aggregate data in large volume with the objective of allowing fast query response times. There are three main OLAP architectures:
▪ Multidimensional OLAP (MOLAP): In this architecture, data is stored in a multidimensional database. Data from this type of database is stocked in a smaller space than the one used in a relational database. Data is kept in array data structures to provide better performance. Besides, this database has a rich and complex set of functions to analyze the data.
▪ Relational OLAP (ROLAP): It is considered a recreation of OLAP in a relational database that has the benefit of not narrowing the volume of data storage. As the user elaborates the query, the tool accesses the data instead of having already pre calculated aggregations. It allows users to analyze any data without restricting the extension of data.
▪ Hybrid OLAP (HOLAP): This architecture combines the capacities of the ones mentioned above. It has high performance and high scalability however possesses a complex architecture.
The key characteristics of multidimensional modeling are:
▪ Rich Data Model: The modeling of the measures and dimensions can be both simple or complex. Complexity can be originated from many-to-many relationships, for example.
▪ Sophisticated Analysis: In this multidimensional architecture, it is possible to use MDX (this query language is explained ahead). By the use of it, a series of complex calculations can be done.
12 Even though this type of data modeling has many advantages, it is more complex to develop and it is less able to quickly adapt to the alterations of business circumstances. Besides, it requires advanced modeling and MDX skills. (Vitt & Cameron, 2012) & (Prabhuswamy, 2015)
Query performance: Query performance impacts the quality of the experience the user has because of the amount of time it takes to process queries and present results. Aggregations, caching and indexed data retrieval are some of the forms used to speed up query performance.
An aggregation consists on a precalculated summary of data. Each time a query is performed, the system tries to recover the result from cached memory, if no data is in cache, it retrieves data from an aggregation, and if there’s no aggregation present it recovers data from a measure group’s partitions. Caching helps to improve the performance of a query since, throughout querying, memory is used to store results in the storage and query processor caches. Another way to improve query performance is optimize the design of dimensions, cubes and MDX queries. (Vitt & Cameron, 2012) Processing Performance: Processing is the refresh of data in Analysis Services database, the quicker
the processing of data, the sooner the users have access to up-to-date data. By applying query and processing optimization techniques, the database can grow and still be efficient. (Vitt & Cameron, 2012)
2.7.1.1. Pros and Cons of Multidimensional Structure
The biggest disadvantages found on the multidimensional structure are its increased complexity compared to the tabular structure, the fact that it is a consolidated product therefore no major innovations are expected, and finally, it cannot be used with Power View.
On the other hand, it is a mature technology able to deal with advanced modeling and computations requirements. Additionally, it is scalable and capable of dealing with large quantities of data. (Element 61, 2012)
2.7.2. Tabular Structure
The tabular modeling structures the data into related tables. The data can be loaded in two ways: xVelocity and Direct Query. xVelocity in-memory engine stores tabular data in memory to allow fast query response, on the other hand, Direct Query queries directly the database.
The key characteristics of tabular modeling are the following:
▪ Familiarity: Since the handling of data in tabular model is similar to many stored in table relational databases like Excel or Access, it is familiar to many users. Also, it is easier to manage and apply changes since the DAX language (explained in a section below) is considered an extension of the Excel formula language.
▪ Flexibility: This modeling can accelerate the development of the model because data preparation and design rigor are not as strict as in the multidimensional model. This is due to the fact that data is not organized into measures and dimensions. The tabular
13 model is also more prompt to data modifications or changes in relations between tables and calculations complaint with business needs modifications.
Nonetheless of the advantages this model presents, it may not be adequate for sophisticated business needs or very complex datasets. Furthermore, if advanced calculations need to be created, multidimensional capabilities are probably more appropriate. (Vitt & Cameron, 2012)
Querying Performance: When querying a database with the tabular structure, the in-memory engine
browses the memory to collect the data and to compute the aggregations. This leads to high performance rates without the need of special tuning. Even if the memory is restricted, this tool affords basic support in agreement with physical memory. (Vitt & Cameron, 2012)
Processing Performance: Processing in tabular model is more flexible, mainly because this type of
model does not classify data into dimensions and measure groups, besides, it loads data directly into memory without the need of writing into disk. Also, the processing time decreases. Even though it is possible to process various tables in parallel, it is not possible to process individual tables’ partitions at the same time. (Vitt & Cameron, 2012)
Direct Query: Direct Query allows to avoid data processing by writing DAX queries and calculations to
the source database. This feature is particularly advantageous when dealing with frequent refreshing large data volumes. Regardless, there are some limitations since calculated columns and part of DAX functions are not allowed. (Vitt & Cameron, 2012)
2.7.2.1. Pros and Cons of Tabular Structure
Tabular structure is easier to develop than multidimensional model, it has integration with Power Pivot, is more efficient than OLAP in most cases and it is considered a technology for the future. However, there are considerable enhancements to do, it misses advanced computations available with MDX and it is limited to the RAM memory accessible. (Element 61, 2012)
2.7.3. Views and Materialized Views
A view creates a virtual table by logically combining tables and fields when executing a query obeying to rational rules. It defines a function from a combined group of tables to a single derived table, usually, this function is recomputed every time a reference of the view is performed.
A specific type of view will also be used in this project, this type of view is named materialized view. A materialized view is a physical structure that enables better performance since database accesses to the materialized views are much quicker than recomputing an entire view. Thus, a materialized view is a copy of data that can be accessed promptly. The materialization of the view stores the tuples of it in the database, it can be defined on multiple tables and can have selections and group by clauses on different columns. (Agrawal, Chaudhuri, & Narasayya, 2000)&(Gupta & Mumick, 2011)
14
2.8. D
ASHBOARDSA dashboard is a response to the growing complexity of data. It is a visual representation of crucial data which aids executives monitor important points and analyze them in short time. The dashboards have key performance indicators (KPI) with fundamental drivers to broadcast performance across the organization.
The necessity to create dashboards arise from some factors like the demand for integration of metrics related to all departments to analyze performance and resource allocation, the influence of managers in decision making, the goal of enterprises to grow while keeping the costs low and mainly the current poor use of data that is potentially very helpful to make important decisions.
The characteristics a dashboard must possess are the following: having consistent measures and measurement procedures along all departments, be a supportin performance monitoring (evaluative and developmental), ability to be used to plan goals and strategies to the future; and the ability to communicate its performance to the users. Also, what an organization values as performance by the choice of metrics on the dashboard. (Sharda, Delen, & Turban, 2015)& (Pauwels, 2009)
Malik states that a dashboard should be SMART by including these elements: Synergetic – be visually efficient for a user to understand information about different features; Monitor KPIs - should present critical KPIs, these indicators will help decision making; Accurate – the information presented in the dashboard must be precise; Responsive - should answer predefined questions; Timely – information must be current in order to improve decision making. (Malik, 2005)
Furthermore, and besides the elements mentioned before, there are some advanced elements that should be a part of a dashboard that Malik wrapped in the acronym IMPACT: Interactive – should let users drill down to get detailed view; More data history – a dashboard should have history in order to be possible to analyze trends; Personalized – the dashboard should be particular to the users area of responsibility; Analytical – should simplify understanding of the business; Collaborative – the notes regarding characteristics of the dashboard should be shared with the analysists; Trackability – the metrics each department is interested in tracking should be customizable. (Malik, 2005)
2.9. T
ECHNOLOGIES ANDT
OOLS2.9.1. Technologies
▪ Structured Query Language
SQL is a computational language for relational database management and data manipulation used to query, insert, update and modify data. Most relational databases support SQL. (Techopedia, Techopedia, s.d.)
▪ Multidimensional Expressions
MDX is a query language which deals with multidimensional data. MDX is used when traditional SQL no longer serves as a sufficient extractor. (Techopedia, Techopedia, s.d.)
15 ▪ Data Analysis Expressions
DAX are a collection of functions utilized to perform a task and return one or more values. DAX is a formula or query language, not a computer language. It is extremely popular since it is the base for Power BI and it is also used in Tabular SSAS. (Vijalapuram, 2018)
2.9.2. Tools
▪ Microsoft SQL Server
This tool is a relational database management system which stores and retrieves data solicited by other applications.
It provides support to business intelligence and analytics operations and also to a diversity of transaction processes. As the name suggests, the language used in this tool is SQL. (Rouse, 2019)& (Computer Business Review, s.d.)
SQL Server has four main elements:
▪ Database Engine: This element performs as the traditional relational database. (Withee, 2010)
▪ Reporting Services: SSRS is a Business Intelligence component that allows to create reports through the transformed data and handle the access given to the reports.(Withee, 2010)
▪ Integration Services: SSIS manages the ETL process, which means that it aids in the process of transforming data into a standard format to be used by all elements in the organization. (Withee, 2010)
▪ Analysis Services: SSAS incorporates an OLAP tool to analyze the data
online as well as a data-mining engine that helps to find the data requested by the queries. (Withee, 2010)
▪ Visual Studio
Visual Studio is used for several Business Intelligence processes such as building cubes, SSRS reports or ETL processes. It is the main application to develop this type of task.
(Withee, 2010)
▪ Power BI
Power BI is a business intelligence tool and a business analytics solution. It connects to several sources of data, transforms it and allows the users to create interactive reports and dashboards which give insights about the company. Power BI is rooted on several known programs such as SSAS, Power Pivot, Power View and Power Query. That is the reason why, even though Power BI is fairly new, it is familiar to the users. (Vijalapuram, 2018)&(Microsoft, 2019)
Microsoft Power BI has been recognized as a leader in Gartner Magic Quadrant for analytics and business intelligence platforms for thirteen consecutive years as can be seen in the figure below. (Microsoft, Info Microsoft, 2020)
16
2.10. R
ELEVANCE OFC
UBES ANDP
OWERBI
The major advantages of having cubes as data repositories is that they can assure faster response times despite complex queries and dimensions matching requirements of the analysts when performing their analysis. (Vercellis, 2009)
Moreover, the tool used to create dashboards – Power BI – also has many advantages: it is powerful and allows interactive guided analysis, it has monthly releases with several information available online, it is simple to coordinate with Excel, gives a good report perception, holds extensive database availability since it can merge information from different sources and also has a mobile app which permits users to see their reports and dashboards through their phones. (DataFlairTeam, 2019)
Figure 3 – 2020 Gartner Magic Quadrant for Analytics and Business Intelligence Platforms (Adapted from: (Microsoft, Info Microsoft, 2020))
17
3. TABULAR MODELING
Before starting modeling, an extensive data quality project was performed to permit the joining of customers which are the same person with the creation of a master id. In the data quality project, several rules were followed to lump the same customer. The first one was a combination of email, first and last names, the second was a combination of the passport number with first and last names and the last rule was the grouping of telephone number, first and last names. All these combinations had into account the punctuation and the capital and lower-case letters.
To emphasize that the information stemming from the CRM system was considered more reliable than the one coming from the registrations done at the reservation since the information of the CRM is filled by the client directly on Pestana site. In case of records from the same source matching the rules above, the one considered master is the one more complete. However, if the criteria described before is not enough to differentiate between two records, the most recent one is the one which is kept.
After the creation of this master ids (each corresponding to a client), every record which is added to the table is compared to the masters and if the match succeeded it is considered the same person, otherwise a new master id is created.
This data quality project was an essential step before the creation of the models which will be detailed later in this chapter since it allowed to aggregate information corresponding to the same client providing a better data quality than the one previously existing.
After this stage, the project dwell in the construction of two tabular models: Client and PPG. The first model will have all the information regarding a Pestana Hotel Group client, including reservations, surveys, food and beverage consumptions, campaign interactions and events associated with the loyalty card. The PPG model will have information regarding Pestana Hotel Group loyalty program named Pestana Priority Guest and will incorporate information about the events associated with the card and the specific clients that are a part of the program.
The choice of having two models instead of one was due to the direction of the relationships since having a two-way relationship would mean that the Client could filter both the Card and Fact Reservation which leads to a circular reference. Also, having two models instead of one will allow to comply with the requirements of some analysis requested: relate reservations with points and analysis of the points that are not associated with reservations (expired points or points associated to a client, for example). Besides, a Pestana priority guest is necessarily a client however, to be a client it is not necessary to be a part of the loyalty program.
3.1.
M
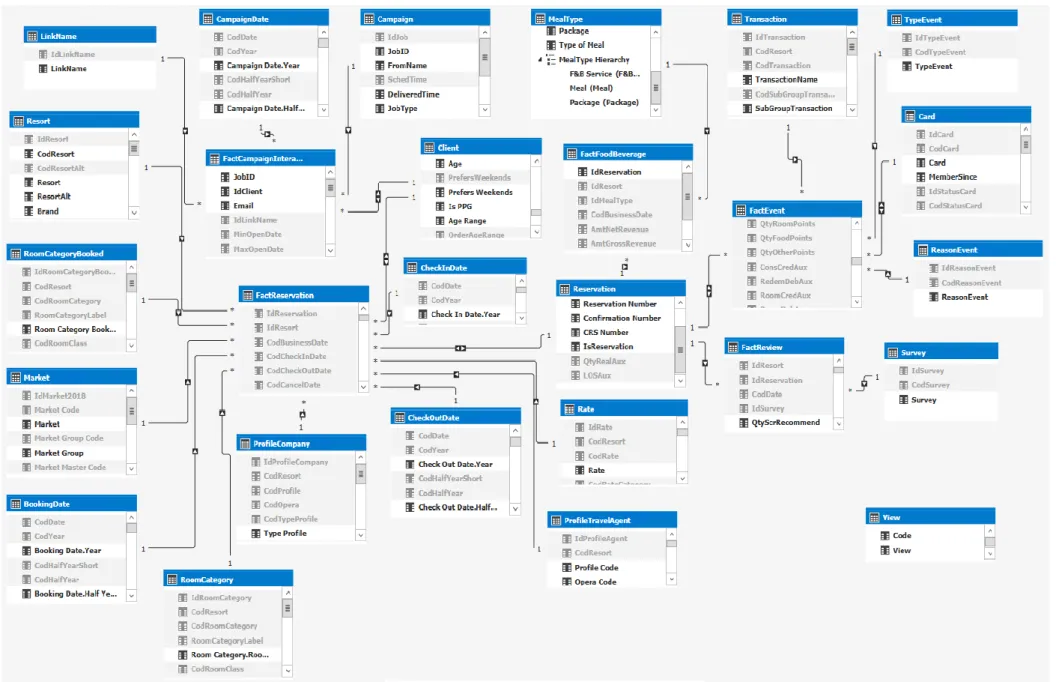
ODELS18 The PPG model will have the following scheme:
3.2. S
OURCET
ABLES ANDT
ABLESD
ESCRIPTIONThe Client model will have 5 factual tables and 21 dimension tables (including 4 date tables: check out date, check in date, booking date and campaign date). The first three date tables mentioned are all connected to the Fact Reservation once the main objective is that this table can distribute date information through all the model. The other date table concerns campaigns.
The factual tables are: ▪ Fact Reservation
Contains the details of the reservation such as number of week and weekend days of the reservation, number of adults and children, quantity of room nights, number of points earned with the reservation, booking window, length of stay, average room rate, among others measures and details that are used to classify a reservation.
Figure 5 – PPG model; Figure 4 – Client model;
19 ▪ Fact Review
This table contains the details stemming from the responses given to the internal surveys each client receives after a stay.
It contains the score given by the guest overall and in the departments related to restaurants, bars and spa. This factual table only contains the details about the internal surveys and not about the online reviews due to the impossibility to link an online review with a reservation of a client.
▪ Fact Campaign Interaction
This table aims at analyzing the campaigns created by Pestana site and email marketing teams. It contains the campaign date, the amount of sent emails, the number of these which were open and the number of clicks in the link sent within the emails.
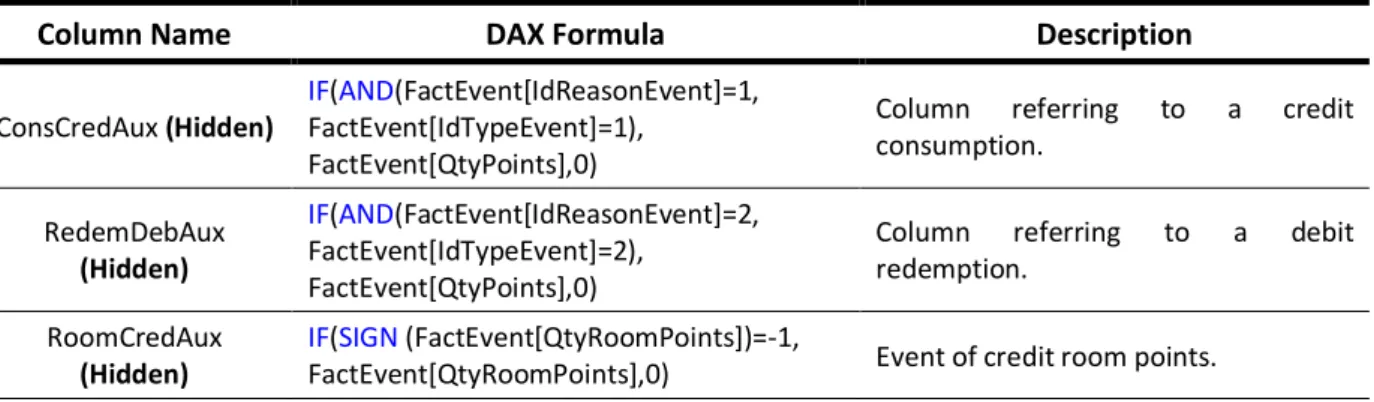
▪ Fact Event
This table contains the details related to the card of the loyalty program (Pestana priority guest). There are several card tiers and different amounts of points that can be earned. The details of this table include the amount of total points, room, food and other (related to other hotel services as for example spa).
▪ Fact Food Beverage
This table comprises the facts of the expenses related to food and beverages, in detail, the net and gross revenue.
The dimension tables are: ▪ Check Out Date
Date table containing the details concerning the check out date. ▪ Check In Date
Date table containing the details concerning the check in date. ▪ Booking Date
Date table containing the details concerning the booking date. ▪ Room Category Booked
Table containing the specifies of the type of room the guest booked at the time of the reservation. ▪ Room Category
Table comprising the specificities of the type of room the guest actually stayed in (there can be overbooking or upgrade situations, for example).
20 Table with the information about the company which made the reservation. This table is only filled when the client reserved through a company, for example in a business trip.
▪ Profile Travel Agent
Table with the information about the travel agent which made the reservation. Contains information about travel agents both online (for example, booking) and offline (for example, viagens Abreu).
▪ Market
Contains the details about the market that the client belongs to (direct, contracted, complimentary, etc.).
▪ Rate
The rate at which the client reserved the night (for example, BAR – best available rate). ▪ Client
Personal information about the client such as name, email, address, phone number or birth date. ▪ Campaign
Details about each campaign. ▪ Link Name
Name of the campaign. ▪ Reservation
Specific details about the reservation: reservation number, confirmation number and CRS number. ▪ Survey
Contains the identification of the survey because there are 4, one for each Pestana brand. ▪ Resort
Details about each resort: location, name, brand among others. ▪ Meal Type
Specific aspect of the meal (breakfast, lunch, dinner) and if it a part of a package or not.
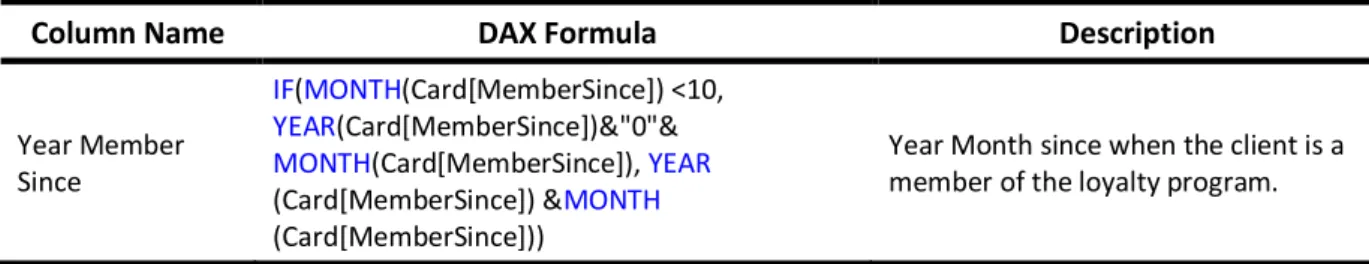
▪ Card
Details about the card. Card number, date of the beginning the membership in Pestana priority guest program, tier of the card, whether the card is active, its expiration date and if it is the card last used (in case there is more than one card associated to a guest).
21 Date table containing the details concerning the campaign date.
▪ Transaction
Table containing the transaction details related to the event. ▪ Reason Event
Table covering the reason of the event, if it is a consumption of points, redemption, purchase, expiration or cancellations.
▪ Type Event
Table that contains the type of event, if it is a credit or debit.
All these tables will constitute a model that will allow to analyze the client with detail.
The PPG model will have 2 factual tables and 7 dimension tables as well as a date table. The model will be named PPG as it is focused on the loyalty program and the events associated with it.
The Fact Event table is similar to the Events table used in the client model, however, since this model has as goal the analysis of the customers associated with the loyalty program, the table was filtered to contain only clients with a CRM number associated. The other factual table present in this model is the Fact Reservation. All the tables in this model are also present in the Client model though the connections are different.
The dimensions present in this second model are: Client, Card, Transaction, Reason Event, Type Event, Resort, Date or Reservation (a brief description of each table was done above).
In this model, the card and the client dimensions are connected to each other since that if the client is a part of the PPG program then it has a card. A client can have more than one card, but each card is associated with only one person.
The connection between these two tables is bidirectional as an analyst could want to analyze through the client point of view or through the card.
3.3.
V
IEWSAs stated by Russo, M. and Ferrari, A., the tabular model built should be established with views of the database tables instead of the tables itself to halt the dependency between the data model and the report.
There are several advantages in importing the views rather than the tables, among them are the following: possibility to add details to the view creation query that will improve efficiency (as NOLOCK), ability to change the column names into friendly or user-known names, capacity to include in the view business logic needed ahead or data transformations and possibility to remove columns that will be useless in the model. (Russo & Ferrari, 2017)
22 Since some of the tables which are going to be a part of this model are already a part of other existing models and cubes, some views were already created. Thus, the already existing views comprise:
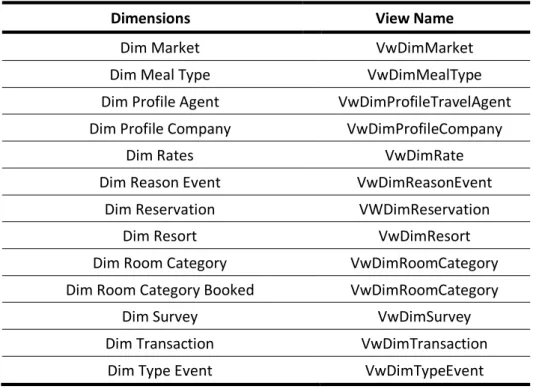
Table 1 – Existing Views in the Data Warehouse;
Dimensions View Name
Dim Market VwDimMarket
Dim Meal Type VwDimMealType
Dim Profile Agent VwDimProfileTravelAgent Dim Profile Company VwDimProfileCompany
Dim Rates VwDimRate
Dim Reason Event VwDimReasonEvent
Dim Reservation VWDimReservation
Dim Resort VwDimResort
Dim Room Category VwDimRoomCategory
Dim Room Category Booked VwDimRoomCategory
Dim Survey VwDimSurvey
Dim Transaction VwDimTransaction
Dim Type Event VwDimTypeEvent
The remaining views were created AS-IS based on the tables already present in the data warehouse with a exception of Dimension Client and Fact Reservation in the Client Model.
The views created AS-IS are the following:
Table 2 – Views created AS-IS;
Dimensions / Facts View Name
Fact Event VwFactEventsClient
Fact Campaign Interaction VwFactCampaignInteractionClient Fact Food And Beverage VwFactFoodAndBeverageClient
Fact Review VwFactReviewClient
Dim Campaign VwDimCampaignClient
Dim Card VwDimCardClient
23 The Client View was created by filtering the master
registrations which were defined in the data quality process as well as filtering the dates in an invalid format. The data warehouse and some column names were hidden to protect the privacy.
The Fact Reservation View was created by joining the fact reservation table with the client dimension table through IdProfileClient, the client dimension was filtered by Code Source, filtering only the ones coming from Opera. This was done to extract the GUID code which will allow the join of the two tables in the tabular model.
In the PPG Model, there were two views that were not created AS-IS: Card and Client.
The Card view was created by joining the Card table with the Client table by CodCustomer, allowing to attain the list of clients who are the same person and extracting the GUID which will permit to establish the relationship in the model.
The Client view was created by adding a filter to the ones previously applied in the client view in the client model (filtering master ids and valid birth dates). The filter applied allowed to differentiate the clients which have a CRM number, meaning they are a part of the loyalty program. Thus, the Client view in the PPG model will only have loyal clients.
Figure 6 – Client View representation;
Figure 7 – Fact Reservation View representation;
Figure 8 – Card View representation;